Geochemical Analysis
Methods
Precious and base metal concentrations were determined in 16 samples of CFM and SIH alteration types using a Perkin Elmer ELAN 6000 inductively coupled plasma mass spectrometer (ICP-MS) at Reading University, UK. Samples were crushed, ground to < 30µm in an agate ball mill and homogenized. Then, 0.5g was digested on a hotplate in open Teflon vessels with hydrofluoric (HF) and perchloric (HClO4) acids to ensure total digest. A 1:10 dilution was made to ensure that the samples satisfied ICP-MS instrumental limits on total dissolved solids and acidity, and 10 ppb Re and 10 ppb Ge internal standard was added. All final concentrations were mass corrected. Oxide interferences (from ZrO on Ag, YO and Pd, HfO on Pt, and TaO on Au) were corrected mathematically using correction factors derived from earlier quantification of oxide interferences relative to CeO/Ce ratios (Table 2). In addition, fifty-one new major and minor element analyses were conducted using Phillips XRF equipment at Sultan Qaboos University, Oman and standard analytical methodology. Summary results are presented in Tables 3-5.
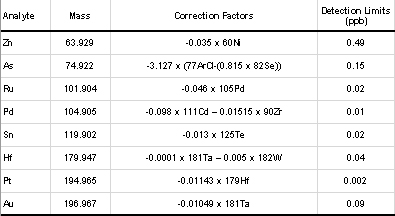 |
| Table 2: Correction factors for oxide interferences. Detection limits for ICP-MS analyses, calculated by replicate (n5) analysis of the relative standard deviation of the blank solution, since blank concentrations are the main limiting factor in the detection limits achievable in PGE analysis (Frimpong et al., 1995). |
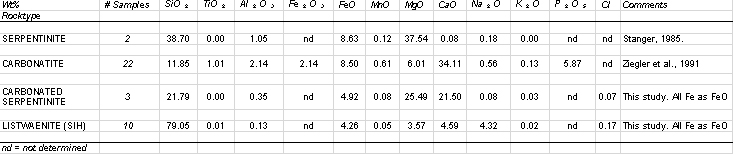 |
| Table 3: Summary major element data for various lithologies from the basal part of the Oman ophiolite. From various sources and new analyses from this study, using XRF. |
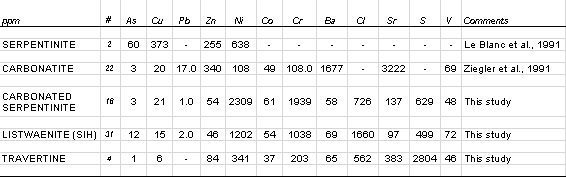 |
| Table 4: Compilation of summary minor/trace element data for various lithologies from the basal part of the Oman ophiolite and new ICP-MS analyses of this study. Analytical results in parts per million (ppb) unless stated. |
The carbonated serpentinite is chemically distinct from unaltered serpentinite. Significant relative enrichment in Ca and depletion in Si reflects abundance of Ca-Mg carbonate. SIH altered serpentinite consists mainly of Si (80%). Small amounts of Fe, Ca and Mg reflect the presence of small amounts of iron hydroxide and carbonate minerals. Both types of altered serpentinite contain significantly more Ni but less Cu & Zn than unaltered serpentinite. Indeed Cu, Pb and Zn are generally present at very low levels in the altered serpentinites, although there is one small occurrence at Wadi Nujum (Fig. 1). Arsenic values remain low, typically less than 20 ppm.
In order to estimate mass/volume changes attending hydrothermal alteration, geochemical analyses were plotted on isocon diagrams (Fig. 4; Grant, 1986). We first considered the possibility that carbonate-altered serpentinite represents a variant of carbonatite. Comparison with carbonatites of northern Oman (Ziegler et al, 1991; Table ) reveal significant chemical differences. Higher SiO2 and MgO in carbonate-altered serpentinite reflects lesser calcite relative to the carbonatite. The carbonatite also contains significantly higher Sr, Ba and Zn. Reference to Fig. 4 shows that most elements in carbonate-altered serpentinite fit approximately to an isocon suggesting significant mass gain during alteration (over 100%). Ca and Ni are somewhat enriched relative to the unaltered serpentinite and Cu is depleted. Thus the frequent occurrence of traces of Ni minerals in the serpentinite is interpreted as the result of hydrothermal addition, rather than relative enrichment due to volume loss. Figure 4 shows that a similar isocon can be produced for the SIH alteration, but the slope suggests greater mass gain (mainly of Si and Ca), consistent with abundant evidence of veining. Cu depletion is also a feature of alteration in the SIH serpentinites, although Ni appears to have been immobile during SIH alteration.
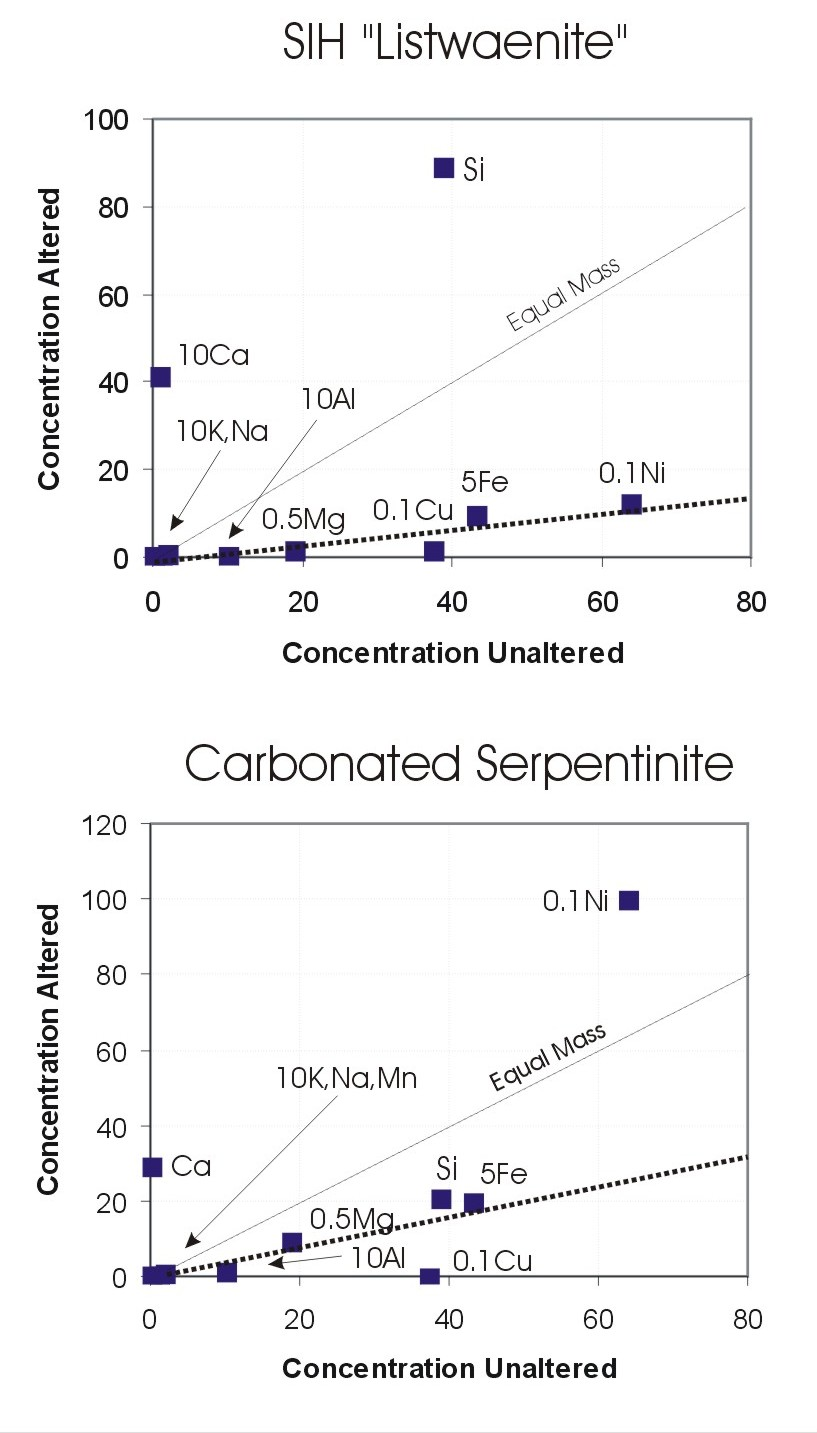 |
Figure 4: Isocon diagrams (Grant, 1986) showing relative mass changes between unaltered and altered serpentinites. |
Table 5 lists some analyses of several samples of travertine collected from inactive spring sites (mounds). Travertine samples are poorer in the mafic indicators Ni and Cr and richer in Sr due to greater abundance of carbonate minerals. The Ni and Cr contents of the rocks are, however, considerably higher than might be expected from a pure carbonate precipitate. It is not surprising that petrographic study reveals that some of the travertine samples preserve textural evidence of replacement of serpentinite (Fig. 3). Sulphur is also conspicuously enriched, and is probably present as a sulphate mineral or minerals rather than a sulphide. The striking similarity between CFM alteration and contemporary travertine, both mineralogically and chemically, suggests a similar process of formation.
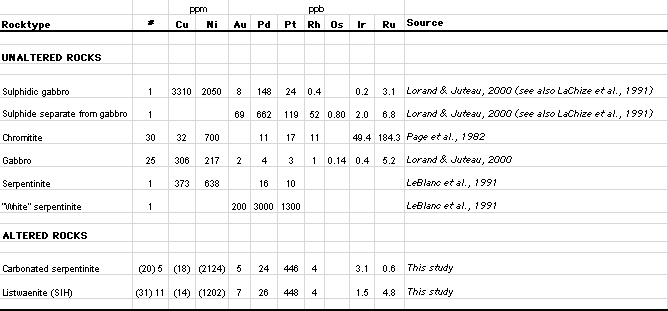 |
| Table 5: Summary precious metal data for various lithologies from the basal part of the Oman ophiolite. Analytical results in parts per billion (ppb) except Ni and Cu which are reported in parts per million (ppm). |
Table 5 shows that many of the studied samples are notably enriched in Pt. Values of between 200 to 400 ppb Pt are common. While these values are an order of magnitude lower than those required for economic extraction, they suggest an unusual hydrothermal concentration process. No Pt-bearing minerals have been detected to date.