2. Programs
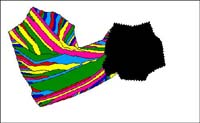
"Vein Growth" and "Fringe Growth" are based on a two-dimensional anisotropic growth function for crystal growth into dilation sites created by movement of rigid wall-rock (veins) and rigid core-objects (strain fringes; Koehn, 2000; Koehn et al., 2000; Bons 2001). The boundary of the "Vein Growth" model is the contact of crystals inside the vein towards the side which could either be represented by rigid wall-rock or neighbouring growing crystals (Fig. 4). The boundary of the "Fringe Growth" model is represented by the host-rock where new grains nucleate (Fig. 5). Parameters that can be changed during a run of the program are opening velocity and opening direction of the dilation site as well as growth velocity and anisotropy of growing crystals. Input parameters are a file describing the shape of the intial dilation site (shape of a fracture or crack for veins and rigid core-object shape for fringes) and a file describing size and orientation of intial nuclei of growing crystals. Grains in the model are defined by nodes that are connected by straight line segments. Growth of grains is simulated by incremental movement of nodes into the open dilation site depending on the growth anisotropy of grains and their growth velocity. Nucleation of new grains takes place at the initial stage of vein or fringe opening, at the contact of fringes and veins to the wall-rock and inside fringes at the growth surface between two grains on a grain boundary. If wall-rock or parts of the object and growing crystals converge on each other, dissolution of vein/fringe crystals occurs. This is simulated by essentially the reverse of the growth routine. "Vein Growth" is described in detail in Bons (2001) and "Fringe Growth" in Koehn (2000) and Koehn et al. (2000). "Vein Growth" and "Fringe Growth" can be downloaded at the Tectonophysics download page , "Fringe Growth" and manual at the Fringe Growth Homepage or at the Journal of Structural Geology www-site (Koehn et al., 2000)."Vein Growth" mimicks the growth of one half of an antitaxial vein or of one crack-seal vein. The wall-rock can be moved away from the growing crystals in any desired xy direction on the computer screen. After an opening increment of the vein (wall-rock movement) crystals will grow into the open crack until they reach the wall-rock. Figure 4 shows a movie of a simulation with a maximum crystal growth rate of 1 pixel/step and an opening of 2 pixels every 20 growth steps. The whole movie shows 1200 growth steps and 60 opening events with a picture taken after every 100th steps. Note that the growth rate of slowly growing crystals is not fast enough to seal the vein (right-hand side in fig. 4). The developing crystal textures are described in more detail in section 3 of this paper.
|
Figure 4. Simulation with the program "Vein Growth". The wall-rock is moved vertically towards the bottom of the figure in 60 opening events. Crystals grow to seal the open crack. |
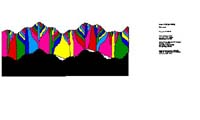
Fringe Growth" mimicks the growth of crystals in antitaxial strain fringes. Each of the two fringes of a fringe structure is simulated separately. The fringe is fixed in the computer reference frame (internal reference frame for a fringe structure; Koehn et al., 2000) and the core-object is moved in any desired xy direction on the screen and can be rotated around its center. Crystals keep on nucleating on the rims of the fringe. Figure 5 shows a simulation of "Fringe Growth" with 17500 growth steps and 500 fringe-opening events. The maximum crystal growth rate is 1.0 pixel/step and the core-object moves 1.0 pixel away from the fringe every 30 growth steps. Crystal textures are described in more detail in section 3 of this paper.
NOTE: length unit is "pixel" and time unit is "step"(representing one calculation step in the growth algorithm).
|
Figure 5. Simulation of antitaxial fibre growth in a strain fringe with the program "Fringe Growth". The fringe is fixed in the computer reference frame and the core-object is moved relative to the fringe and rotated around its center.
|