3. Textures
This section shows simulations of progressive crystal growth in veins and strain fringes and discusses the developing textures.Veins
The first three simulations
(Fig. 6 a-c) with "Vein Growth" show the development of crystal textures
in one half of an antitaxial vein. The wall-rock surface is constructed
using three sinusoidal-functions with different wavelengths (200, 60 and
12 pixels) and amplitudes (120, 40 and 8 pixels). Initial nuclei have
a width of about 8 pixels. In all three simulations the vein first opens
vertically until crystals have reached a steady state texture in terms
of crystal width. Then vein opening changes by 20° towards the right
reducing the tracking-capability of the host-rock asperities (Koehn et
al., 2000). The maximum growth rate of crystals is 1.0 pixel/step in all
simulations and vein opening velocity as well as opening amount per opening
step was varied resulting in different textures.
The first simulation (Fig. 6a) shows 6000 growth stages with vein opening
of one pixel every 20th growth stage resulting in 300 vein opening events.
At the beginning of the simulation the number of growing crystals is reduced
relatively fast with only some crystals surviving. After about 3000 growth
stages crystals have reached a constant width and grain boundaries are
locked to asperities on the host-rock surface. The width of different
fibres is dependent on the distance between adjacent asperities which
is a function of the different wave-lengths that describe the initial
fracture surface. Therefore, the smallest fibres have a width of about
8 pixels and the largest a width of 40 pixels. After a change in the opening
direction some fibre boundaries loose their connection to the wall-rock
surface but most of them track vein opening.
The second simulation (Fig. 6b) lasts 3100 growth stages with the same
number of growth steps per vein opening event as the first simulation
(open every 20th growth stage) but with a larger vein-opening amount (2
pixels per opening step). With these settings, not all crystals grow fast
enough to seal the vein completely. However, crystal textures are very
similar to those of the first simulation (Fig. 6a) during vertical opening.
Once the opening direction changes grain boundaries have less tracking
capabilites as those in the first simulation.
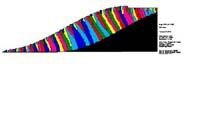
The third simulation (Fig. 6c) lasts 4000 growth stages with an opening
of the vein of 20 pixels every 200 growth events. The tracking capability
of the asperities on the wall-rock surface is greatly reduced, even during
vertical opening, since crystal growth is not as much restricted as it
is in the first two simulations. This results in crystal textures similar
to elongate blade-like crystals that can be found in typical crack-seal
veins since crystals outgrow each other depending on their crystallographic
orientation. However a few grain-boundaries are still tracking the vein
opening and develop relatively large "fibrous" crystals. Their width is
almost completely dependent on the largest wavelength that describes the
wall-rock morphology of the vein because these asperities also have the
largest amplitudes (120 pixels).
|
Figure 6. Three simulations with ""Vein Growth" using different vein opening rates.a) Vein opening of 1pixel every 20 growth stages, b) Vein opening of 2 pixels every 20 growth stages,c )Vein opening of 20 pixels every 200 growth stages. a)
|
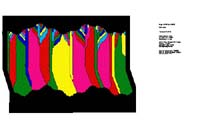
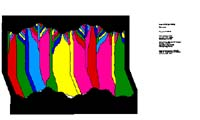
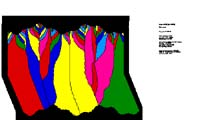
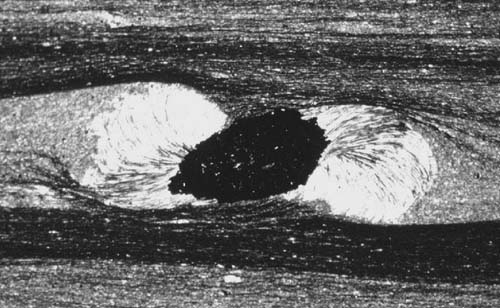
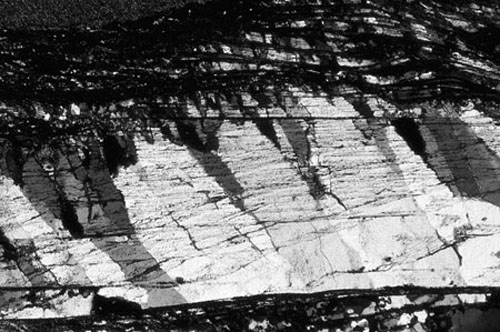
Fig. 7a shows
the simulation of a crack-seal vein with textures similar to striped bedding-veins
found in the Orobic Alps (Italy; Koehn and Passchier, 2000). The simulation
shows 1000 growth steps with a maximum crystal growth rate of 1.0 pixel/step
and a vein-opening of 10 pixels every 40 growth events. The resulting
textures show elongate crystals that grow face-controlled and are not
tracking the horizontal opening direction of the vein. The texture is
very similar to the natural example shown in Fig. 7b.
|
Figure 7. a)Simulation of crystal textures with the program "Vein Growth" to develop patterns found in striped bedding-veins from the Orobic Alps, Italy. b) Natural example of elongate crystals in a striped bedding-vein from the Orobic Alps. Sense of shear is sinistral, opening of the vein horizontal. Width of view is about 5mm.
a) |
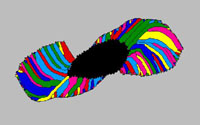
Strain Fringes
In
this section we present six simulations that were performed with the
program "Fringe Growth". Each figure is made up of two simulations,
one for each fringe. We reoriented the simulations relative to an external
reference frame (shear-zone boundary) assuming that fringes opened about
parallel to the extensional ISA in simple shear flow with the flow plane
oriented horizontally and a dextral sense of shear. In this case fringes
and core-object rotate relative to the external reference frame as well
as relative to each other. Note that we define relative rotation as
rotation of the core-object around its centre relative to a fringe that
is fixed in the internal reference frame (computer screen) so that core-object
and fringes have different rotation rates relative to the external reference
frame. Rotation rates for the simulations were taken from natural examples
found in a locality near Lourdes (France) using the "object-centre path
method" described in Koehn et al. (2001, see also section 4 of
this paper). Figures 8 and 9 show simulations that illustrate the effect
of internal nucleation and the effect of relative rotation between fringes
and core-object on crystal textures. Figure 10 shows a simulation of
fringes around a core-object from a natural fringe structure from a
locality near Lourdes (France) described in detail in Koehn et al.
(2001).
The simulation shown in fig. 8 consists of 12000 growth stages with
400 opening events. Growth rate of crystals was 1.0 pixel/step and opening
rate 1.0 pixel every 30 growth stages. Nucleation in the fringe was
turned on so that crystals could nucleate on grain boundaries on the
growth surface of the fringes. The simulation shows the development
of face-controlled fibres, displacement-controlled fibres and intermediate
fibres as well as the growth of fibre bands (Koehn et al., 2000, 2001).
Running the movie in fig. 8, it becomes evident which fibre parts are
growing face- or displacement controlled and why some nuclei develop
into fibre bands whereas others die out. The simulation also illustrates
the development of different crystal textures due to an asymmetric shape
of the core-object, since both fringes in fig. 8 rotated at the same
rates relative to the external reference frame but show different internal
textures and shapes.
|
Figure 8. Simulation with the program "Fringe Growth" to illustrate growth of different fibre types in strain fringes. Fibre bands develop during nucleation of crystals on the growth surface of fringes.
|
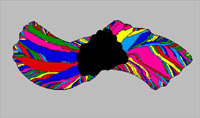
Fig.
9 illustrates the effect of rotation of core-objects (relative to their
fringes) on the growth direction of displacement-controlled fibres.
The simulation consists of 14000 growth steps with 349 fringe opening
events, a growth rate of crystals of 1.0 pixel/step and an opening of
1.0 pixel every 40 growth steps. The core-object is rotating clockwise
relative to the fringes and fringes and core-object are changing their
orientation relative to the external reference frame suddenly at growth
step 10000.
After about 8000 growth steps the core-object has rotated 40° relative
to its fringes. Displacement-controlled fibres next to the object (fibres
of the same age) in the upper part of the right fringe have a different
growth direction than those in the lower part. This is an effect of
relative rotation and shows that for these structures the growth direction
of a single fibre cannot be used for a structural analysis (Koehn et
al., 2000). Note that in this simulation both fringes are relatively
similar in contrast to fig. 8 since the core-object is almost equidimensional.
|
Figure 9. Simulation wtih the program "Fringe Growth" to illustrate the effect of relative rotation of core-object and fringes on growth direction of displacement-controlled fibres.
|
Fig. 10a shows a natural fringes structure from Lourdes (France) and fig. 10b a simulation of fig. 10a with "Fringe Growth". The simulation consists of 6000 growth steps with 300 opening events, a growth rate of crystals of 1.0 pixel/step and an opening rate of the fringe of 1.0 pixel every 20 growth steps. The close similarity in textures between the model and the natural fringe structure supports the validity of the simulations. However if we use the assumption that fringes always open parallel to extensional ISA (Ellis, 1986) in fig. 10 we have to induce sudden changes in rotation rate of fringes and core-object relative to ISA. This can have two possible causes: (1) polyphase deformation with sudden changes in ISA orientation with respect to the fringe structure (Aerden, 1996) or (2) fringes are not always opening parallel to extensional ISA (Koehn et al, 2001).
|
Figure 10. a) Natural example of a fringe structure from Lourdes. Width of view 20mm. b) Simulation of the fringe structure shown in (a)with the program "Fringe Growth" . a) |