The major ionic species obtained from the hydrochemical analysis are projected graphically on the modified Stiff Pattern and Trilinear Piper diagrams (Stiff, 1951; Piper, 1944; and Hem, 1959 and 1983) using USGS software "HC-GRAM" (Hydro-chemical Graphic Representation Analysis Method), version 1.42.
Tables of chemical data are expressed in milli-equivalent per litre (EPM) to be used for these diagrams. The Stiff method uses four parallel horizontal axis extending on each side of a vertical zero axis. The concentration of cations and anions are plotted to the left and right of vertical zero axis. The resulting points are connected to give an irregular polygon shape or pattern, which shows water composition differences or similarities. The width of the pattern is an approximate indication of total ionic contents.
The Stiff Pattern diagrams were prepared for each well and shown all together on the location map of Islamabad to visualize the distribution of groundwater chemistry at first glance (Figure 5). Stiff diagrams indicate sodium and magnesium as the most dominant cations and bicarbonate as the most dominant anion available in the groundwater of Islamabad. However, in the areas like Tarlai Kalan, F-10, I-8 and I-9/4 dominant anions are sulphate and chlorides.
Figure 5. Distribution of groundwater chemistry
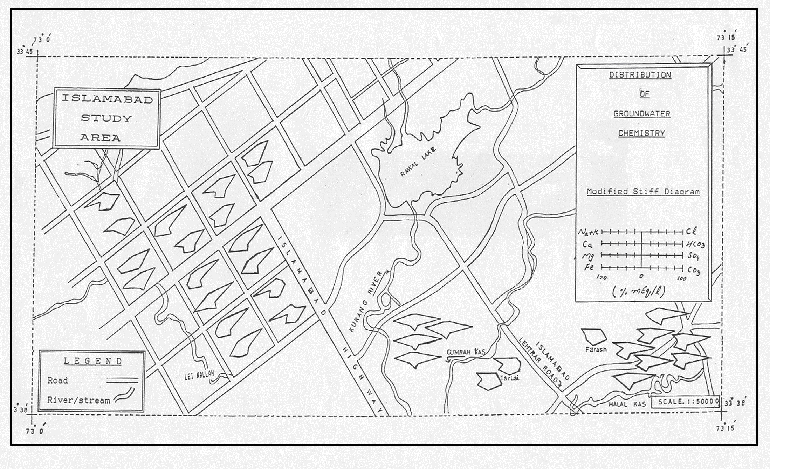
Distribution of groundwater chemistry for Islamabad Sectorial and National Park area using Stiff Pattern diagrams (after Stiff, 1951).
The Trilinear Piper diagram is commonly used in water-chemistry studies, which can show the percentage composition of different ions. By grouping Na+ and K+ together, the major cations were displayed on the trilinear diagram. Likewise, CO3-2 and HCO3- are grouped resulting in three groups of the major anions. The cations and anions were plotted in left and right triangles as a single point. These points are then projected into the central diamond-shaped area parallel to the upper edges of the central area. All these points in the diamond-shaped area represent the total ionic distribution. For each water sample, a single point was obtained in the diamond-shaped area, which represents the total ionic distribution (Figure 6). The water-types interpreted from Trilinear Piper diagrams are summarized in (Table 1). Ahmad (1985) described the significance of groundwater chemistry of Tahlab valley, Balochistan using Stiff Pattern and Trilinear Piper Diagrams.
Plummer et al. (1976) FORTRAN WATEQ (Water Equilibrium) software is used to evaluate different chemical parameters such as numerical values of activity, activity co-efficient (and their logs), molality, equilibrium constant and ion activity product. These could be promptly utilized to further extending this study.
Figure 6. Trilinear Piper diagram
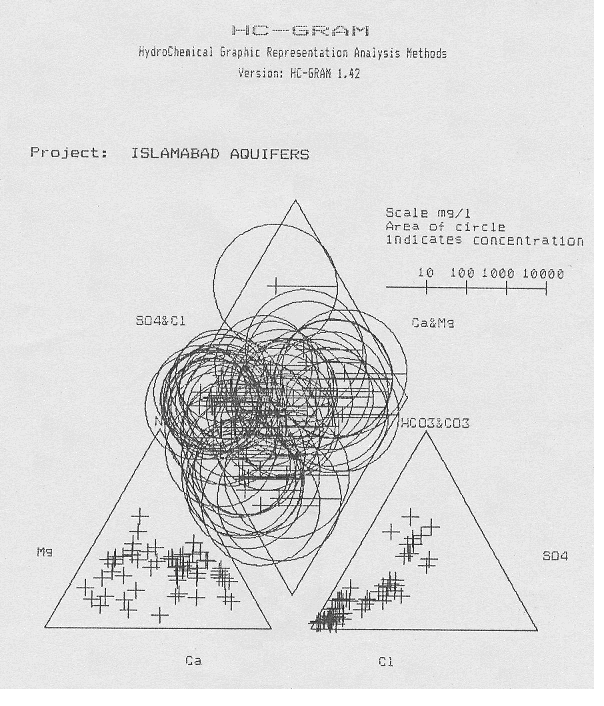
Trilinear Piper diagram (after Piper, 1944) representation of ionic concentrations of tube / dug wells (Islamabad Aquifers).
Table 1. Summary of water-types available in Islamabad.
| Sr. No. | Sector/Area | Water Type |
|---|---|---|
| 1. | Tarlai Kalan | Na Type |
| 2. | Farash | Na Type |
| 3. | Pandori | Ca-HCO3 Type |
| 4. | Dhok Saknal | HCO3 Type |
| 5. | Jhang Saiyadan | HCO3 Type |
| 6. | Ziaratgah | HCO3 Type |
| 7. | Dhok Mori (NP-12) | HCO3 Type |
| 8. | Dhok Mori (NP-13) | Ca-HCO3 Type |
| 9. | Dhok Chapran | Na-HCO3 Type |
| 10. | Sector G-7 | HCO3 Type |
| 11. | Sector G-8 | Na-HCO3 Type |
| 12. | Sector G-9 | HCO3 Type |
| 13. | Sector G-9 (TW-42) | Ca-HCO3 Type |
| 14. | Sector G-10 (TW-73) | Ca-HCO3 Type |
| 15. | Sector G-10 (TW-87) | Na-HCO3 Type |
| 16. | Sector G-10 (TW-108) | HCO3 Type |
| 17. | Sector F-10 | Na-SO4 Type |
| 18. | Sector F-10 (TW-105) | HCO3 Type |
| 19. | Sector H-8 | Ca-HCO3 Type |
| 20. | Sector H-8 (TW-96 & 120) | Mg-HCO3 Type |
| 21. | Sector H-9 | HCO3 Type |
| 22. | Sector H-9 (TW-6) | Ca-HCO3 Type |
| 23. | Sector I-8 | Na Type |
| 24. | Sector I-9 | Ca-HCO3 Type |
| 25. | Sector I-9 (TW-8) | Na-HCO3 Type |
Presence of several poultry farms in National Park area play an important role in deteoriating the quality of groundwater. Prior to start of this study, a landfill site was existed in Dhok Chapran where all wastes of Islamabad and Rawalpindi were dumped. Few years back this landfill site was abandoned and a new landfill site has now been operated in sector H-12.
Results indicate moderate to highly contaminated groundwater in this area caused by the combined effect of poultry farms and previous landfill site. The groundwater is enriched with nitrate concentrations and the colonies of fecal coliform bacteria (Shazia, 1989). As a result many groundwater of the National Park area are not recommended for drinking purposes and other domestic uses.