Experiments (continued)
Experiment
75
In this experiment one boundary of the basal viscous layer was oblique
and made an angle of 35° with the shortening direction (Fig. 1b).
The initial evolution of structures was similar to that in the previous
experiment. A pop-up structure formed close to the mobile wall (Fig.
9a). As deformation increased, in-sequence imbricate thrusts developed
in the brittle domain, while a new pop-up structure formed in the brittle-viscous
domain. That structure formed far away from the mobile wall at the frontal
boundary between sand and PDMS (Fig. 9b). With progressive shortening,
the less advanced thrusts linked up with the farther advanced thrusts
by means of transfer zones (Fig. 9c). In contrast to the previous experiment,
however, the transfer zone underlain by the oblique trending sand-PDMS
boundary developed a strike oblique (35°) to the shortening direction
(Fig. 9c, d). Fig. 10 shows the evolution in cross-section through the
brittle-viscous domain. As in the previous experiment, a forward thrust
that formed in the brittle domain propagated along strike into the brittle-viscous
domain (Fig. 10). This thrust was active at the same time as the most
frontal thrust located at the frontal PDMS-sand boundary (Fig. 10).
The 3D evolution of the oblique transfer zone is shown from different
perspectives in Fig. 11 & 12. The geometry of the transfer zone
is illustrated by serial vertical cross-sections at 6 cm shortening
(Fig. 13). Perspective 3D views reveal the geometry of the oblique ramp
(Fig. 14 & 15; at 7 cm shortening). The maximum dip of the transfer
zone was 30° and decreased along strike toward the frontal ramp.
Backthrusts of the frontal pop-up structure in the brittle-viscous domain
die out along strike in the brittle domain.
 |
| Figure 11.
Movie of 3D evolution with time of experiment 75 illustrating the formation of a transfer zone striking oblique to the shortening direction. Each frame shows a perspective three-dimensional view that consists of 74 serial cross-sections each representing a 2 mm thick CT slice. Brittle domain closest to viewer. Initial width and height of the model was 27 cm and 3 cm, respectively. Shortening increment between frames is 1 cm. (Select image to view animation) |
 |
| Figure 12.
Movie of 3D evolution with time of experiment 75 illustrating the formation of a transfer zone. Each frame shows a perspective three-dimensional view that consists of 74 serial cross-sections each representing a 2 mm thick CT slice. Brittle-viscous domain closest to viewer. Shortening increment between frames is 1 cm. (Select image to
view animation) |
|
|
Figure 13.
Movie illustrating the geometry of part of the model (experiment 75) by a series of serial vertical sections at 6 cm shortening. Note how the active frontal thrust in the brittle domain propagates laterally into the brittle-viscous domain. Computer animation shows 74 frames at 3 frames per second.
(Select image to view animation) |
 |
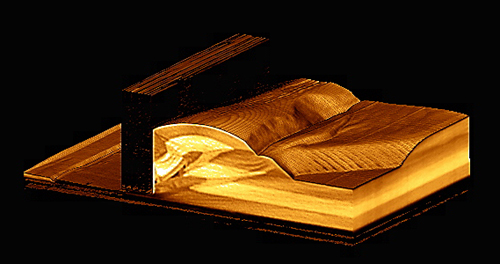
| Figure 14.
Movie showing cut-out 3D views of experiment 75 at 7 cm shortening. The longitudinal sections through the 3D views show clearly that the oblique ramp roots at the basal viscous layer and has a shallow dip (< 30Ð). (Select image to view animation) |
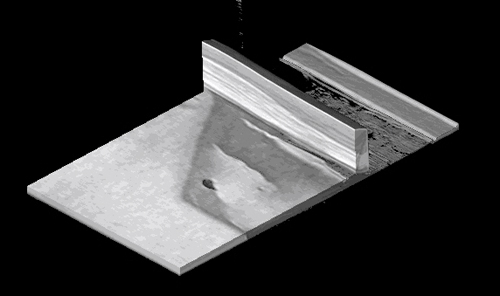 |
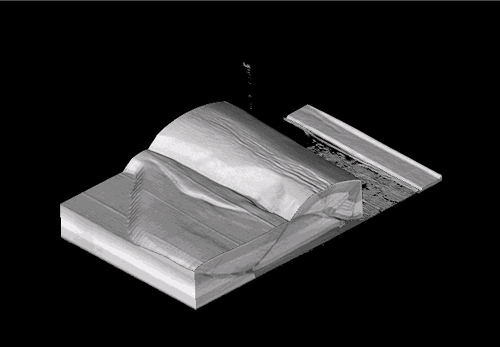
| Figure 15.
Movie showing cut-out 3D views of experiment 75 at 7 cm shortening. The horizontal sections show the curvature of the thrust front and how backthrusts die out along strike as they approach the transfer zone. (Select image to view movie) |