Experiments (continued)
Experiment 73 in surface view and the development of a transfer zone (continued)
The frontal thrusts linked up along transfer zones that formed subparallel to the shortening direction (Fig. 3c). Figures 4 and 5 show the 3D evolution of a transfer zone from two different perspectives. Note that the thrust imbricate that formed in the brittle domain in the footwall of the pop-up structure propagated laterally into the brittle-viscous domain and caused the out-of-sequence thrust in the latter domain (as seen in cross-sections; Fig. 2 & 5). The 3D geometry of the transfer zone (after 6 cm shortening) is illustrated by serial vertical cross-sections (Fig. 6). In longitudinal sections parallel to the mobile wall, the fault defining the transfer zone rooted at the sand-PDMS boundary and had a listric shape (Fig. 7). This fault is a lateral ramp striking subparallel to the shortening direction. The dip of the lateral ramp decreased along strike toward the frontal ramp in the brittle-viscous domain, from about 30° to less than 10° (Fig. 7). In horizontal sections through the transfer zone, the curvature of the thrust front is clearly visible (Fig. 8). These sections also show how the backthrust of the frontal pop-up dies out along strike as it approaches the transfer zone. In the area of the transfer zone, coeval movement occurred along several thrusts, whereas fault activity in the brittle domain was restricted to the foremost forward thrust (Fig. 4 & 5). As a consequence, the initially curved geometry of the thrust front in surface view became less pronounced with progressive shortening (see final stages of Fig. 4 & 5).
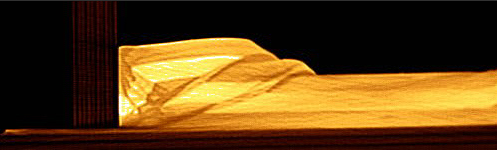 |
| Figure 6. Movie illustrating the geometry of part of the model (experiment 73) by a series of serial vertical sections at 6 cm shortening. Note how the active frontal thrust in the brittle domain propagates laterally into the brittle-viscous domain where it represents an out-of-sequence thrust that is active at the same time as the pop-up structure that formed at the frontal sand-PDMS boundary. Computer animation shows 88 frames at 3 frames per second. The lateral ramp defining the transfer zone is visible in frames between t = 9 seconds and t = 12 seconds. (Select image to view animation) |
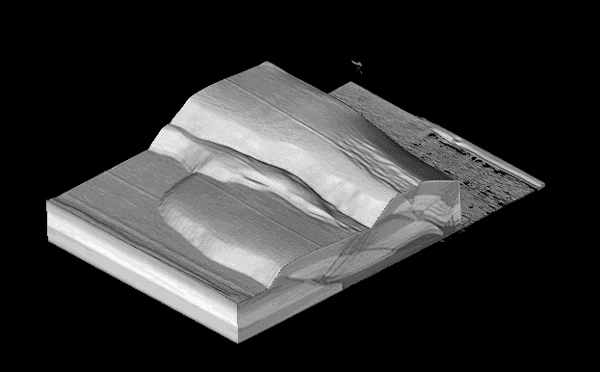 |
| Figure 7. Movie showing cut-out 3D views of experiment 73 at 7 cm shortening. The longitudinal sections through the 3D views show clearly that the lateral ramp roots at the basal viscous layer and has a shallow dip (< 30Ð). PDMS = dark grey, quartz sand = medium grey, corundum powder = light grey.(Select image to view animation) |
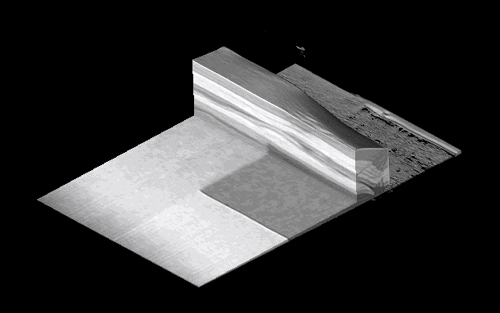 |
| Figure 8. Movie showing cut-out 3D views of experiment 73 at 7 cm shortening. The horizontal sections show the curvature of the thrust front and how backthrusts die out along strike as they approach the transfer zone. (Select image to view animation) |
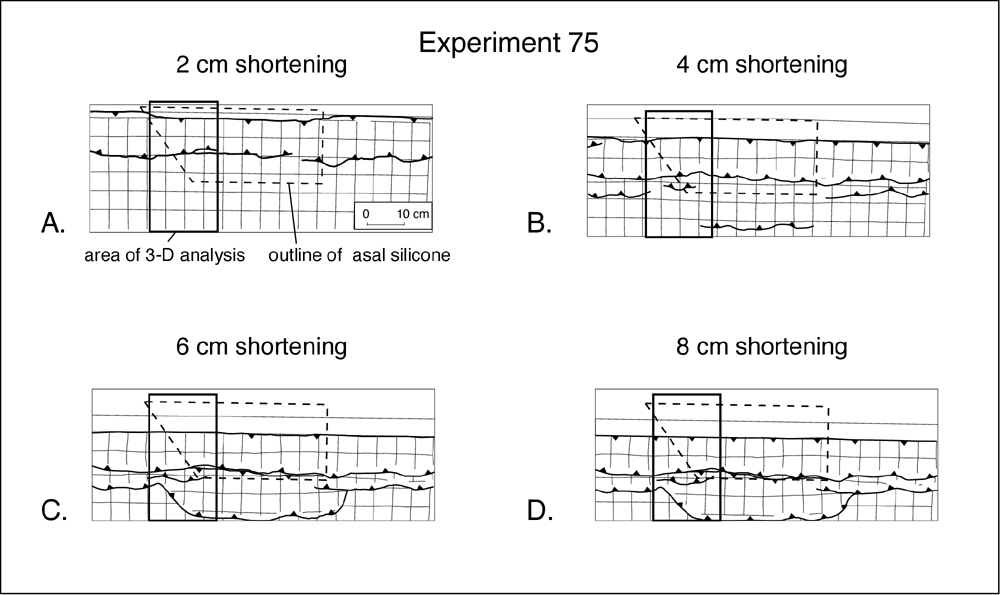 |
| Figure 9. Line drawings after plan view photographs of experiment 75 illustrating progressive development of surface structures at 2, 4, 6 and 8 cm of shortening. Transfer zones connecting frontal ramps develops oblique to the shortening direction. (Click for Enlargement) |
 |
|
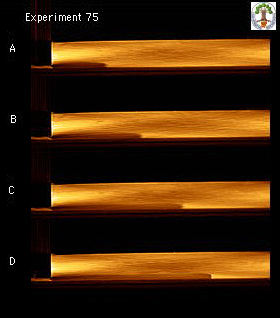
Figure 10.
Cross-sectional evolution of experiment 75. Each section represents a 2 mm thick X-ray computerized tomography (CT) slice that was acquired parallel to the shortening direction. Initial width of the model was 27 cm; initial height was 3 cm. Shortening increment between frames is 1 cm. |