The scaling theory for analogue modelling of geologic processes has first been described by Hubbert [1937] and has later also been discussed by Horsfield [1977], Davy and Cobbold [1991] and Cobbold and Jackson [1992]. Here, the most important relationship is the one that relates surface forces (stresses) to body forces (gravity). When the experiments are executed in a normal field of gravity, stresses should be scaled down as the product of density and length scales down [Horsfield 1977; Davy and Cobbold 1991]. In the experiments described here a scale factor of ~ 1-2.5 x 10⁻⁷ (1 cm in experiment resembles ~ 40-100 km in nature) and a density factor of ~ 0.5 have been applied, thus stresses should be scaled down by ~ 1.25 x 10⁻⁷ – 5 x 10⁻⁸. For brittle rocks, their cohesion and friction coefficient are the most important parameters, as described by Coulomb’s fracture criterion [Coulomb, 1776]. Since cohesion has the dimensions of Pascal (Pa), it should be scaled down in a similar fashion as stresses [Davy and Cobbold 1991; Cobbold and Jackson 1992]. Furthermore, the friction coefficient is dimensionless, thus it should have similar values in both model and nature. Finally, for viscous material, viscosity should scale down as the product of stresses and time scales down [Davy and Cobbold 1991]. The experiments described here are executed in the normal field of gravity and the materials used in the experiments have been chosen as such, that they have been properly scaled to model the deformation of natural rocks.
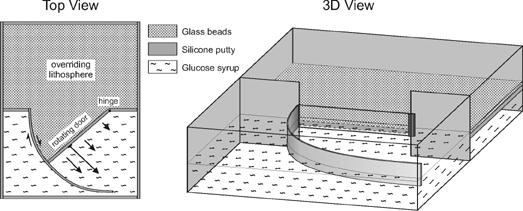
A model has been constructed to simulate back-arc extension in the overriding plate due to asymmetrical rollback. The model consists of only three layers in order to preserve the simplicity of the experiment (e.g. conform Hatzfeld et al. [1997], Gautier et al. [1999] and Martinod et al. [2000]). The layered system is confined in a 60 by 40 cm box. On one side of the box a rotational sidewall is situated, which can rotate outwards in an anticlockwise fashion (Figure 3), simulating the progressive anticlockwise retreat of the hinge-line of the subducting plate. The uppermost two layers represent the overriding lithosphere. The lowermost layer represents the asthenosphere and gives the overlying lithosphere isostatic support. The uppermost brittle layer is made of fine-grained glass microspheres simulating the brittle upper lithosphere in nature, which are properly scaled to model brittle behaviour of rocks, especially when used for extension related experiments [Schellart 2000]. The high viscosity middle layer is made of silicone putty (mixed with a dense filler) with a viscosity of ~ 2 x 10⁴ Pa·s, simulating the viscous lower lithosphere in nature. The lowermost viscous layer is made of glucose syrup with a viscosity of ~ 100 Pa·s. The experimental properties of the individual experiments discussed in the text are given in Table 1. The progressive opening of the sidewall is driven by a step-motor. A passive grid (line spacing = 3 cm) and marker spheres have been laid on top of the brittle layer to monitor displacement and deformation. The progressive development of the model has been recorded by a digital camera from above, under oblique lightning of the top surface of the experiment.
Table 1. Experimental properties
| Experiment |
Material |
Rheology |
Layer Thickness (cm) |
Opening rate (°/hr) |
Density |
| 1 |
| Microspheres |
| Silicone |
| Glucose |
|
| Brittle |
| High-viscosity |
| Low-viscosity |
|
|
21 |
|
| 2 |
| Microspheres |
| Silicone |
| Glucose |
|
| Brittle |
| High-viscosity |
| Low-viscosity |
|
|
12 |
|
| 3 |
| Microspheres |
| Silicone |
| Glucose |
|
| Brittle |
| High-viscosity |
| Low-viscosity |
|
|
12 |
|
| 4 |
| Microspheres |
| Silicone+sand |
| Silicone |
| Glucose |
|
| Brittle |
| Viscoplastic |
| High-viscosity |
| Low-viscosity |
|
|
12 |
|
| 5 |
| Microspheres |
| Silicone |
| Glucose |
|
| Brittle |
| High-viscosity |
| Low-viscosity |
|
|
36 |
|
| 6 |
| Microspheres |
| Silicone |
| Glucose |
|
| Brittle |
| High-viscosity |
| Low-viscosity |
|
|
12 |
|
| 7 |
| Microspheres |
| Silicone |
| Glucose |
|
| Brittle |
| High-viscosity |
| Low-viscosity |
|
|
12 |
|
| 8 |
| Microspheres |
| Silicone |
| Glucose |
|
| Brittle |
| High-viscosity |
| Low-viscosity |
|
|
4 |
|
| 9 |
| Microspheres |
| Silicon |
| Glucose |
|
| Brittle |
| High-viscosity |
| Low-viscosity |
|
|
21 |
|