| Schreurs,
G., Hänni, R. and Vock, P.
2002. The
influence of brittle-viscous multilayers on faulting during rifting: an
analogue modelling approach. Schellart, W. P. and Passchier,
C. 2002. Analogue modelling of large-scale tectonic processes. Journal of
the Virtual Explorer, 7, 87-94. |
|
Experimental
results
Single
stage rifting - Experiment 77
The evolution
of the fault pattern in the single stage rifting experiment as seen in
surface view (Fig. 3 & 4) is closely related to the distribution of
brittle and viscous layers at depth. In domain with a basal viscous layer
overlain by brittle layers, the spacing between conjugate normal faults
was larger than in the domain that had a second, upper viscous layer embedded
in brittle layers (see experimental set-up; Fig. 1). As normal faults
propagated along strike they either linked or overlapped with other sub-parallel
oriented faults. In some cases lateral propagation of different normal
fault segments induced a change in fault orientation in the area where
they met. With progressive extension, new faults appeared within previously
formed grabens. Extensional transfer zones mark the transition between
widely spaced conjugate faults and narrowly spaced conjugate faults and
closely mimic the position of the underlying interbedded weak layer. Where
this boundary is initially parallel to the extensional direction, the
alignment of transfer zones is also more or less parallel to it; where
this border is initially at an angle of 30° to the extension direction,
the transfer zones also forms at an angle of 30°. Note that normal
faults in the domain above the interbedded weak layer did not form instantaneously
across the entire long dimension of this domain. As a result some transfer
zones also formed in this domain.
|
|
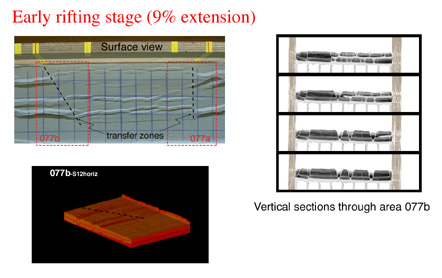
| Figure
3. Structures in experiment 077 after 9% extension as seen in
surface view, vertical sections and in cut-out view. Black dashed
lines in surface view indicate major transfer zones located above
the interbedded viscous layer. Dashed red rectangles indicates areas
analysed by X-ray tomography. |
 |
| Figure
4. Movie
showing surface evolution of experiment 077. Note the difference in
graben width between domain with a second, interbedded viscous layer
(see Fig. 1 for its location) and adjacent domains with only a basal
viscous layer. Initial grid spacing on surface was 4 cm. First frame
is after 5 mm of extension. Subsequent frames are at 5 mm extension
increments.(Select
image to view movie) |
Fig. 5 shows the evolution
of structures in four cross-sections through part of the model. The fault
evolution was very different in domains with and without an interbedded
viscous layer. In those parts of the model with an interbedded weak layer
progressive extension resulted in decoupled conjugate normal fault systems
in upper and lower brittle strata. The horizontal distance between graben-bounding
normal faults was small and the offset along individual faults was limited.
In contrast, in the domain without a second interbedded viscous layer,
the grabens were fewer, deeper and wider, and faults extended all the
way down to the top of the basal viscous layer. Initial graben width reflects
the depth to the viscous layer. A larger vertical distance to the viscous
layer results in a wider graben. Fault offset along existing faults increased
with progressive extension. In large grabens new steep normal faults formed
that are antithetic to the bounding faults and merged with them at depth.
Although normal faults at early stages of extension were straight in cross-section,
they became listric with progressive deformation and fault-bounded blocks
rotated about a horizontal axis. In the domain with an interbedded viscous
layer, conjugate normal fault systems in the lower brittle compartment
formed at different locations than in the upper brittle compartment. The
formation of conjugate normal faults in the lower compartment caused a
downbending of the overlying brittle compartment and lateral flow of the
interbedded viscous layer. At the final stages of extension, parts of
the upper brittle compartment were in contact with the lower brittle compartment.
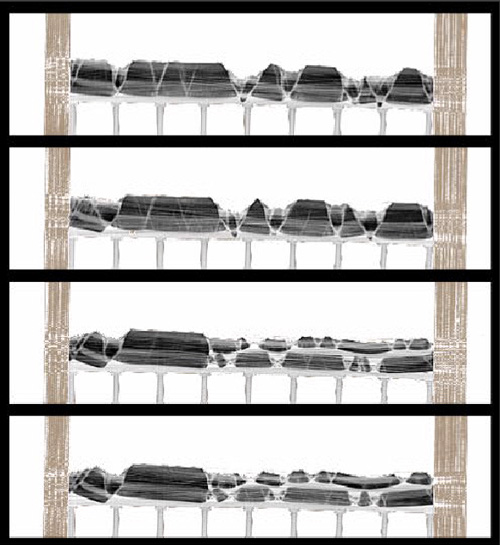 |
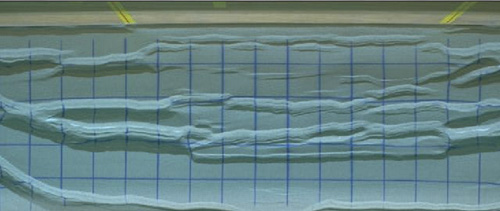
| Figure
5. Successive
vertical CT images through the brittle-viscous model (domain 077a;
see Fig. 3): two sections cross the domain with two viscous layers
(upper two images), and two the domain with only a basal viscous layer
overlain by brittle layers (lower two images). Corundum is dark grey;
sand is medium-grey, and viscous PDMS is light-grey. Initial width
of model was 22.5 cm and initial height 3.5 cm. Extension increment
between frames is 5 mm.
(Select
image to view movie) |
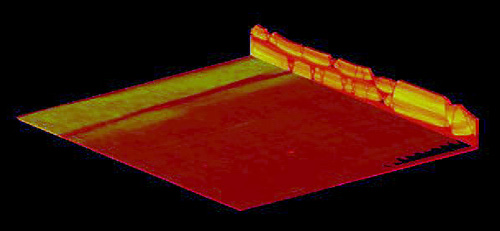
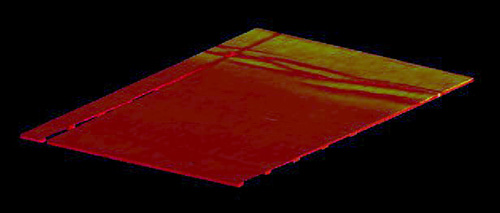
Fig.
6 shows the 3D evolution of part of the model with time. Progressive extension
manifested itself differently in domains with and without an interbedded
viscous layer. In the latter domain grabens are fewer, wider and deeper.
Transfer zones form in the transition zone between the two domains. Fig.
7 illustrates the drastic lateral changes in the structural style across
the transition zone by 80 serial vertical cross-sections at 9% extension.
Oblique transfer zones that strike parallel to the boundary of the interbedded
viscous layer (Fig. 8) can be followed at depth in Figs. 8 and Fig. 9.
The latter figure consists of a series of horizontal sections at 9% extension.
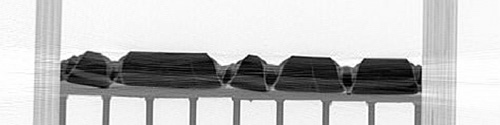
Fig. 10 shows the structures in experiment 077 at 18% extension, while
Fig. 11 and 12 show serial horizontal sections through transfer zones
at the same stage of deformation. Note how some of the faults in the lower
brittle compartment – below the interbedded viscous layer - die out
laterally towards the domain with only one basal viscous layer.
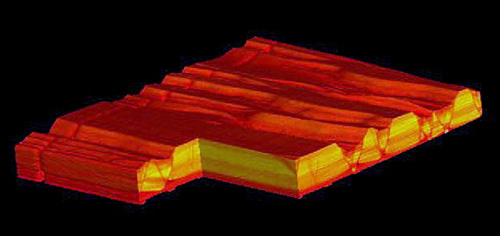 |
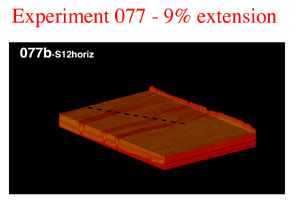
| Figure
6.
Movie of 3D evolution with time of experiment 077 (domain 077a; see
Fig. 3) showing the development of a transfer zone parallel to the
extension direction. Each frame shows a cut-out 3D view that consists
of 80 serial cross sections each representing a 2 mm thick CT slice.
Extension increment between frames is 1 cm. Viscous silicone (PDMS)
is red, quartz sand is orange and corundum powder is a dark yellow
to orange. (Select
image to view movie) |
 |
| Figure
7. Movie showing the geometry of part of experiment 077 by 80
serial vertical sections after 9% extension. Note the drastic change
in structural style as soon as the interbedded viscous layer appears.(Select
image to view movie) |
|
|
| Figure
8. Horizontal
section through 3D cut-out perspective view showing oblique transfer
zone after 9% extension (domain 077a; cf. Fig. 3). |
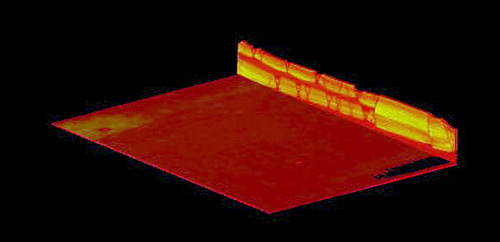 |
| Figure
9. Successive
horizontal sections through 3-D perspective view after 9% extension
(domain 077b). The location of the oblique extensional transfer zone
is linked to the oblique boundary of the interbedded viscous layer.
(Select
image to view movie) |
|
|
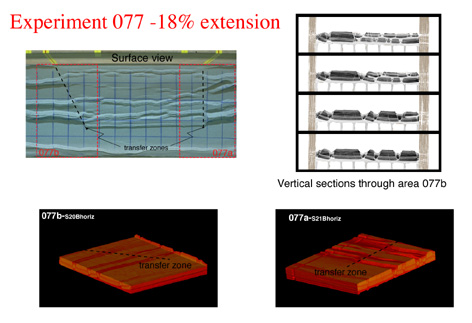
| Figure
10. Structures
in experiment 77 after 18% extension illustrated by surface photograph,
vertical sections and two cut-out 3-D perspective views. Transfer
zones are related to the shape and position of the interbedded viscous
layer. |
 |
| Figure
11.
Successive horizontal sections through 3-D perspective view after
18% extension (domain 077b; see Fig. 10). (Select
image to view movie) |
 |
| Figure
12. Successive
horizontal sections through 3-D perspective view after 18% extension
(domain 077a; see Fig. 10).
(Select
image to view movie) |
|