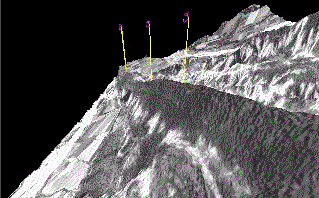
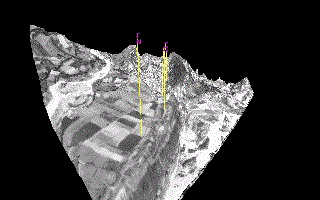
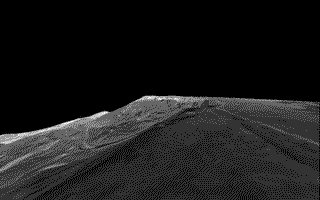
To become fully three dimensional, it is necessary to integrate volumetric data into the Digital Outcrop Model. This can be undertaken in a variety of ways. Xu et al. (2000) for example used surveyed control points to rectify cliff photographs, and integrated bore-hole and Ground Penetrating Radar (GPR) data to produce a 3-D ‘virtual outcrop’ of a Cretaceous Austin Chalk outcrop, in Texas, US. Research shown here has correlated Upper Campodarbe Group sand-rich turbidite channel units near Ainsa, Spain, by integrating aerial photogrammetric output with shallow cores drilled behind outcrop faces. The exceptionally well exposed, turbidite channels form prominent ridges, which are clearly visible in the animation shown in Figure 5. Due to the complex topography, correlation of sandbodies by conventional mapping had proven to be difficult and time consuming. Accurate, photogrammetric measurements has been combined with the shallow core information to provide a 3-D stratigraphic framework of the area. The model can then be verified and refined by subsequent detailed field measurements.
Figure 5. Animation fly-through over the Upper Campodarbe Group turbidite deposits, Spain
Animation fly-through over the Upper Campodarbe Group turbidite deposits, Spain near Figure 1. Aerial photogrammetric output has been combined with shallow core-log information derived from drilling behind outcrop faces.
Ongoing internal research is utilising shallow geophysical techniques, in this case Ground Penetrating Radar (GPR) to provide 3-D volumetric data by imaging sub-surface geology (Pringle et al. 1999). A series of GPR profile in-lines and cross-lines were acquired over a study area in Derbyshire, UK. These profiles have captured the 3-D architecture of deep-water, sand-rich units exposed in the outcrop cliff section shown in Figure 4. The 2-D GPR profiles are integrated into the DOM to create the Digital Solid Model, shown in Figure 6. From integrating surface geological information and subsurface geophysical information, multiple palaeo-channels have also been interpolated. Figure 7 shows an animation fly-through of this model, generated in Bentley Microstation software, which allows visualisation of the complete field area, rather than a static view.
Figure 6. Digital Solid Model (DSM)
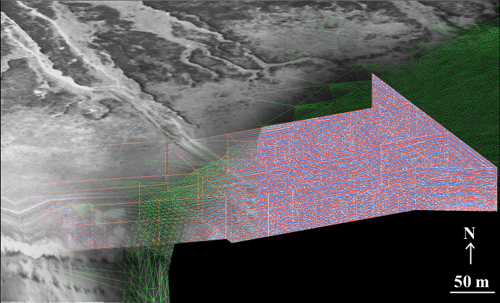
Multiple 2-D Ground Penetrating Radar (GPR) profiles have been incorporated into photogrammetric output to create a Digital Solid Model (DSM) of the Upper Carboniferous, turbidite deposit in Derbyshire, UK. The DSM has been partially removed to show the underlying DEM (green) and GPR (red and blue lines) data.
Figure 7. Animation through the Derbyshire DSM
Animation through the Derbyshire DSM, shown in Figure 6. GPR profiles are shown as the multi-coloured, slices viewed beneath the outcrop surface, with the brown lines indicating the interpolated, sub surface palaeochannels.