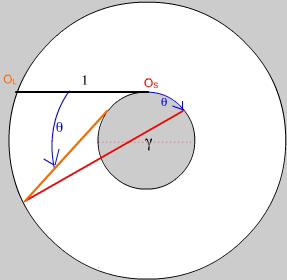
Figure 8. Construction for simple shear strain. Click here to animate.
The construction for strain is similar to that for stress except that the origins are renamed "origin of lines", OL, and "origin of strains", Os, respectively, and the deformation generally includes a component of rigid rotation. Figure 7 shows a screen shot from an animation of the case of simple shear.
To construction a diagram for simple shear by hand,
(i) draw an inner circle with diameter g equal to the shear strain,
(ii) draw a tangent of unit length in the direction of slip and label its ends OL and Os, as in Fig. 8,
(iii) draw an outer circle passing through end of the tangent, OL.
Now you are ready to determine the stretch and rotation of an arbitrary line, say one at -32° (counterclockwise) from the origin of lines, OL. Analogous to the case of stress, you rotate the tracing overlay through an angle of -32° and set off an angle +32° clockwise from the origin of strains, Os, yielding the red line of Fig. 8. This has the deformed length and orientation of the initial orange line. For reference, equivalent off-axis Mohr circle constructions are inset in the animation.
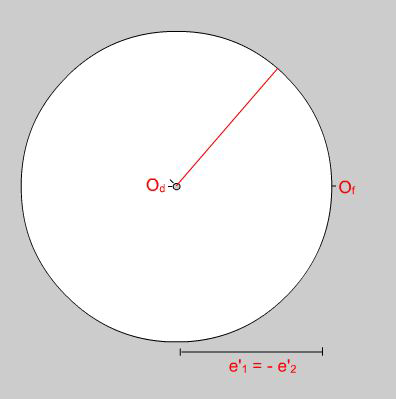
Figure 9. The construction for flow (a.k.a. velocity gradients).
Whilst the final state of deformation of a rock is of potentially great interest, kinematic analysis is essential for a full understanding of structural evolution. Fabrics in mylonites are particularly strongly controlled by the kinematic character of the flow regime. An animated flow construction for progressive pure shearing is linked to Fig. 9. This is equivalent to an extreme case of the construction for stresses of unlike sign (Fig. 6) in which the circle representing the sum of the principal vectors shrinks to zero, because they are equal but opposite, and the flow is represented by a circular ellipse with axes of opposite sign (Fig. 10). Nevertheless, the construction rules are unchanged. To determine the flow vector for a particular direction, the tracing overlay is rotated through the desired angle about the circle on which the origin of directions, Od, resides (i.e. the one that has shrunk to a point) and an equal but opposite angle is set off from the origin of flow, Of. The origins are renamed so that it is immediately clear from the labels which is a construction for stress, strain, and flow.
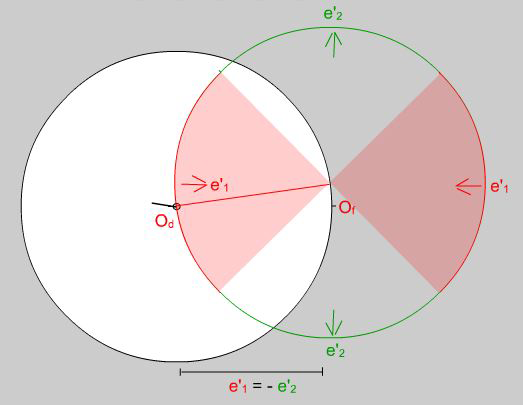
Figure 10. Flow ellipse for progressive pure shearing. The red shaded area represents flow vectors with a component of shortening. The black tick marks the direction to which the red flow vector applies.
All tensor phenomena in nature can be represented in a variety of ways. A purely algebraic representation using matrices suffices in theory but for most people, visual cues aid in the discovery of solutions to problems. The stress, strain, and flow ellipses (/ellipsoids) are useful for illustration and visualization purposes but they are difficult to plot and measure in quantitative studies. Graphs combine the qualities of visualization and measurement but their effectiveness is reduced when the relationship between the space of plotted values and geographic space becomes obscure, as is certainly the case for the classical Mohr construction. The new doughnut construction presents the same data in a more easily visualized format. The plot has the major advantage that it displays vector data in their correct spatial orientations. There is an added advantage that it builds on the orientation net skills that all students of structural geology acquire at an early stage. It obviates the need for complex constructions involving Mohr circle poles and off-axis circles.
The method is implemented in the on-line version of this paper using computer animation but the construction is also suitable for traditional pencil-and-tracing-paper applications in the teaching laboratory. Indeed, it is important for students to practice all such methods by hand; the role of animation is to aid visualization and rapid acquisition of a basic understand, and also to provide convenience and accuracy after the hand method has been mastered. The author's recent teaching experience (ES71 - Tectonics and Structural Geology - at Harvard University, and ES301 - Structural Analysis - at Boston University) suggests that the new approach saves at least one hour of lecture time and four hours of lab. Seemingly trivial details, such as the fact that, in the stress construction, compression is plotted downwards, dextral shear to the right, and sinistral shear to the left, can add up to a significant saving in comprehension time and effort.
Of course, there are cases where both the classical and modern Mohr constructions are desirable, in which cases the polar plots are converted to the Mohr reference frame simply by lift the tracing overlay off the polar net and orienting it horizontally.
I thank Carl Jacobson and an anonymous reviewer for very helpful comments, and Megan Hough for careful assembly of the complex electronic documents involved.
Bayly, B. 1991. Mechanics in Structural Geology. Springer-Verlag, New York.
Bons, P.D. and Urai J.L., 1992. Syndeformational grain growth: microstructures and kinetics. Journal of Structural Geology, 14:1101-1109.
Davis, G.H. and Reynolds, S.J., 1996. Structural Geology of Rocks and Regions (2nd. ed.). John Wiley & Sons, New York. De
Paor, D.G. and Means, W.D. 1984. Mohr circles of the First and Second Kind and their use to represent tensor operations. Journal of Structural Geology, 6: 693-701.
Means, W.D., 1976. Stress and Strain: Basic Concepts of Continuum Mechanics for Geologists. Springer-Verlag, New York.
Means W. D., 1990. Synkinematic microscopy of transparent polycrystals. Journal of Structural Geology, 11, 163-174.
Passchier, C.W. and Urai J.L., 1988. Vorticity and strain analysis using Mohr diagrams. Journal of Structural Geology, 10: 755-763.