The model presented above can be considered, in a highly simplified first approximation, as a consequence of flow between two rigid plates, which are moved closer to each other. The process is similar to the deformation in triaxial deformation machines where a ductile sample is shortened between two rigid pistons without lubrication between piston and sample.
Further simplifying, this can be considered as flow of a fluid between two stationary plates (Fig. 18). Using this approximation, we calculated a number of profiles of material deformed in this system. Results of this model show that the expected shape of the lobes is a strong function of the power law exponent n. For linear viscous materials the shape is parabolic, and for increasing values of n the deformation is more and more concentrated at the layer's boundaries.
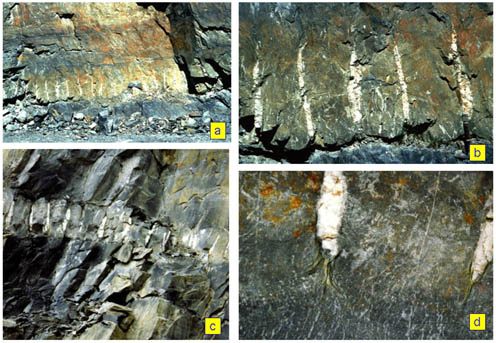
The profiles calculated can be compared with the shape of the mullions in profile. The exact shape of these can be determined accurately, but was not yet studied extensively so far. As an example one can compare Figure 18 with Figure 7. This comparison suggests that, as first estimate, the value of the stress exponent n in these rocks is between 2 and 5. We note that much more work is needed here, using non-linear finite element techniques. Such a study will also require careful calibration of the models against volume change due to pressure solution, the strain in the intra-mullion veins, and require removal of later deformation. Obviously this is not a simple process. On the other hand our understanding of the in-situ rheology of psammites under very low-grade metamorphic conditions is very limited and additional information from naturally deformed rocks would be quite valuable.
An interesting consequence of the model is that wider initial vein spacing results in faster deformation in the corresponding sandstone segment. In other words, this effect will tend to make the spacing between mullions more regular. This prediction can be tested in the field, using observations in multiple mullions.
(a)
(b)
Figure 18. Mullions calculated based on the model for flow between parallel plates
(a) Profile of mullions calculated based on the model for flow between parallel plates, showing the effect of power law stress exponent n on the expected shape of the mullions.
(b) Click for movie Cinema 4D model illustrating the effect shown in (a) for three different mullions evolving in materials having n= 1,3 and 5 respectively. The kinematics of the model are based on the velocity profile of a power law fluid flowing between parallel plates, and a shortening rate chosen such that volume is approximately constant.