Determination of active faults: Seismic potential and seismic hazard assessment
Using the fault information previously presented, as well as the currently accepted criteria, also adopted by the Greek Earthquake Planning and Protection Organization, the previously described faults were distinguished as active, possible active and geological (not active) (fig. 5, 7; for explanation see the detailed description of each fault zone 1-13). Following this separation, their seismic potential was assessed for the active and possible active faults, on the basis of the relation logL = 0.51*M-1.85 (Papazachos, 1989), relating the moment magnitude, M, of the maximum expected earthquake with the total length, L, of the fault. Following this approach, the following categorization was performed:
Active faults
- The fault of Western Crete, with a total length of 65km and a maximum expected earthquake magnitude M = 7.2. However, the fault is displaying a clear spatial segmentation, which most probably suggests its segmented activation with typical events of M = 5.6 to 5.7 according to the partly length of the segments. The fault is characterized as active by both neotectonic and seismological criteria.
- The fault of Malathyros - Rodopos, which is characterized active on the basis of geological and seismological criteria. Its total length of ~30km, corresponds to a maximum expected earthquake of M = 6.5. On the other hand, according to its spatial segmentation, a M = 5.5 event is the possible magnitude expected for its southern segment, while a M = 6.1 earthquake should be considered for the northern one.
- The fault of Kera - Karthiana, characterized as active by geological and seismological criteria, with a maximum magnitude M = 5.0.
- The fault of Platanos, considered as active on the basis of geological criteria. Total length ~10km corresponds to a maximum magnitude M = 5.6, with its sub-segments resulting of M = 5.2 and 4.8.
- The fault of Zacharias - Pomonia, described as active using geological criteria, with a total length of ~11km, resulting in a maximum magnitude of M = 5.7.
- The fault of Marathi, determined as active on the basis of geological criteria, with a total length ~12km and a maximum magnitude M = 5.7.
Possibly active faults
- The fault of Xiropotamos - Elos - Myloi, which is described as possibly active, mainly considering the available seismological data and geometric criteria. The expected earthquake magnitudes for its two separate segments are M = 5.1 and 5.5, respectively.
- The fault of Malaxa - Souda, characterized as possibly active mainly using geometric, kinematic and morphotectonic criteria. Its total length of ~22km corresponds to a, maximum magnitude of M = 6.2, though no historical information on similar magnitude strong earthquakes exist for this fault.
- The fault of Drepanokefala - Georgioupoli, determined as possibly active on the basis of geological and morphotectonic criteria. It has a total length of ~12.5km, corresponding to a maximum magnitude of M = 5.8.
The previous information was used in order to perform a quantitative assessment of seismic hazard for the broader W.Crete study area. For this reason we considered the previously described active and possibly active faults, as well as the general seismotectonic setting of the broader area, depicted in Fig. (10). As a first step, we used all the available historical and instrumental seismicity information for the broader western Crete area, in order to assign appropriate quantitative seismicity measures to the previously described active faults, as well as to major faults of the broader area (e.g. Elafonissos fault, fig. 1) affecting the study area.
For the historical seismicity information we mostly relied on the catalogue of Papazachos and Papazachou (2003), whereas instrumental seismicity information was based on the catalogue of the Geoph. Lab. of the Aristotle Univ. of Thessaloniki (http://seismology.geo.auth.gr/ss/CATALOGS/seiscat.dat) which reports original or converted (equivalent) moment magnitudes for all events up to 2009. Figures (27a) and (27b) present the distribution of the corresponding shallow (h < 60km) and intermediate-depth (h > 60km) earthquakes for the broader study area. These maps show that the northern part of Crete island exhibits relatively low and smaller magnitude seismicity levels, whereas larger magnitude events (Μ ≥ 6.0) are observed mainly along the outer Hellenic arc, clearly related with the convergence of the Eastern Mediterranean with the Aegean plate. An exception is the Western Crete fault area, that shows relatively higher seismicity levels that the remaining western Crete mainland. On the other hand, the intermediate-depth events are distributed along a well-defined Benioff zone with amphitheatrical shape (see also fig. 1), dipping towards the Aegean sea area (Papazachos and Comninakis, 1971).
Figure 27. Spatial distribution
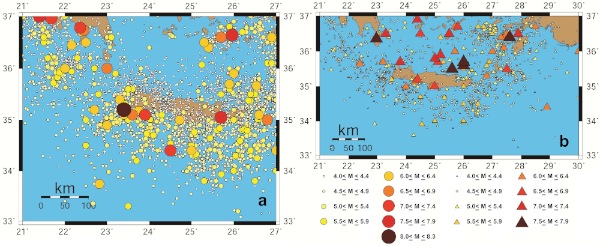
Spatial distribution of the (a) shallow (h < 60km) and, (b) intermediate-depth (h > 60km) earthquakes for the broader Western Crete area used in the present work.
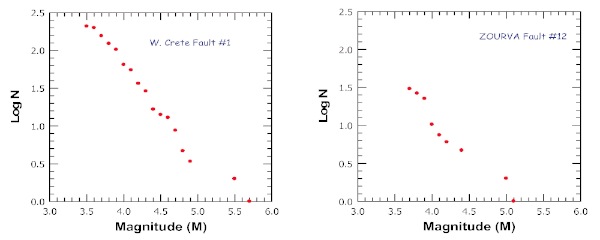
The available seismological information was used to determine the catalogue completeness from the Gutenberg-Richter curve and plots of the cumulative number of earthquakes versus time for several minimum magnitudes. The finally determined completeness for the western Crete area was defined as: 1981-2002 Μ ≥ 3.5; 1964-2002 Μ ≥ 4.0; 1950-2002 M ≥ 4.5. Using this completeness and the available neotectonic and seismological information, we estimated appropriate seismicity parameters using elliptical areas around each of the 13 previously examined faults. Typical Gutenberg-Richter distributions for Western Crete and Zourva faults are presented in fig. (28). Furthermore, besides the mostly normal neotectonic faults studied here, we also considered the major thrust faults in the NE-SW compression area (orange region in Fig. 10), where large magnitude events are observed. The most typical example, which strongly influences the seismic hazard assessment in the broader western Crete area, is the major Elafonisos fault that generated the 365BC M = 8.3 event (e.g. Papazachos, 1990), depicted in Fig.1. Using the same seismicity catalogue and completeness, we also estimated the corresponding seismicity parameters for this fault. It should be noted that for all other areas outside the examined western Crete neotectonic faults and the Elafonisos thrust fault, as well as for intermediate-depth events (h > 60km) we adopted the seismicity parameters of the zonation model proposed by Papaioannou and Papazachos (2000).
Figure 28. Gutenberg-Richter frequency-magnitude distributions for the Western Crete (left) and Zourva (right) faults
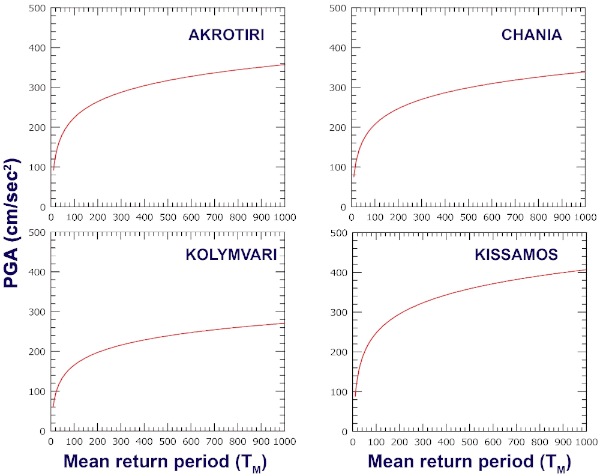
In order to perform the final seismic hazard estimations we employed the PGA attenuation relation of Margaris et al., (2001) for shallow earthquakes and the relations of Theodulidis and Papazachos (1990) for intermediate-depth events, which have been defined for the broader Aegean area. Seismic hazard estimations were performed using the Frisk88M (1995) code, appropriately modified in order to account for the different attenuation relations between shallow and intermediate-depth events, as well as anisotropic radiation of seismic energy at the source (Margaris, 1994). Moreover, pseudo-velocity response spectra PSV(T) (in cm/sec) were also computed using the relations of Theodulidis and Papazachos (1994).
Estimations were performed for 11 selected major sites, corresponding to the centers of the former Kapodistrian municipalities, presented with squares in fig. 13. Seismic hazard results were estimated for a 10% probability exceedence in 50 yr or equivalently for a return period of 476 yr. Typical results are presented in fig. 29, for 4 selected sites (Akrotiri-1, Chania-2, Kolymvari-4, Kissamos-3, numbering follows the sequence numbers presented in fig. 26). The sites have been selected in order to observe the gradual variation of the obtained seismic hazard results, as we move from the eastern (lower seismicity) to the westernmost (higher seismicity) part of the examined area. The presented results clearly show higher seismic hazard levels for the Kissamos site, as it is affected by the presence and related seismicity of the major neighboring Western Crete fault. On the other hand, the Kolymvari site exhibits quite low seismic hazard levels, despite being close to the neighboring active faults (Malathyro-Rodopos and Kera-Karthiana faults, numbered 2 and 3 in fig. 26). The results exhibit an important spatial variability of seismic hazard, despite the small spatial extent of the study area, suggesting that the identified active faults have an important effect on the seismic hazard assessment.
Figure 29. Seismic hazard curves for the former municipalities of Akrotiri, Chania, Kolymvari and Kissamos
In order to further explore this issue and propose appropriate design spectra, we followed a specific approach in order to quantify the effect of the seismotectonic model on the seismic hazard assessment. For this reason appropriate deaggregation of the seismic hazard results was performed for each examined site and all seismic sources (e.g. neotectonic faults, Elafonissos thrust fault, intermediate-depth event zones, etc.) affecting this site. The corresponding earthquake scenario were considered as design earthquakes and used in a stochastic simulation procedure, in order to estimate the contribution of each fault on the seismic hazard of each site.
For the stochastic simulation we employed the methodology of Beresnev and Atkinson (1997), which extends the original method of Boore (1983) by considering the finite seismic source dimensions. This modification is especially important for the near source strong motion effects and has been widely employed for several seismotectonic environments. The method assumes a planar fault surface, divided into smaller segments, where each segment can be considered as an independent Brune point source. The seismic rupture propagates from a starting nucleation point using a constant rupture velocity and the final seismic wavefield is computed by the summation of the contribution of each segment by incorporating appropriate geometrical and anelastic attenuation, as well as empirical site-effects (Beresnev and Atkinson, 1997, 1998, 1999, 2001a,b).
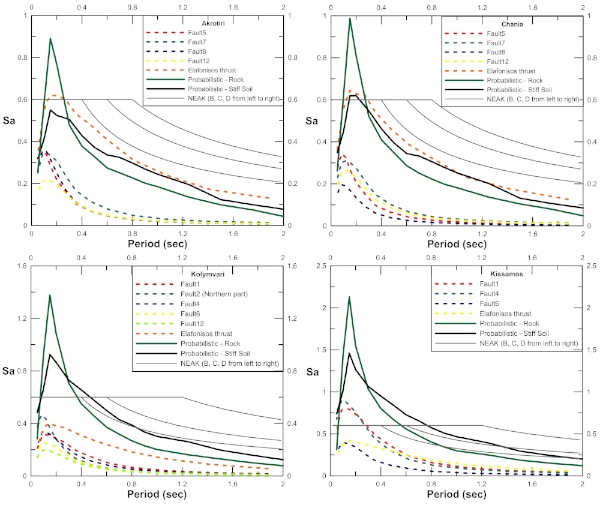
Using the stochastic simulation approach for the design events, as their magnitude was determined from the deaggregation analysis and their fault plane characteristics from the neotectonic and fault plane solution information, average elastic response spectra (for 5% damping and amplification factor of β0 = 2.5) were computed using a large number of simulations (typically 30) for each site. Sample results are presented in fig. 30 for the same sites as in fig. 29. Moreover, the probabilistic elastic response spectra as determined from the initial seismic hazard analysis for two site conditions (rock and stiff soil), as well as the Greek Seismic Code (NEAK) elastic design spectra are also presented for all sites. It should be noted that: a) The NEAK spectra are identical for all sites, as they belong to the same seismic hazard zone (elastic spectra acceleration of 0.6g), b) Since almost all examined sites are located on relatively stiff Neogene sediment deposits, the stiff soil probabilistic spectra should be considered as more appropriate for the examined sites and, c) The stochastic simulation elastic spectra correspond to the scenarios determined from the de-aggregation process and not to worst-case scenarios for each examined fault.
Figure 30. Comparison of stochastic simulation elastic response spectra
Comparison of stochastic simulation elastic response spectra from the deaggregation analysis with the corresponding probabilistic elastic spectra from seismic hazard assesment and the Greek Seismic Code (NEAK) elastic response spectra for the former municipalities of Akrotiri, Chania, Kolymvari and Kissamos (see fig. 5 for locations).
The results further confirm the strong spatial variability of the seismic hazard in the western Crete area. On the other hand, the presented results show two different pictures for the examined sites. More specifically, for sites located in the eastern (lower seismicity) part of the study area (Akrotiri, Chania) the NEAK (Greek Seismic Code) elastic response spectra cover the probabilistic estimates from the hazard analysis. Moreover, the main contribution in seismic hazard is due to the Elafonisos thrust fault, which is almost identical to the probabilistic estimate. This observation suggests that the contribution of the active but low-seismicity neighboring neotectonic faults (faults 5, 7, 8, etc.) is minimal and that the main source of seismic hazard for these sites is the large thrust events that originate from the outer Hellenic arc convergence zone (fig. 1).
A quite different situation holds for sites located in the western part of the study area. More specifically, compared to the Seismic Code design spectra, the probabilistic elastic spectra estimated in this study are slightly larger (up to 0.9g) at higher frequencies (2-10Hz) for Kolymvari and much larger (up to 1.45g) for a much larger frequency range (1.2-20Hz) for the Kissamos site, suggesting that the Seismic Code spectra probably need adapting, especially for the Kissamos site. Even more important is the pattern change regarding the seismic hazard source contributions: For the Kolymvari site the contribution of the Elafonisos thrust fault is comparable to the contribution of the neighboring active normal faults, mainly the Malathyros-Rodopos fault (fault 2), especially for higher frequencies (lower periods). This pattern is even more enhanced for the Kissamos site, where the neighboring fault group (Western Crete-fault 1 and Platanos-fault 4), which exhibits higher seismicity levels, control the seismic hazard, while the Hellenic arc thrust fault contribution is significantly smaller. This result further verifies the importance for the detailed neotectonic mapping for seismic hazard assessment, especially at the local scale level performed in the present work.