Geochemical Characteristics
Major elements
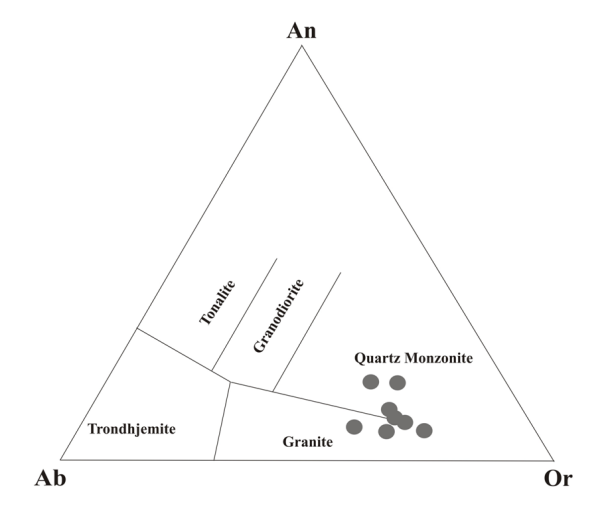
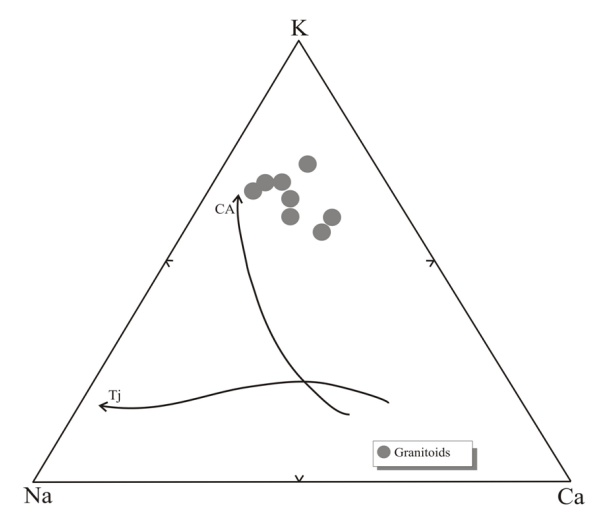
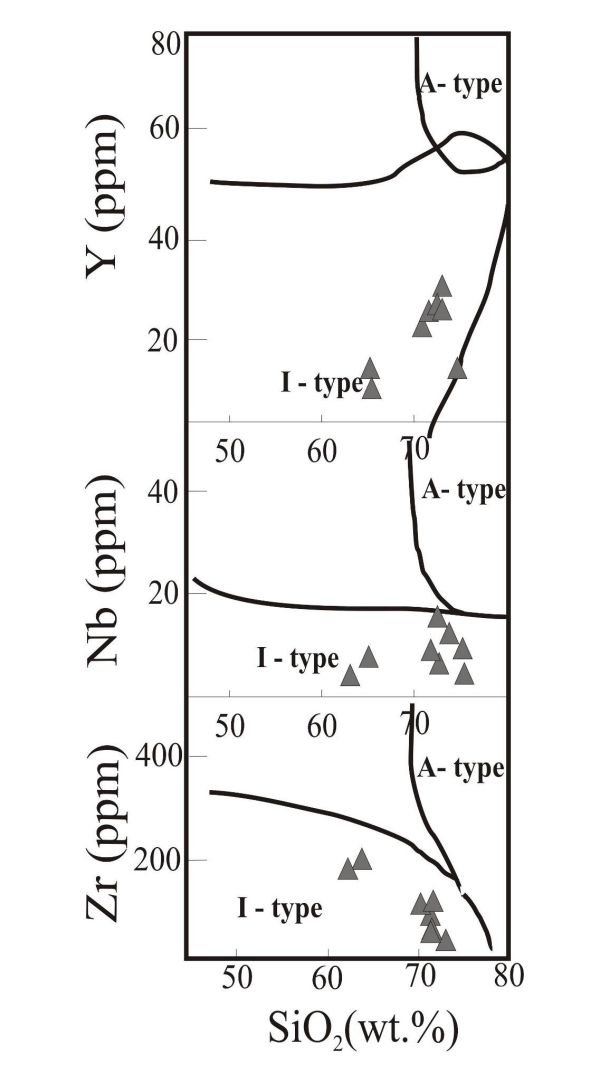
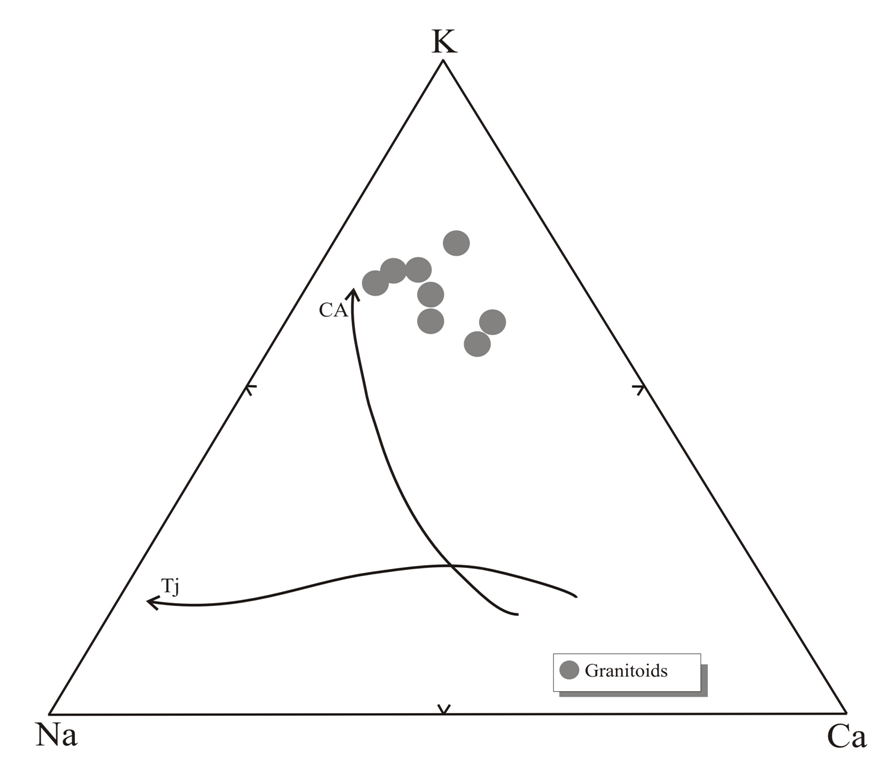
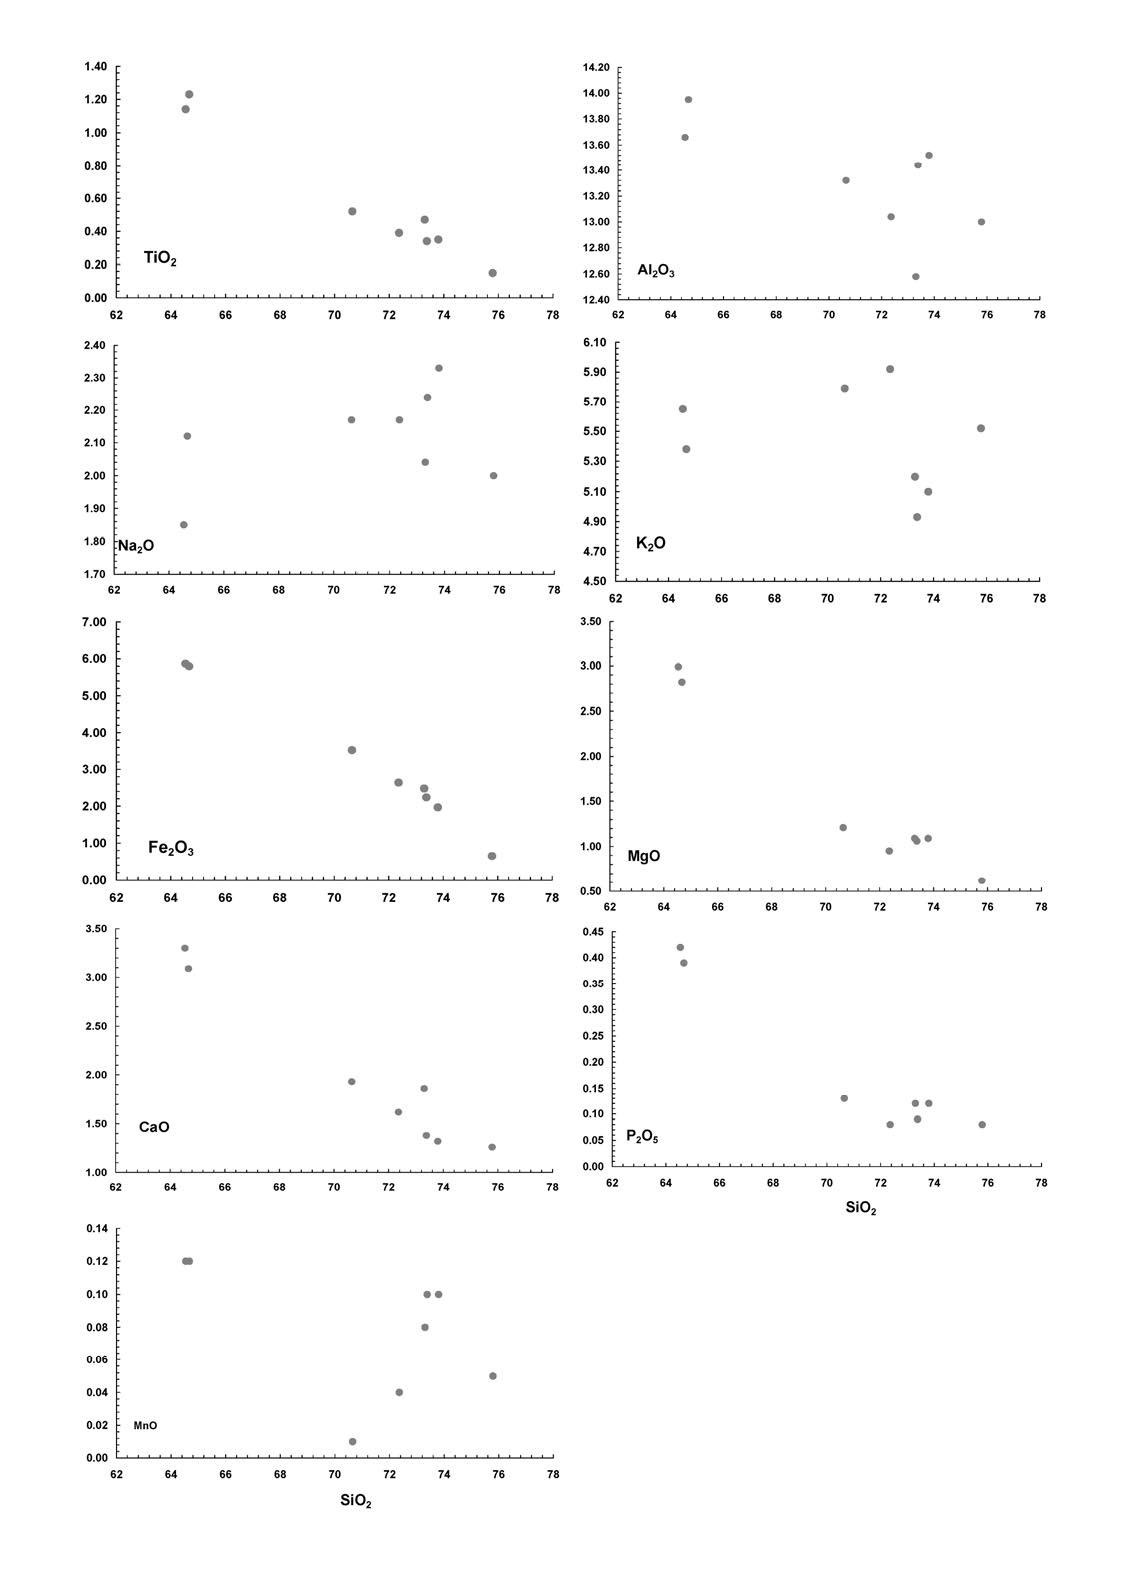
Two samples AG-8 and AG-10 have SiO2 values 64.54 wt.% and 64.67 wt.% respectively; while the rest of the samples have SiO2 values clustered between 70.65 wt.% and 75.79 wt.%. AG-8 and AG-10 contain relatively high Fe2O3* (5.87 wt.% and 5.8 wt.%), MgO (2.99 wt.% and 2.82 wt.%) and CaO (3.3 wt.% and 3.09 wt.%), while all the other samples have Fe2O3* range from 0.65 wt.% to 3.53 wt.%; MgO range from 0.62 wt.% to 1.21 wt.% and CaO range from 1.26 wt.% t 1.93 wt.%. The Al2O3, Na2O and K2O contents of all the granitoids are more or less similar. Al2O3 of the granitoids range from 12.58 wt.% to 13.95 wt.%. MHM granitoids are highly potassic; the K2O contents of all the samples range between 4.93 wt.% to 5.92 wt.%. The granitoids contain relatively lesser Na2O and it varies between 2.00 wt.% to 2.33 wt.%. The molar alumina saturation index Al2O3/(CaO + Na2O + K2O) values for the granitoids range from 0.9 to 1.2. Thus the granitoids are peraluminous. In the CIPW ternary normative classification diagram using the abundance of albite, anorthite and orthoclase the granitoids plot within the granite and quartz monzogranite fields (Fig. 4). On the K2O–SiO2 plot all the samples show both calc-alkaline and shosonitic affinity, while AG-8 and AG-10 show distinct shosonitic affinity suggesting chemical heterogeneity in the source (Fig. 5). The granitoids of Mikir Hills massif plot on the top right side of the CA reference curve in the K-Na-Ca diagram (Fig. 6). All the samples of the granitoids plot towards the potassic side of the reference curve CA (Fig. 6) and show I-type geochemical characteristics in the SiO2 vs. Y, Zr, Nb diagram (Fig. 7). All the major elements of the granitoids are plotted against SiO2 on the Harker’s diagramand they exhibit overall negative trends against SiO2 except for K2O, which shows positive trend (Fig. 8a).

Figure 5. K2O vs. SiO2 plot for the Mikir Hills massif granitoids.
Subdivisions of igneous suites are based on K2O contents (fields are after Peccerillo and Taylor, 1976).
Figure 8a. Major elements.

Harker's variation diagram for major elements of the granitoids of Mikir Hills Massif.
Trace elements
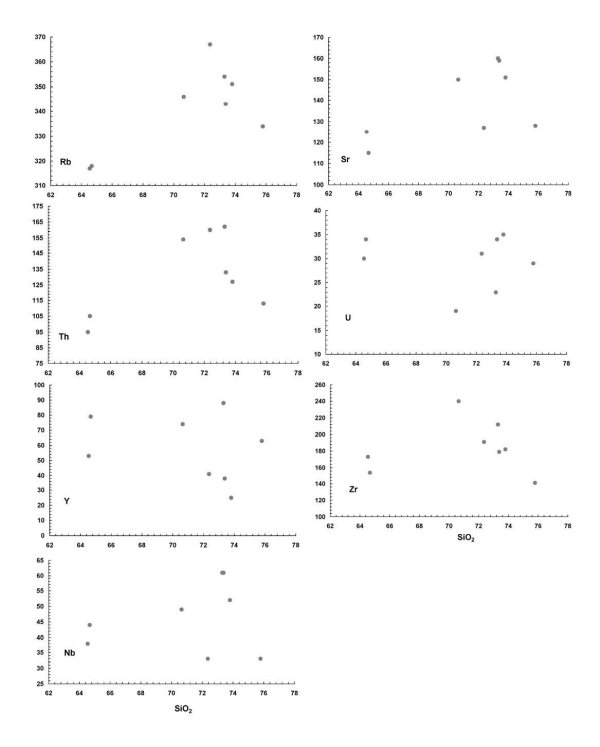
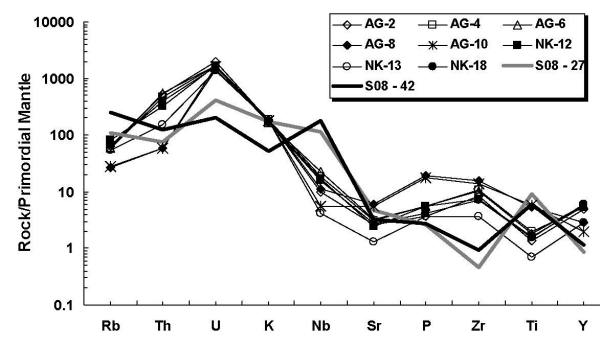
Harker’s diagram for all the trace elements of the granitoids defines negative trends except U, which shows positive trend (Fig. 8b). The elemental patterns in the primitive mantle normalized multi-elemental spidergram for the granitoids (Fig. 9) show overall enrichment characteristics with respect to the primitive mantle (PM). The spidergram shows fractionated patterns with Large Ion Lithophile Elements (LILE) such as Rb, Th, U and K of the granitoids 10 – 100 folds enriched compared to High Field Strength Elements (HFSE) (Fig. 9). Negative anomalies are observed at Sr and Ti which may indicate retention of these elements by the refractory phases such as apatite, rutile and ilmanite at the site of partial melting and/or fractional crystallization. In contrast, the spidergram (Fig. 9) in respect of the granulites shows marginal enrichment of Rb, positive anomaly at Nb and Ti and negative anomaly at Zr relative to the granitoids.
Figure 8b. Trace elements.
Harker's variation diagram for trace elements of the granitoids of Mikir Hills Massif.
Figure 9. Primordial mantle normalized multi-element patterns for the granitoids of Mikir Hills massif of Shillong plateau.
Normalizing values are from Sun and McDonough, (1989). Data of 2 basement granulite samples are also shown for comparison.
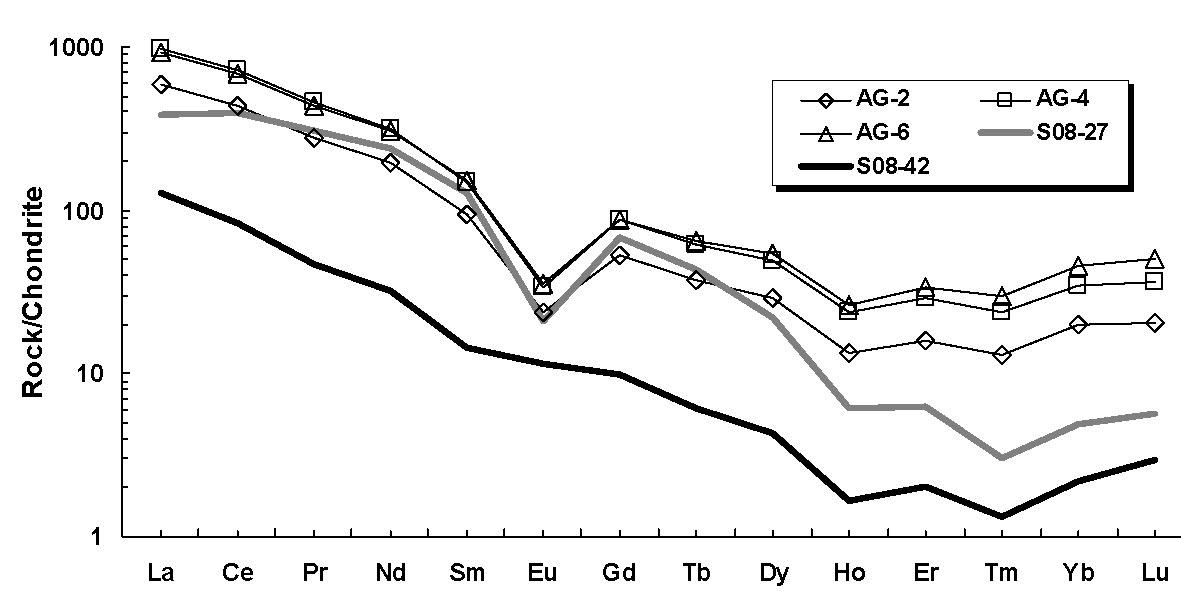
Chondrite-normalized REE patterns for the granitoids are presented in Fig. 10 which show strongly fractionated patterns ((LaN/ YbN = 8–28) and negative Eu anomaly. the REE patterns in respect of the granulite sample No. S08-42 (Fig. 10) shows fractionated trends between LREE and HREE with no negative anomaly and the enrichment level of the elements over the entire spectrum is 30 - 40 folds lesser compared to the granitoids. the other granulite sample (No. S08-27) (Fig. 10) shows strongly fractionated trends between LREE and HREE with negative anomaly and the LREE enrichment level is similar to the granitoids but the HREE is significantly less (20 – 30 folds). The comparative trace and rare earth elemental signatures (Fig. 9, 10) between the basement granulite and the Granitoids therefore do not attest to the link between them via dehydration melting in the granulite and producing a granitic melt and generation of the melts for the granitoids is explicable by partial melting of metasomatized mantle and /or overlying crust and subsequent mingling of both the magma.
Figure 10. Chondrite normalised REE patterns for the granitoids of Mikir Hills massif of Shillong plateau.

Normalizing values are from Sun and McDonough, (1989). Data of two basement granulite samples are also shown for comparison.