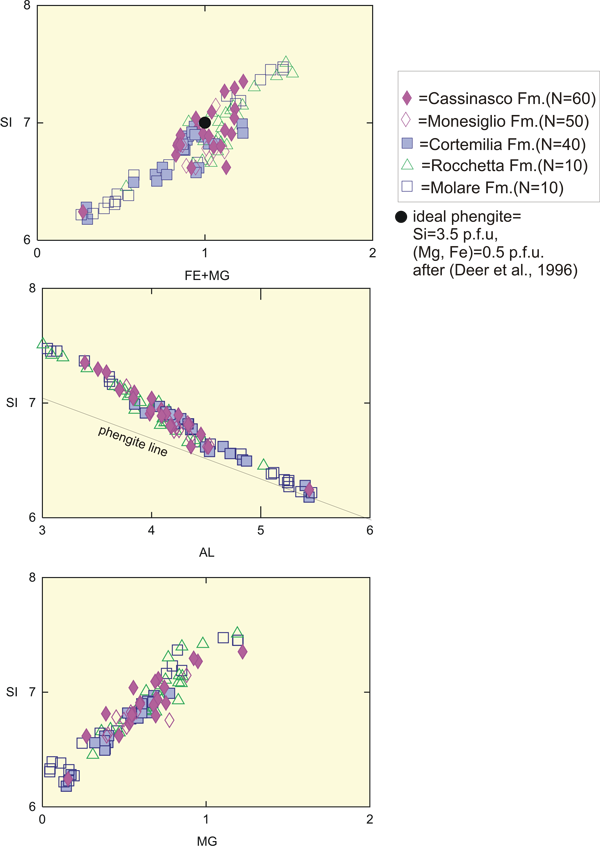
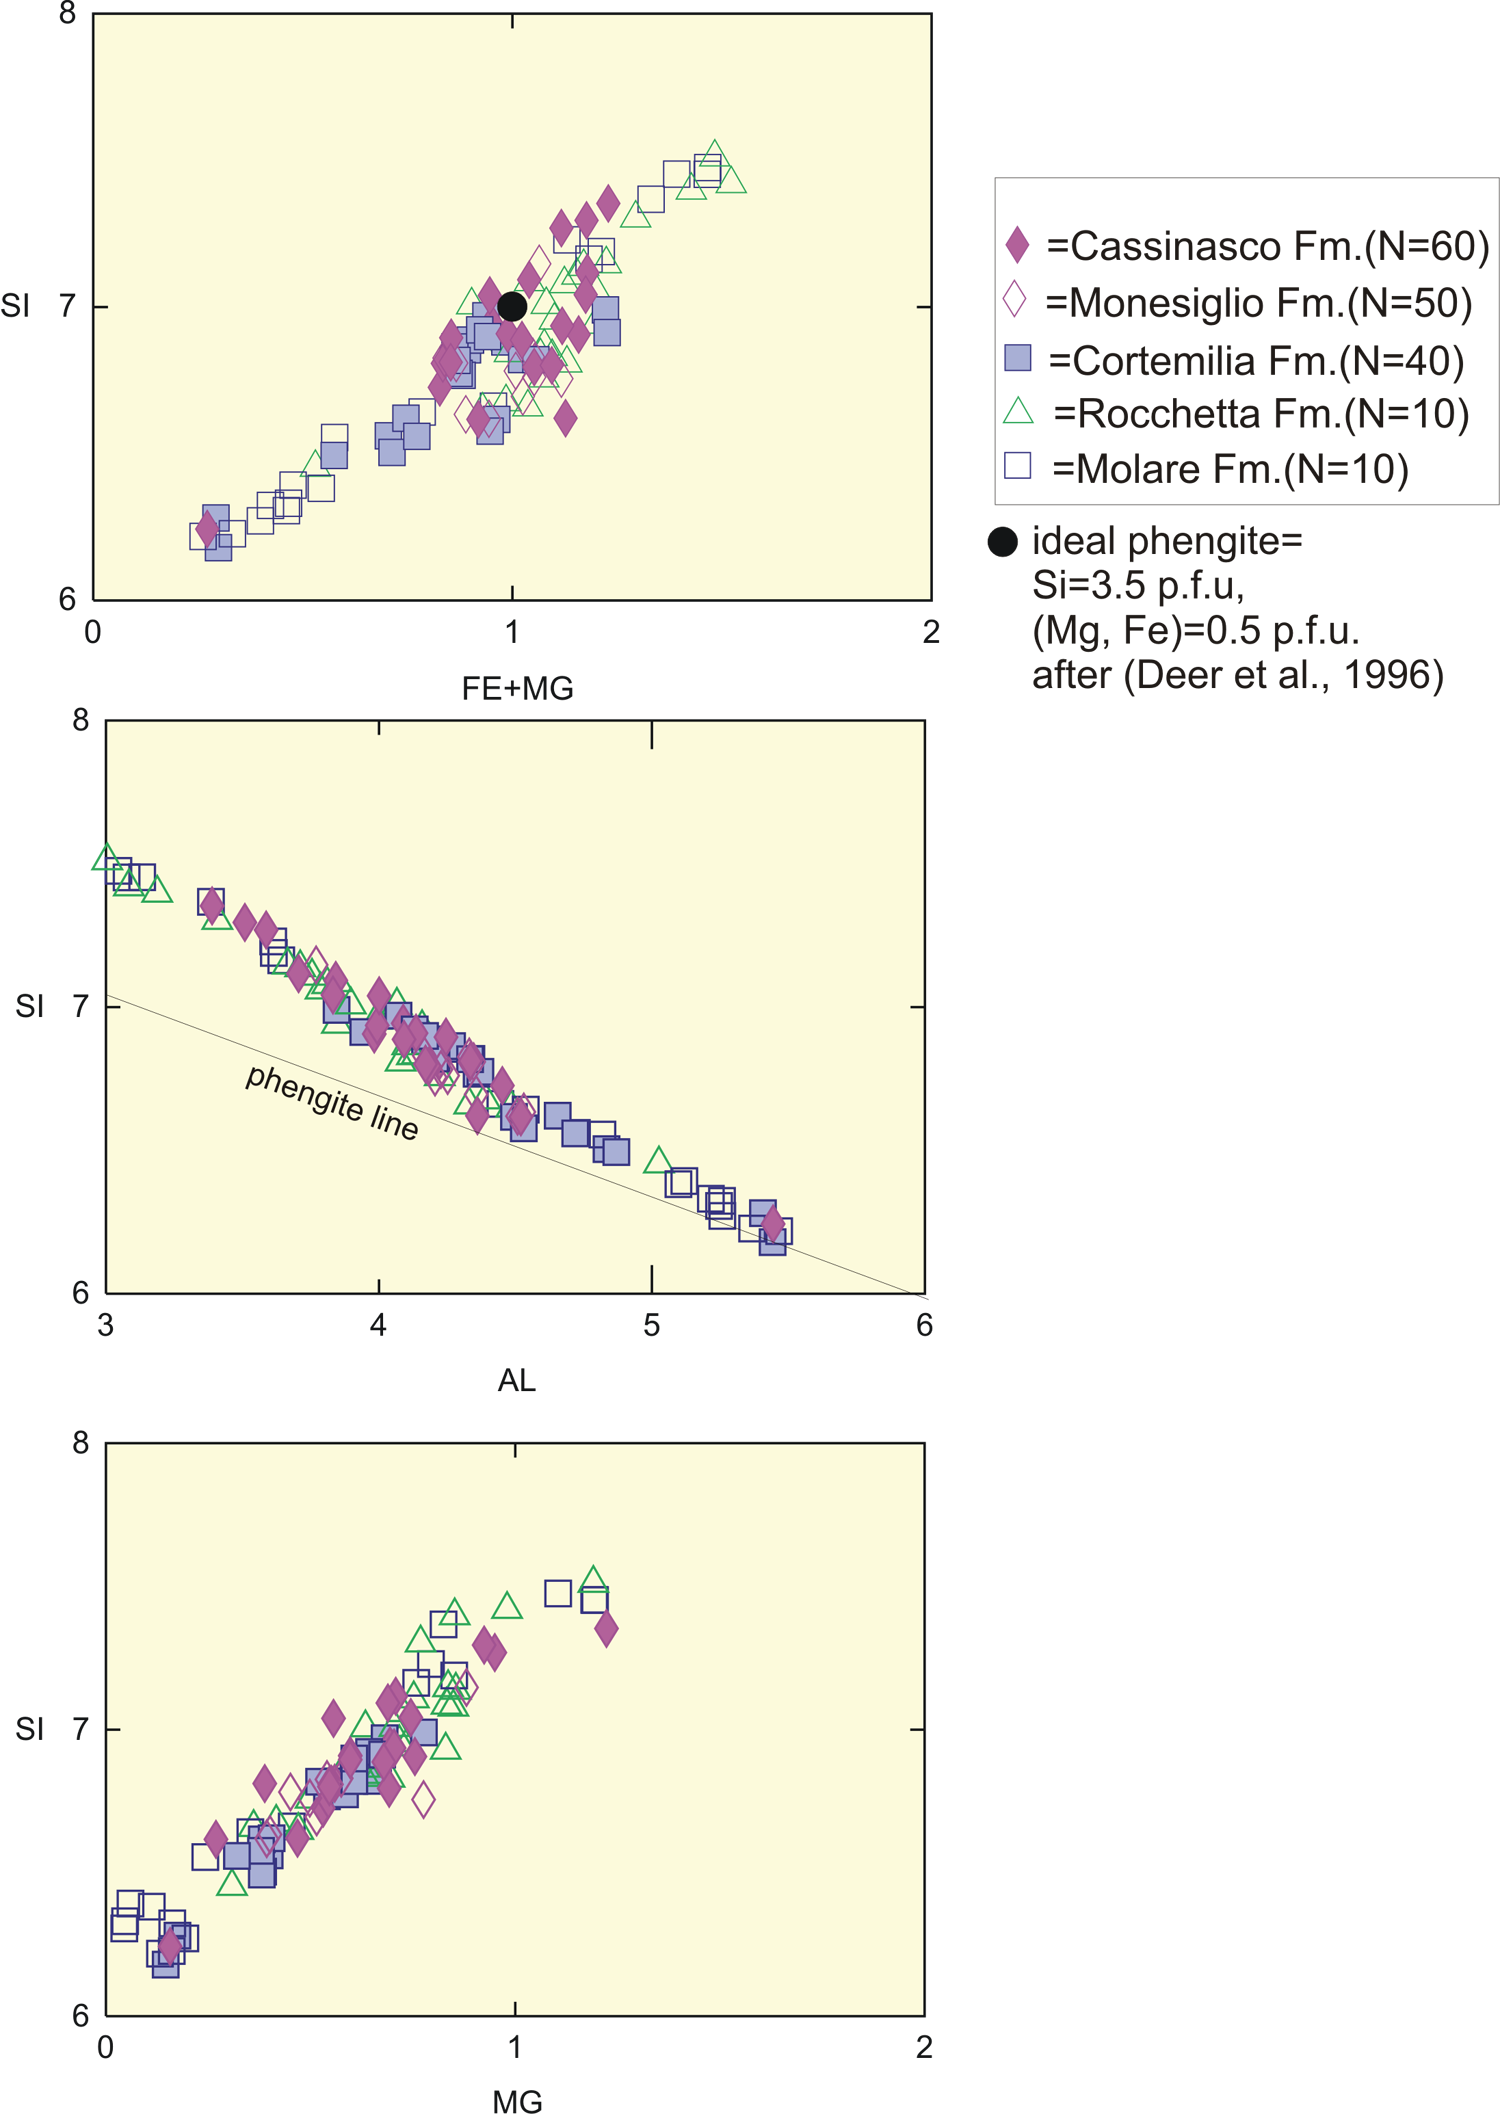
40Ar/39Ar geochronology has been applied to detrital phengites from over 60 samples from selected stratigraphic units of the TPB, ranging from Oligocene to Tortonian in age, and also present-day river sands. The general chemistry of the studied samples is shown in Figure 4 and we refer to Barbieri et al. (2003) for an extended discussion on the chemistry of the Molare Formation. An average of 7 samples were considered for each formation and 2 samples for each river. Single fusion analysis has been applied on ca.10 single crystals (ranging between 250-500 mm size) from each selected sample, for a total of over 500 individual experiments (Figure 5a). Step heating has been applied to 10 single grains ranging between 500-1000 mm in size, derived from different formations and rivers, to check the internal distribution of radiogenic 40Ar in each sample. Only experiments concordant within 95% confidence intervals, i.e. MSWD <2.5 have been used to derive plateau ages. The ages obtained on TPB clastic phengites are interpreted to represent the time of isotopic closure during cooling of the crystalline source through 350-420°C.
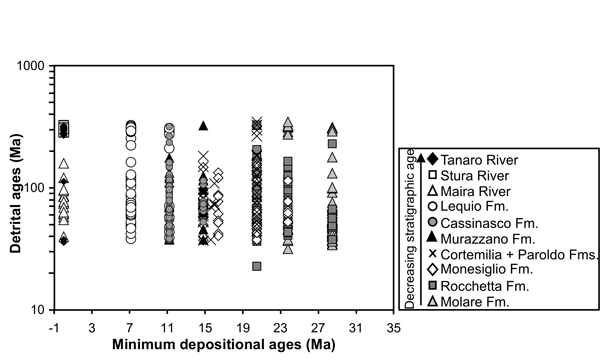
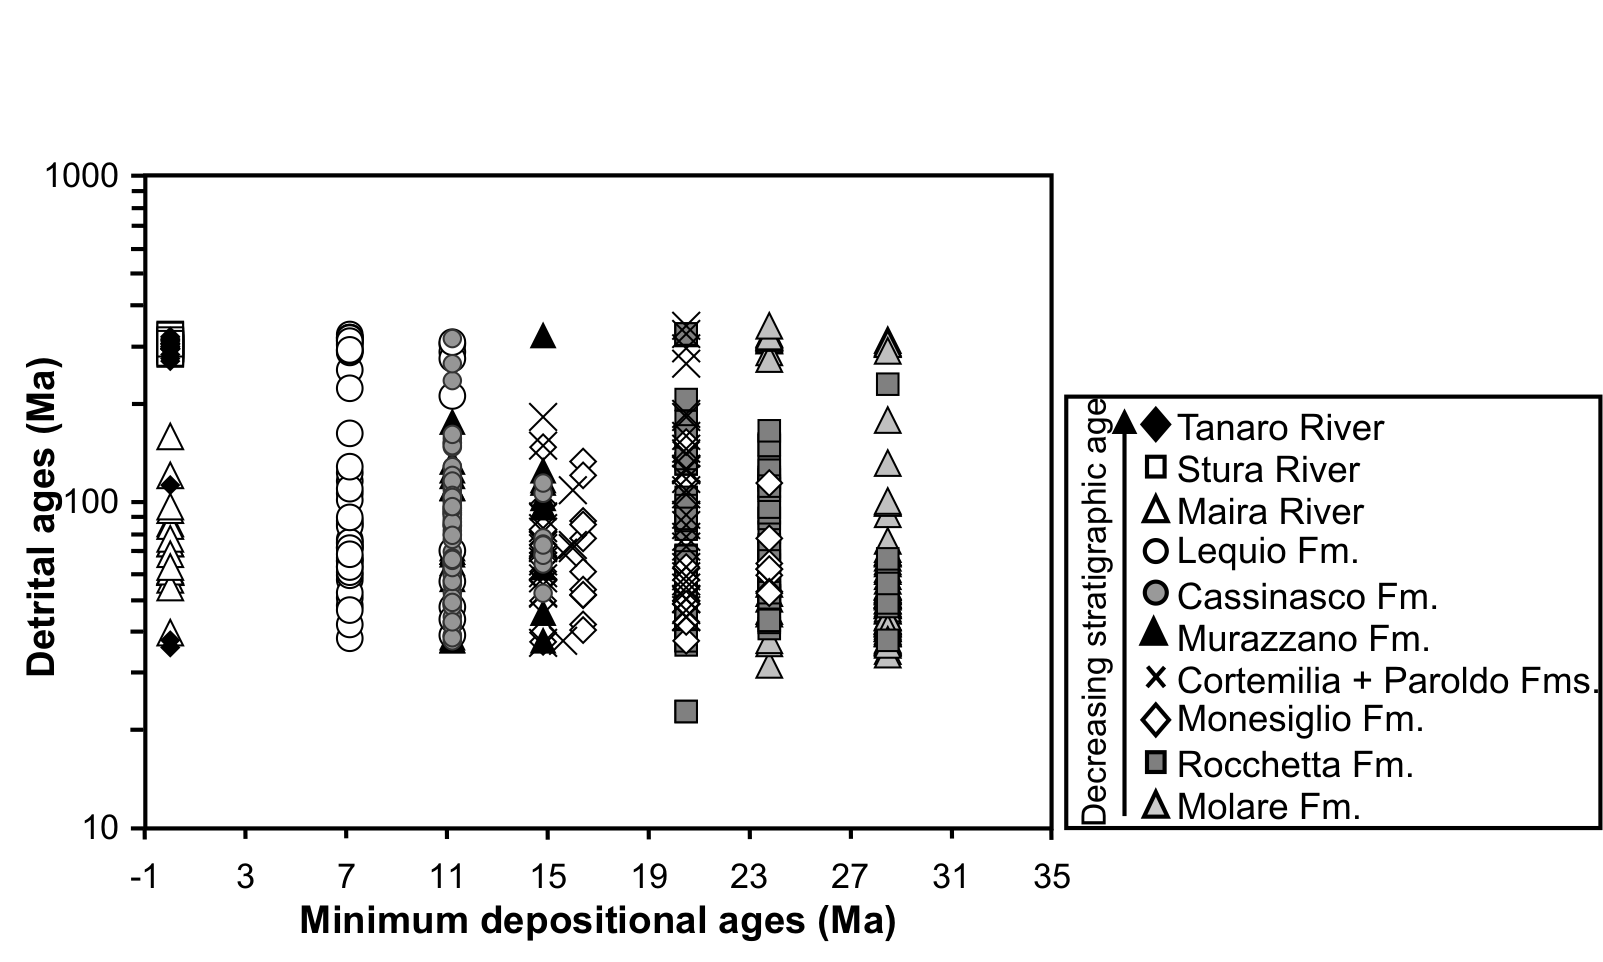
Figure 5a. Detrital-mineral ages
Plot of detrital-mineral 40Ar/39Ar ages vs. minimum stratigraphic ages characteristic of each formation and present-day river sands after Carrapa et al. (2003b).
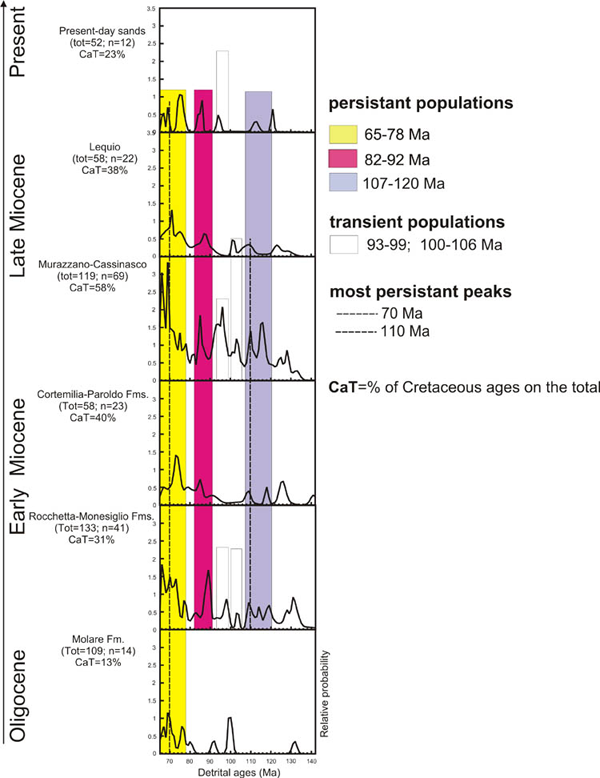
Figure 5b. Probability distribution diagrams of Cretaceous ages
Probability distribution diagrams of Cretaceous ages discussed in this study (see text for explanation). For the whole dataset see Fig. 5a and refer to Carrapa (2002).
The 40Ar/39Ar experiments were carried out with the VULKAAN laserprobe facility at the Isotope Geology Laboratory of the Vrije Universiteit in Amsterdam (Wijbrans et al., 1995). Samples and standards, individually wrapped in Al- and Cu- foils were stacked into quartz tubes. The quartz tubes were irradiated for 7 hrs. in the CLICIT facility of the Oregon State University TRIGA reactor. After irradiation, a J curve was derived by carrying out 5 single fusion experiments on every flux monitor (DRA- 2, age 25.26 Ma, Steenbrink et al., 1999). J factors for individual samples were obtained by interpolation between measured standards. Samples were fused using a 25 W CW argon ion laser, and purified in a low volume extraction line. The isotopic composition of the argon gas was then measured using a double focussing noble gas mass spectrometer (MAP215-50) in static mode.
Probability distribution diagrams (Sircombe, 1999; Sircombe, 2000) have been used to identify the main families of detrital ages present in different formations of the TPB clastic infill and present-day river sands. The probability distribution curves are compiled by summing the distribution of all individual measurements, defined by the age and its error (e.g. Sircombe, 2000). For some formations (e.g. Rocchetta-Cassinelle, Cortemilia-Paroldo, Murazzano-Cassinasco) results have been combined as these formations contain similar sedimentological patterns (similar depositional environment and/or similar petrographic compositions and paleocurrent directions) and are synchronous. The same approach of using most frequently occurring ages in complex populations to discriminate real geological signals has been successfully applied also in case of complex and apparent age spectra produced by mixing (e.g. Forster et al., 2003; Najman et al., 2001; Sambridge and Compston, 1994) demonstrating the potential of the method. Complex patterns of ages in the past often have been discounted as uninterpretable. However, in many geological environments mixtures of signals are produced that can only be understood following detailed analysis of the dataset. Single grain dating techniques represent a key advancement in tackling such complex systems. Additional information can be obtained in favourable cases by incremental heating or multispot fusion of carefully characterised samples (Forster et al., 2003).