Beintema, K.A, Mason, P.R.D, Nelson, D.R, White, S.H. & Wijbrans, J.R. 2003. New constraints on the timing of tectonic events in the Archaean Central Pilbara Craton, Western Australia. Journal of the Virtual Explorer 13.
New constraints on the timing of tectonic events in the Archaean Central Pilbara Craton,Western Australia.
Abstract
The Archaean Pilbara Craton in Western Australia has a domainal architecture which has been interpreted to reflect a history of accretion. The Tabba Tabba Shear Zone is the major division between the East and West Pilbara blocks: this interpretation is based on significant differences in the tectono-thermal histories of the bordering terranes. New laser ablation ICP-MS and SHRIMP U-Pb zircon geochronological data, coupled with trace element data for the same core parts of the sampled mineral grains, indicate a range of magmatic crystallization ages for representative igneous rocks emplaced before, during or after shearing. Results from both dating techniques agree for two separate homogeneous samples to within analytical error (2s). Our data indicate that a granodioritic suite intruded the area at about 3250 Ma, followed by gabbroic suite at 3235 Ma. The area was subsequently affected by an early dextral compressive event during which the Tabba Tabba Shear Zone was formed, and the granodiorites and gabbros were incorporated into the Tabba Tabba Shear Zone. A granitoid suite intruded the shear zone at 2940 Ma, with xenocrystic populations of 3115 Ma and 3015 Ma, a possibly West Pilbara association. The East and West Pilbara terranes may thus have been relatively close to each other between 3250 and 3115 Ma. The Tabba Tabba Shear Zone currently forms the eastern bounding fault of the Mallina Basin. The last major activity in the structure occurred during a major phase of oblique movement, corresponding to closure of the Mallina Basin. Ages of late syn-kinematic granitic intrusions indicate that this occurred at about 2940 Ma.
Introduction
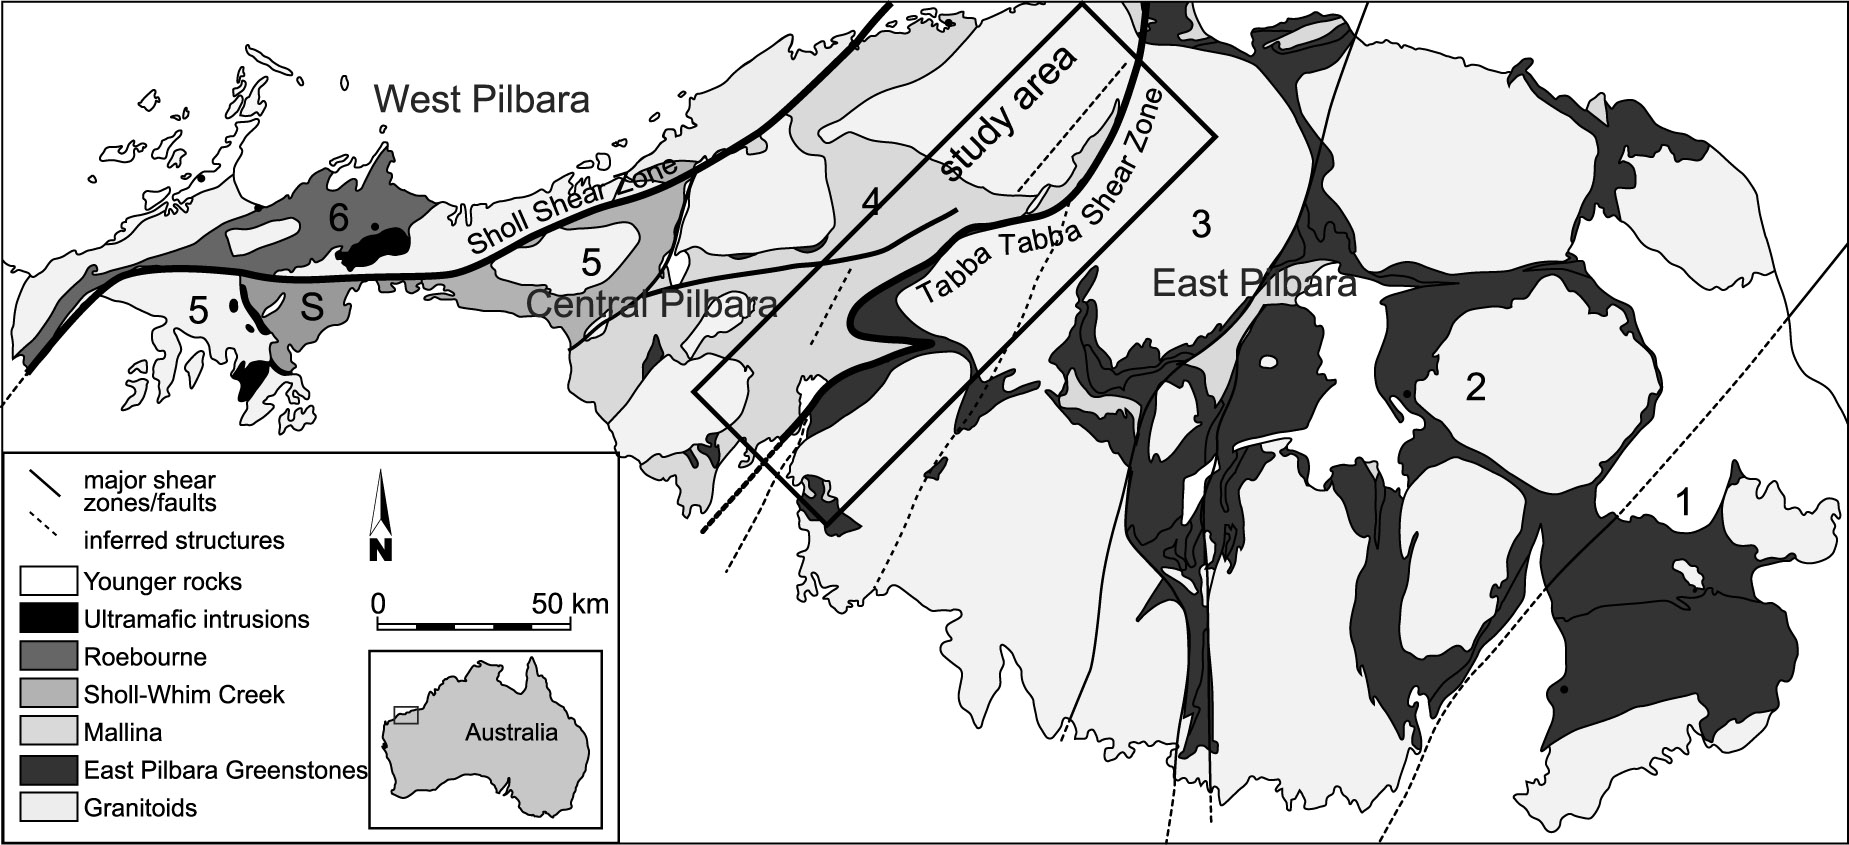
The Pilbara Craton in the north west of Western
Australia (Figure 1)
comprises a mid-Archaean granite-greenstone terrane
and the overlying late-Archaean volcano-sedimentary
sequence of the Hamersley Basin. This study is
concerned only with older tectonic processes during
the construction of the granite-greenstone terrane.
The Tabba Tabba Shear Zone (Figure
2) has historically been interpreted as the
major division between the East and West Pilbara
because of the different tectono-thermal histories
of the bordering terranes. Rocks to the west have
no pre- 3.3 Ga history: the 3.5 Ga Coonterunah
Group (Buick et al., 1995) and 3.47-3.43 Ga Warrawoona
Group (Hickman, 1999) do not occur to the west
of this shear zone, and the 3.45 and 3.3 Ga tectonic
events recorded in the East Pilbara (White et
al., 1998) have not been recognized in the West
Pilbara.
Barley (1997) suggested that the Tabba Tabba Shear Zone is the boundary
along which the West Pilbara Terrane was accreted onto the East Pilbara
Terrane at about 2.9 Ga. This interpretation was adopted by Blewett (2002).
However, our observations (Beintema et al., 2001) suggest that the East
Pilbara granite-greenstone terrane may have been connected with the West
Pilbara granite-greenstone terrane prior to 2.9 Ga.
This study aims to better constrain the timing of tectonic activity in the
Central Pilbara, by dating major magmatic events related to activity on
the shear zone. Laser ablation ICP-MS and SHRIMP U-Pb techniques have been
applied to date rocks taken from key locations, previously identified from
structural-kinematic analyses (Beintema et al., 2001). Regional and structural
relationships based on detailed field mapping in combination with the geochronology
provide time-constraints on the tectonic history.
Geological setting
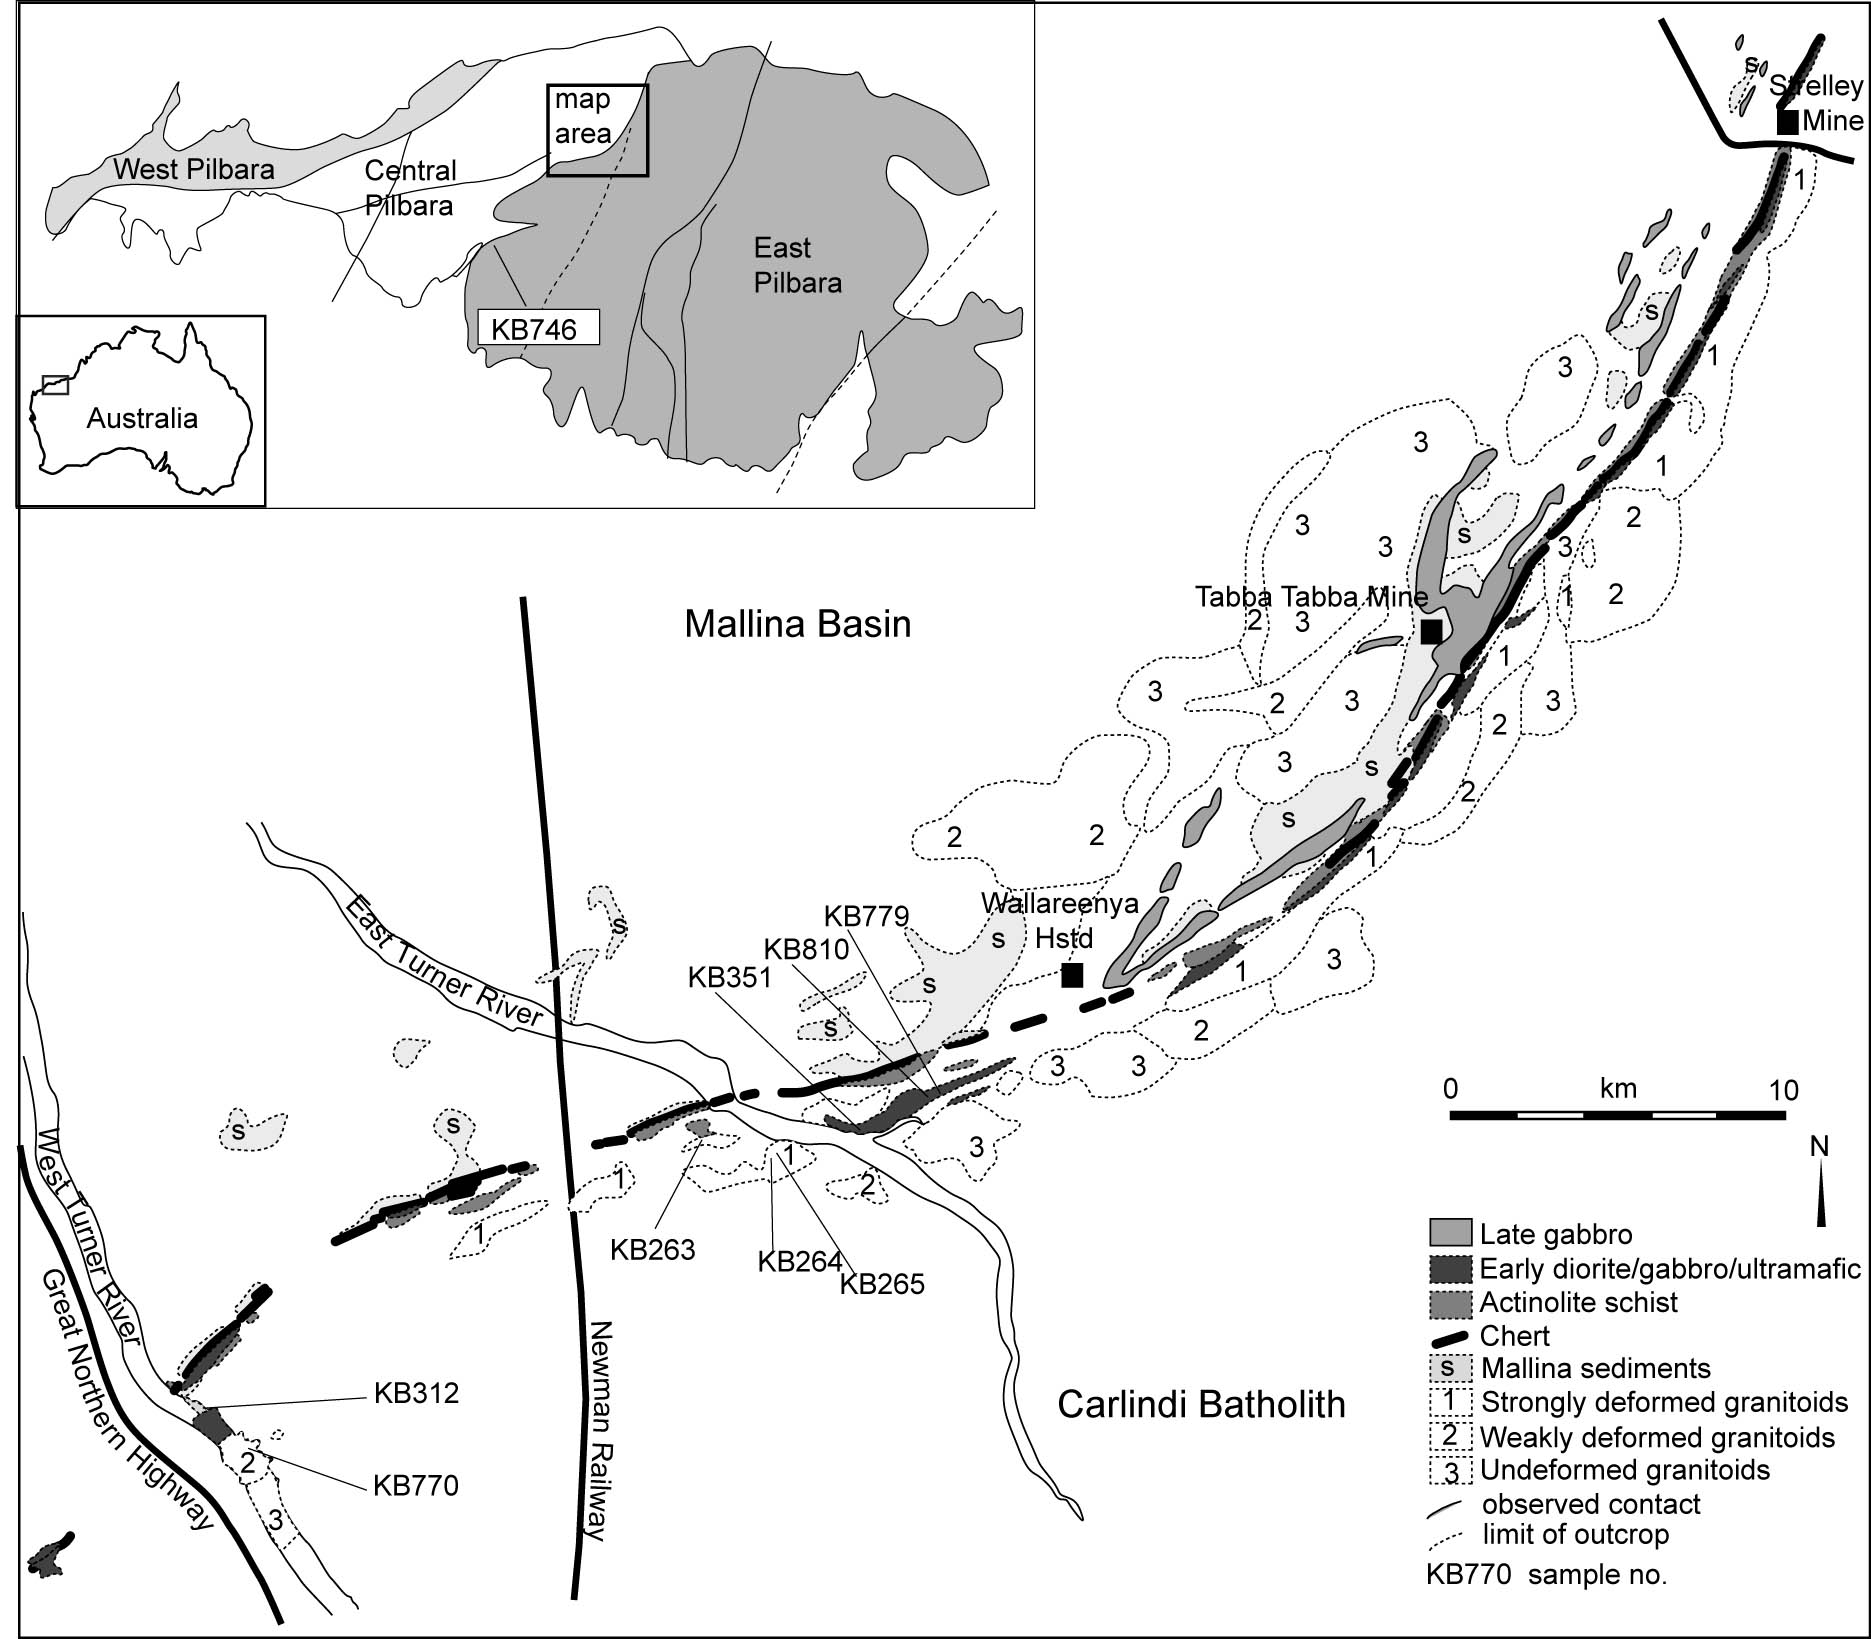
The Tabba Tabba Shear Zone is a major structural and compositional discontinuity
that can be traced from northeast to southwest across the central part of
the Pilbara Craton (Figure 1). The structure has
a maximum width of approximately 2 km (Figure 2)
and separates sedimentary units of very low metamorphic grade (the Mallina
Basin) at its western margin from migmatitic gneisses (Carlindi Granitoid
Complex) at its eastern margin.
Analysis of aerial photographs has revealed a regional foliation rotating
into the Tabba Tabba Shear Zone (Figure 2).
Field data show that the shear zone has experienced an early phase of compressional
deformation with a dextral component (Beintema et al., 2001). The structural
field data also indicate a major phase of sinistral oblique movement, overprinting
most of the pre-existing structures in the shear zone and bringing the southeast
block up relative to the northwest. Minor late brittle dextral deformation
has overprinted the major sinistral phase. This phase may correspond to
closure of the Mallina Basin (Beintema et al., 2001). After deformation
had ceased, the central part of the Pilbara Craton was intruded by large
volumes of post-tectonic monzogranite, between at ca 2930 Ma (Smithies et
al., 2001).
The Tabba Tabba Shear Zone has been intruded by a suite of granodiorites,
a suite of primitive mantle-derived gabbros and a later, more voluminous
suite of gabbros derived from an enriched mantle source (De Leeuw et al.,
2001). This suggests the Tabba Tabba Shear Zone was part of a major crustal
scale structure that enabled melts to rise from the subcontinental lithospheric
mantle.
Sample descriptions
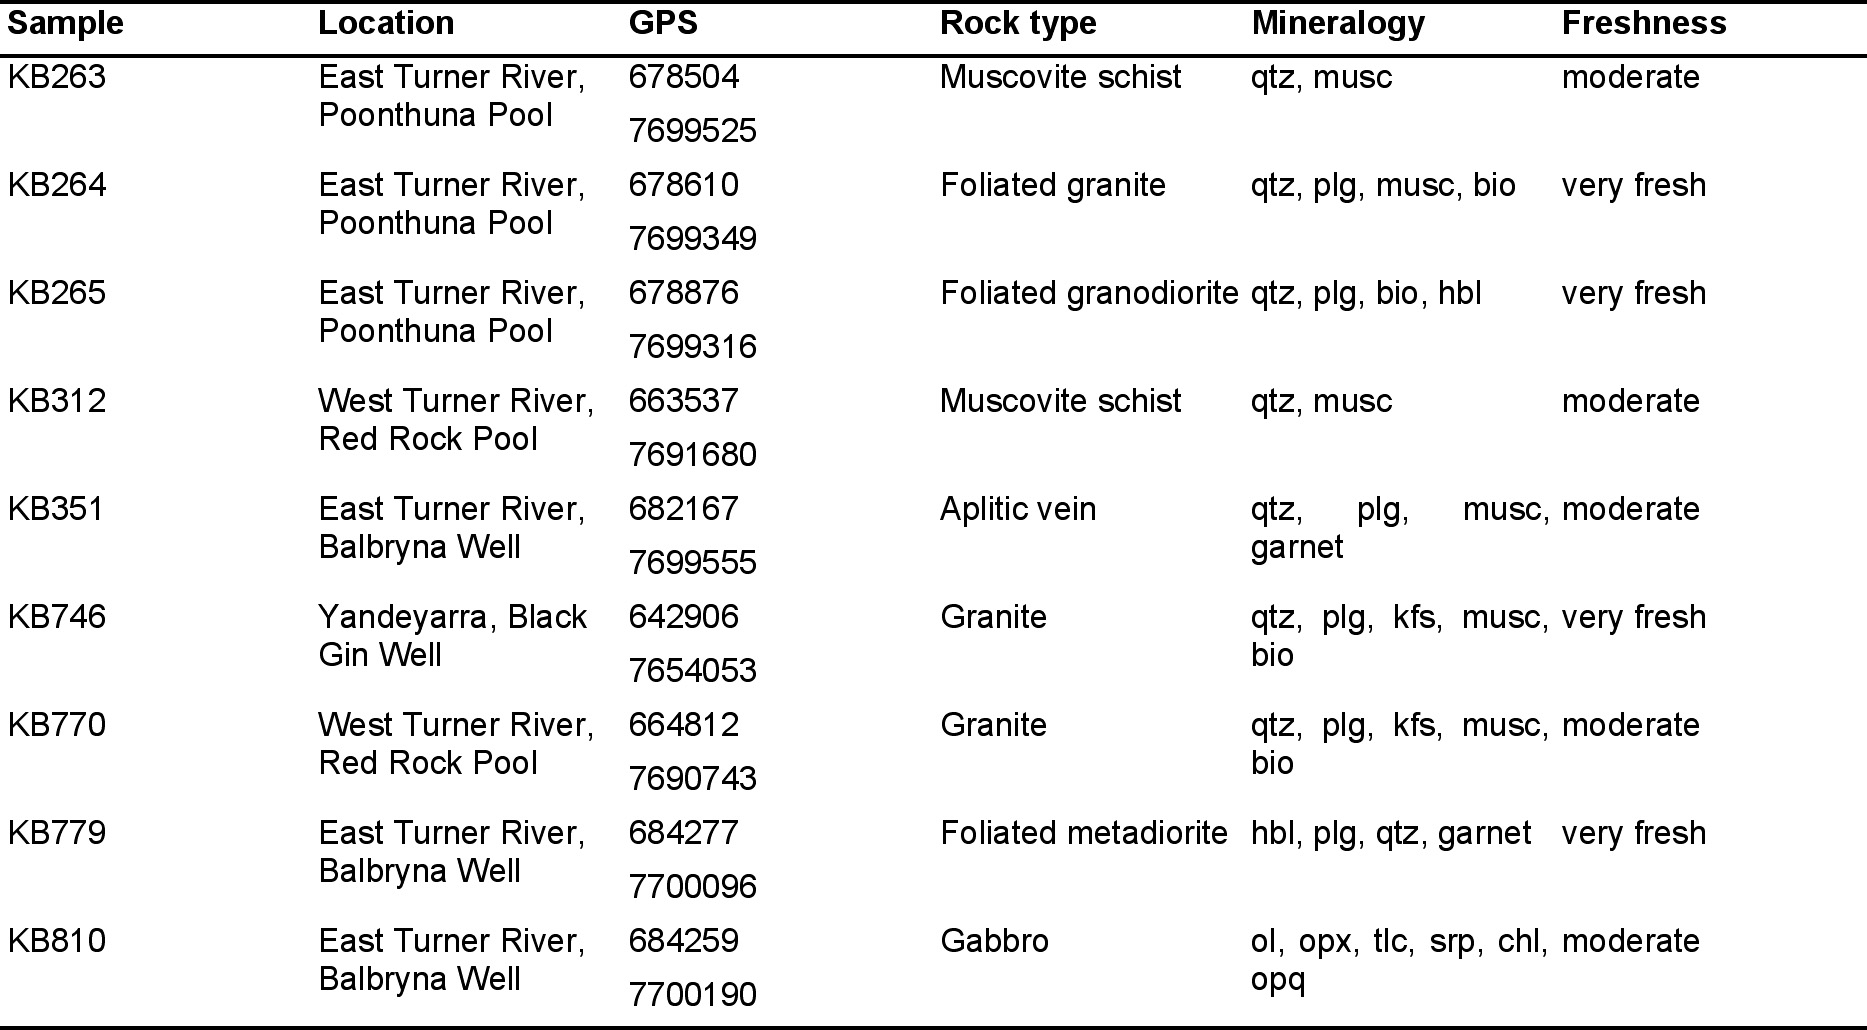
The sampling locations, rock type and mineralogy of the samples are given
in Table 1 and Figure 2.
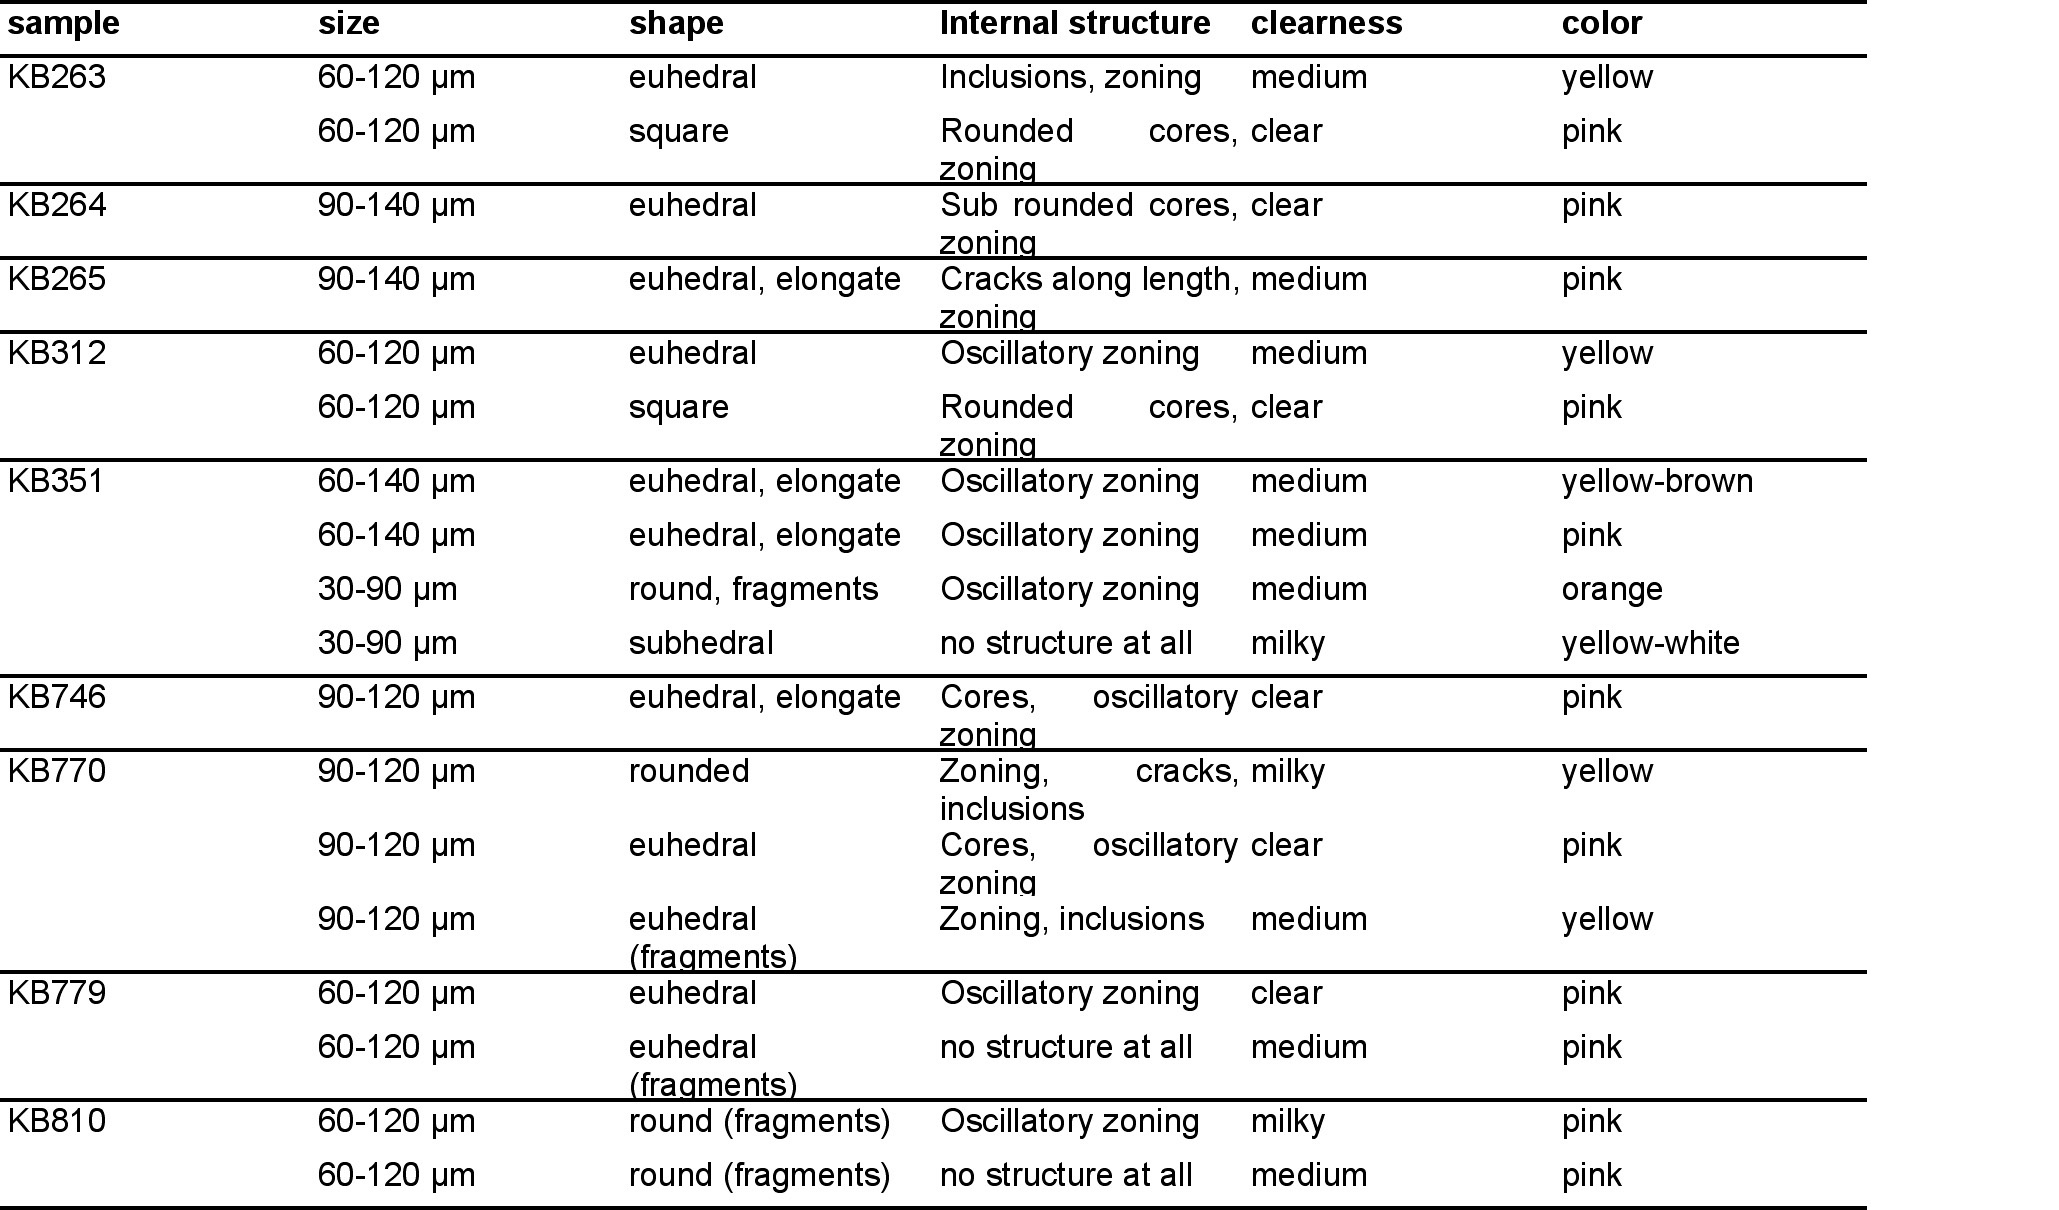
An overview of the zircon morphologies for all samples is given in Table 2.
Sample KB263 is a quartz-muscovite schist collected from the Tabba Tabba
Shear Zone at the East Turner River (Figure 2).
It is enclosed in quartz-albite-actinolite-chlorite schists. Based on petrology
and chemical composition (De Leeuw et al., 2001) these schists are interpreted
to be deformed and metamorphosed granites and granodiorites. Sample KB312
is a quartz-muscovite schist from the same suite, collected at the West
Turner River. These supracrustal rocks are incorporated in the south eastern
side of the Tabba Tabba Shear Zone. They form the footwall and we interpret
them to have originated from a crustal block now east of, and possibly also
underlying the Mallina Basin.
Samples KB265 and KB264 were collected from the southern part of the Tabba
Tabba Shear Zone at the East Turner River (Figure 2).
They are a metagranodiorite and a metagranite respectively. Both rock types
are moderately foliated and lineated. The orientation of their foliation
is consistent with an early dextral phase of deformation in the Tabba Tabba
Shear Zone, but the lineation in high-strain zones is parallel to that of
the major sinistral phase of movement on the Tabba Tabba Shear Zone. Their
magmatic ages must therefore predate early deformation of the shear zone.
The granite has intrusive contacts with the granodiorite, and is therefore
expected to be younger.
Sample KB779 is a metadiorite consisting mainly of hornblende and plagioclase.
It was collected from within the Tabba Tabba Shear Zone at Balbryna Well
(Figure 2). The metadiorite occurs in elongate
lenses along the southeastern side of the Tabba Tabba Shear Zone in the
section near the East Turner River. Sample KB810 is a metagabbro with relics
of olivine and orthopyroxene. Most of the rock now consists of talc, serpentine,
chlorite and opaque minerals. The sample was collected from the Tabba Tabba
Shear Zone at Balbryna Well, near sample location KB779. The metagabbro
occurs in lenses that are up to a few hundred meters long and up to 50 meters
wide, and is closely associated with the metadiorite of sample KB779 as
it only occurs inside the lenses of metadiorite. Both rocks are expected
to be younger than the quartz-muscovite schists and metagranite-granodiorite,
as the metadiorite has been observed to have intruded the metagranite-granodiorite.
Sample KB770 is a granite from Red Rock Pool, just south east of the Tabba
Tabba Shear Zone in the West Turner River (Figure 2).
This granite is weakly deformed. Pegmatites associated with it intrude the
Tabba Tabba Shear Zone at a low angle and are moderately deformed. They
do not show evidence for deformation as a result of the early dextral phase
of movement on the structure, supporting a younger age. These intrusions
do show evidence for deformation related to the major sinistral phase and
must therefore have been emplaced between the two tectonic events. This
granite is interpreted have caused the observed contact metamorphism in
the schists in the West Turner River.
Sample KB351 is an aplitic vein from the central part of the Tabba Tabba
Shear Zone. It is moderately deformed and therefore interpreted to have
intruded late syn-kinematically during the major sinistral phase (Beintema
et al., 2001). It is expected to provide a minimum age for this major phase
of activity of the Tabba Tabba Shear Zone. As it is a thin vein it is expected
to have picked up xenocrysts before or during emplacement, and thus may
provide information on the ages of the underlying rocks.
Sample KB746 is a weakly foliated K-feldspar porphyritic biotite monzogranite
from Yandeyarra. It occurs on the eastern boundary of what has been interpreted
to be the southerly extension of the Tabba Tabba Shear Zone (Figure
1). The age of this late syn-kinematic granite constrains the last stages
of movement of this part of the structure. This section is not linked in
outcrop to the main part of the Tabba Tabba Shear Zone, but it does show
a similar structural and tectonic history.
Analytical procedures
Sample preparation
Sample locations were selected on the basis of structural relations and
the availability of suitable rock types. All samples showed evidence for
at least low greenschist grade metamorphism. At each locality 20 kg was
sampled of the freshest available rock. Mineral separation was done at the
Vrije Universiteit, Amsterdam. The process involved crushing, sieving, cleaning,
density and magnetic separation, and hand-picking of the final fractions.
The selected grains were mounted in epoxy and polished to expose the interiors
of the grains.
The SHRIMP mounts were evaporatively coated with high purity gold. The LA-ICP-MS
mounts were carbon-coated for electron microscope imaging. Cathodoluminescence
(CL) and Scanning Electron Microscope (SEM) images of the grains were made
on a Philips XL30 SEM, to identify inclusions, inhomogeneiities and zoning.
Laser ablation ICP-MS U-Pb zircon analysis
Laser ablation ICP-MS measurements were performed at Utrecht University,
The Netherlands, in February 2002 and November 2002. We used the method
of Horn et al. (2000) that employs simultaneous laser ablation and solution
nebulization to correct for instrumental mass discrimination and laser related
elemental fractionation. A standard solution containing a known concentration
and isotopic composition of both Tl and U was used to correct for mass bias,
eliminating the need for an external (solid) standard. The system hardware
is described in detail by Mason and Kraan (2002). It consists of a Microlas
Geolas 200Q 193 nm excimer laser ablation system (Gunther et al., 1997)
with optics designed to ensure a flat energy density profile across the
beam at the point of ablation. Energy density at the sample surface was
constant during all experiments at 6 mJ/cm2 per pulse and different apertures
produced ablation crater sizes of 20, 30, 40, 60, 80 and 120 µm. Samples
were ablated with a laser pulse repetition rate between 5 and 10 Hz. The
sample cell was purged with He (0.45 l/min) which was then mixed with Ar
(0.65 l/min) carrying the nebulized Tl-U standard solution before injection
into the ICP-MS (Micromass Platform ICP). This quadrupole-based mass spectrometer
has only one ion lens, which reduces the possibility to minimize mass bias
but gives a very stable response over time. Typical sensitivity was approximately
9000 cps per ppm at m/z = 238 for the 91500 standard zircon at a laser pulse
repetition rate of 10 Hz and with a 120 mm crater. The formation of uranium
oxides was kept to a minimum; the ratio of UO+/U+ was less than 4% during
all analyses.
Each zircon analysis started with 60 seconds of background signal measurement
before the laser was switched on. Standard zircon 91500 (Table
3) and in-house standard CZ3 (Table 4) were
measured for 100 seconds. Sample measurements lasted as long as was allowed
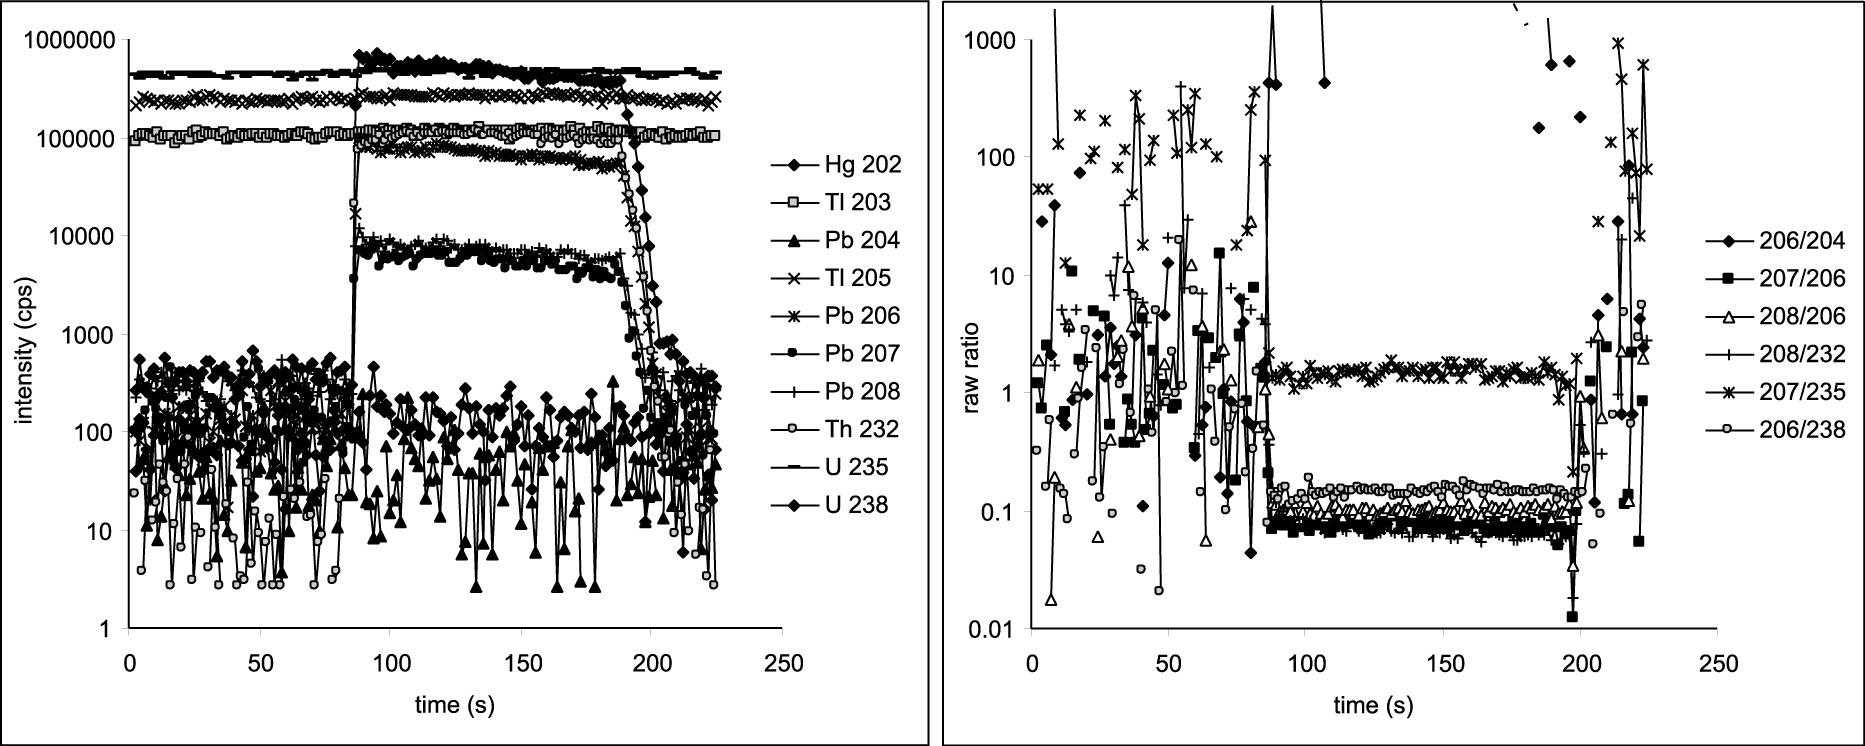
by the thickness of the mineral with a maximum analysis time of 200 seconds.
A typical example of a laser ablation signal is shown in Figure
3. The raw time-intensity laser ablation spectra were processed using
a modified version of the LAMTRACE spreadsheet program (Jackson, 1997).
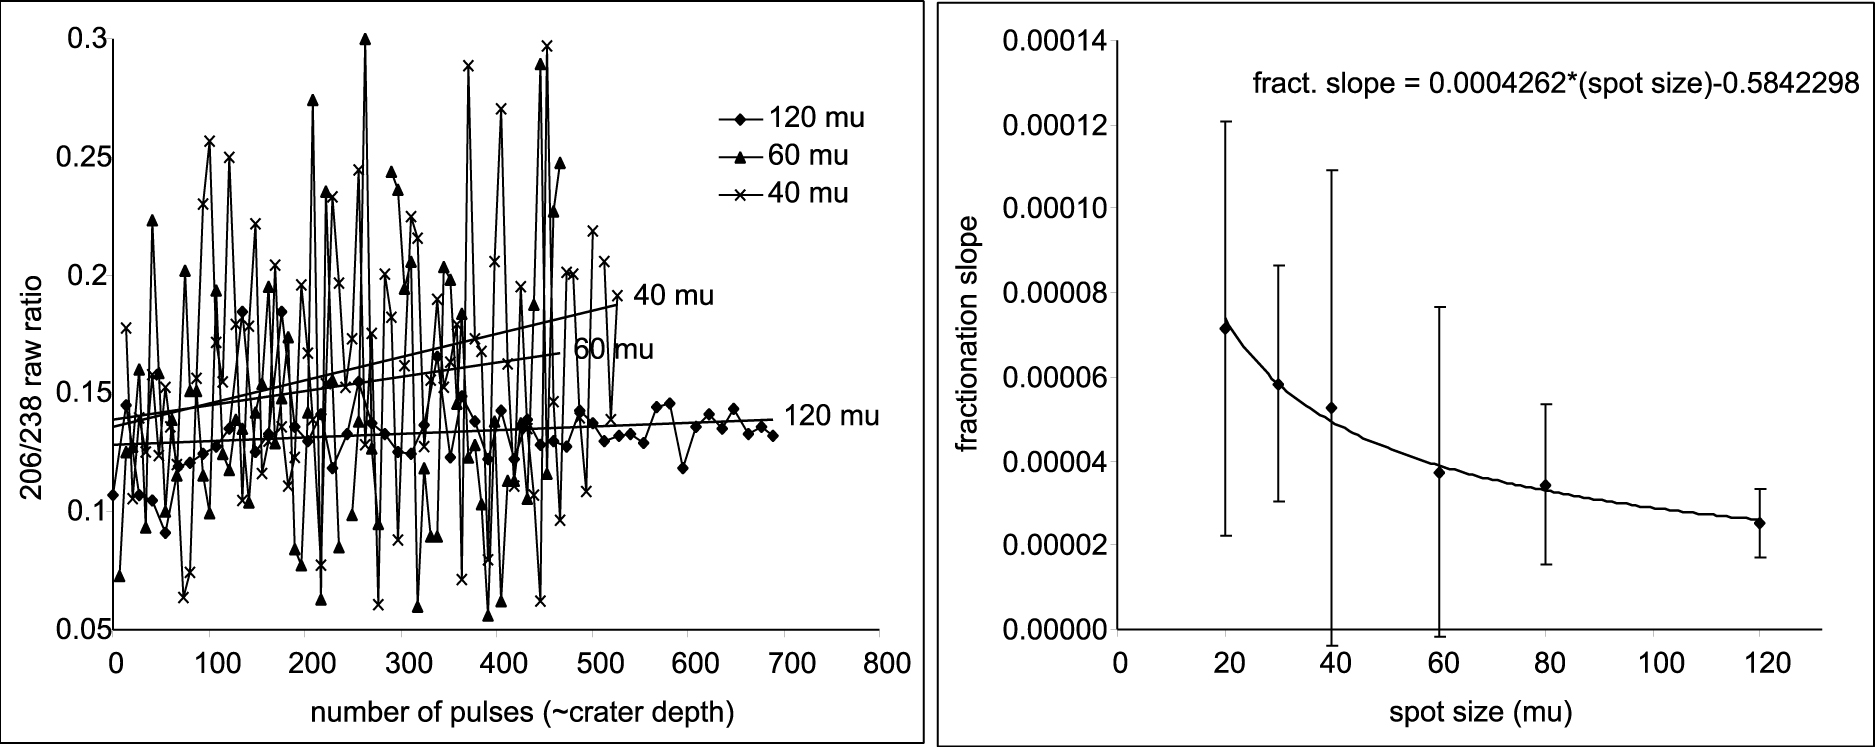
Laser induced fractionation can be related to the ablation crater geometry
(Horn et al., 2000; Mank and Mason, 1999) and a correction factor was calculated
using the standard data and applied as shown in Figure
4. A common Pb correction was applied as outlined below using the abundance
of 204Pb following a correction for the isobaric overlap of 204Hg using
202Hg and assuming 202Hg/204Hg to be 4.35. The calibration of Pb-Pb and
U-Pb ages was checked against the 91500 zircon.
SHRIMP U-Pb zircon analysis
Sensitive High Resolution Ion Micro Probe (SHRIMP) measurements were performed
on the facility at the Department of Applied Physics, at Curtin University
of Technology in Perth, Western Australia in February 2001. Analytical procedures
and data processing are described in detail by Nelson (1997).
Before every analysis the mount surface was cleaned to reduce the amount
of common lead present. This was done by rastering the primary beam across
the mount surface for at least two minutes. During the analysis the secondary
ion beam was focused into an electron multiplier by switching the magnetic
filter and moving the ion collector appropriately for the species of interest.
Ten ion species were measured consecutively in seven cycles. During every
cycle the following measurements were made: 90Zr216O+ (2 secs), 204Pb+ (10
secs), background at 204.1 (10 secs), 206Pb+ (10 secs), 207Pb+ (20 secs),
208Pb+ (10 secs), 238U+ (5 secs), 232Th16O+ (5 secs), 238U16O+ (2 secs)
and 238U16O2+ (2 secs). A common Pb correction was applied as described
below.
Isobaric interference in SHRIMP analysis arises from the formation of hydrides;
e.g. 206Pb1H+ interferes with 207Pb+. The occurrence of these species was
monitored by comparing the 208Pb corrected ratios on the standard, with
the assumed value of 0.0592. It was not necessary to apply a correction
to any of the samples in this study.
Analyses that were concordant, or which defined a recent lead-loss trajectory
were pooled on the basis of their 207Pb/206Pb ages. Individual analyses
were rejected if they were highly discordant and on the basis of unusual
zircon morphology (e.g. shape, zonation, cracks, lattice damage).
The errors reported on individual analyses in this study are based on counting
statistics, include the scatter on the UO+/U+ versus 206Pb/238U calibration
curve, and include the errors introduced by the common Pb correction. Errors
on the pooled ages include the uncertainty in the reproducibility of the
Pb/U values in the standard.
U-Pb data processing
Analyses with large errors that can be attributed to the presence of zoning,
cracks and inclusions in the analyzed zircon, were rejected from the dataset.
All LA-ICP-MS analyses with an integration interval shorter than 20 seconds
were rejected because of poor counting statistics. In some cases it was
possible to use separate integration intervals in the LA-ICP-MS data to
exclude disturbances, but when the intervals were shorter than 20 seconds
those analyses were rejected. High uranium content may cause a zircon to
become metamict due to destruction of the crystal lattice by radiation.
This enhances the mobility of U and especially Pb. As a consequence, high
uranium content was also a reason for rejection of some analyses.
A correction was applied for common Pb on the basis of the abundance of
204Pb, which was typically 10 ppm in all standards measured and variable
in the samples. This was assumed to be common lead from the mount surface
and a correction as described by Compston et al. (1984) was applied, assuming
the common Pb component to have the isotopic composition of Broken Hill
Pb (204Pb/206Pb=0.0625, 207Pb/206Pb=0.9618 and 208Pb/206Pb=2.2285). Pooled
207Pb/206Pb ages and upper intercept U-Pb concordia ages were calculated
using Isoplot (Ludwig, 2001). Cumulative probability diagrams were used
to identify different populations within samples. Concordia diagrams show
the U-Pb upper intercept ages and the degree of discordance. All samples
show discordancy trends that are consistent with radiogenic Pb-loss at zero
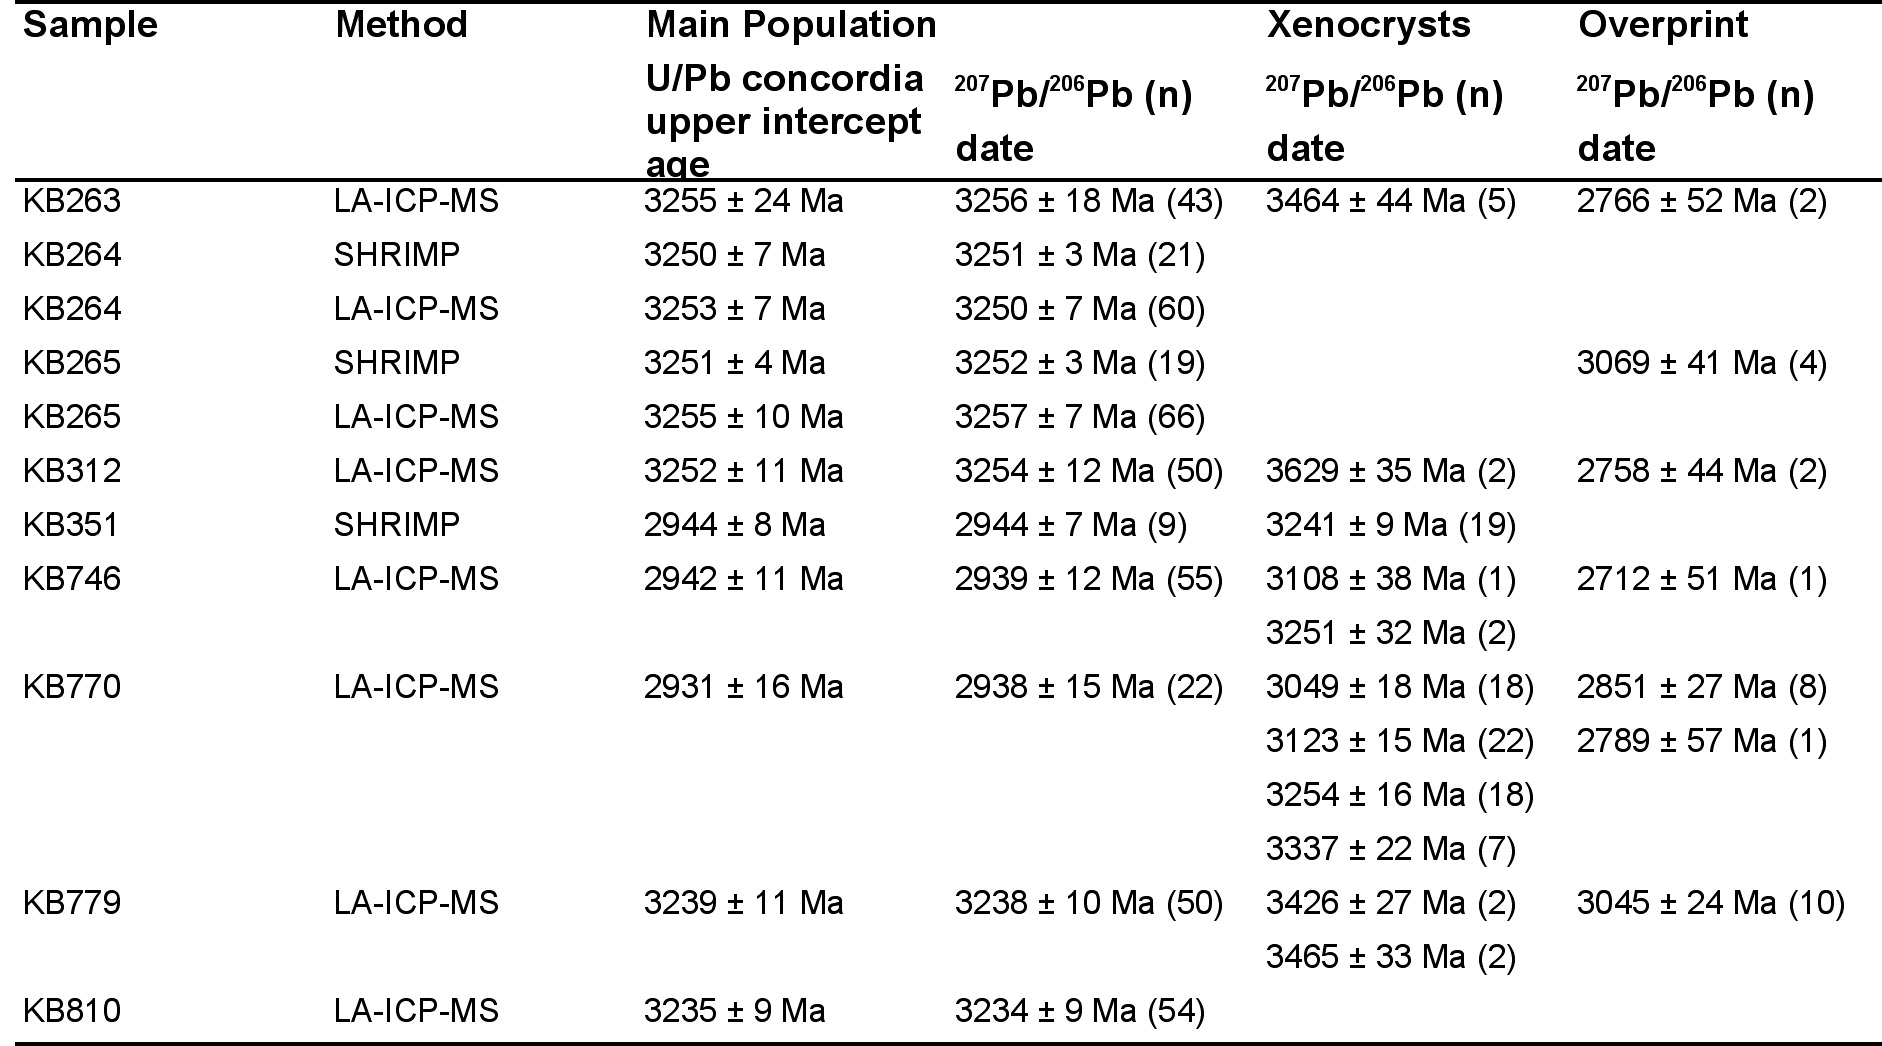
age. A summary of the interpreted ages is given in Table
5. All errors are 2s errors.
Zircon major and trace element analysis
The chemical composition of selected zircons from samples KB770, KB779
and KB810 was measured by electron microprobe (EMP) and laser ablation ICP-MS
analysis. Major elements were determined using a Jeol 8600 Superprobe with
5 wavelength dispersive spectrometers. A 15 kV accelerating potential and
10 nA beam current were used to measure 1 mm analysis sites and a correction
was applied using the f(rz) algorithm supplied by Noran.
Trace elements were measured by laser ablation ICP-MS analysis on 20 mm
diameter sites within the same growth zones of each zircon and adjacent
to the craters measured for the U-Pb dating described above. Zones were
identified using optical microscopy and CL techniques, but as an additional
check the Pb-Pb ages were determined within the same analytical run as the
trace element measurements. Precision on these age measurements (not reported
here) was degraded due to poorer counting statistics but was sufficient
in most cases to check that the correct zone had been identified. Although
we measured a different part of the sample to measure the trace elements
the homogeneity of their distribution within a zone (as seen in depth resolved
plots and during repeat analyses) supports this approach. Calibration was
performed against NIST SRM 610 glass using the compiled concentration data
of Pearce et al (1997) and EMP Hf data for internal standardization. Accuracy
for trace element results was assessed using zircon 91500 (Wiedenbeck et
al., 1995).
Results
A summary of the U-Pb age dating results is given in Table
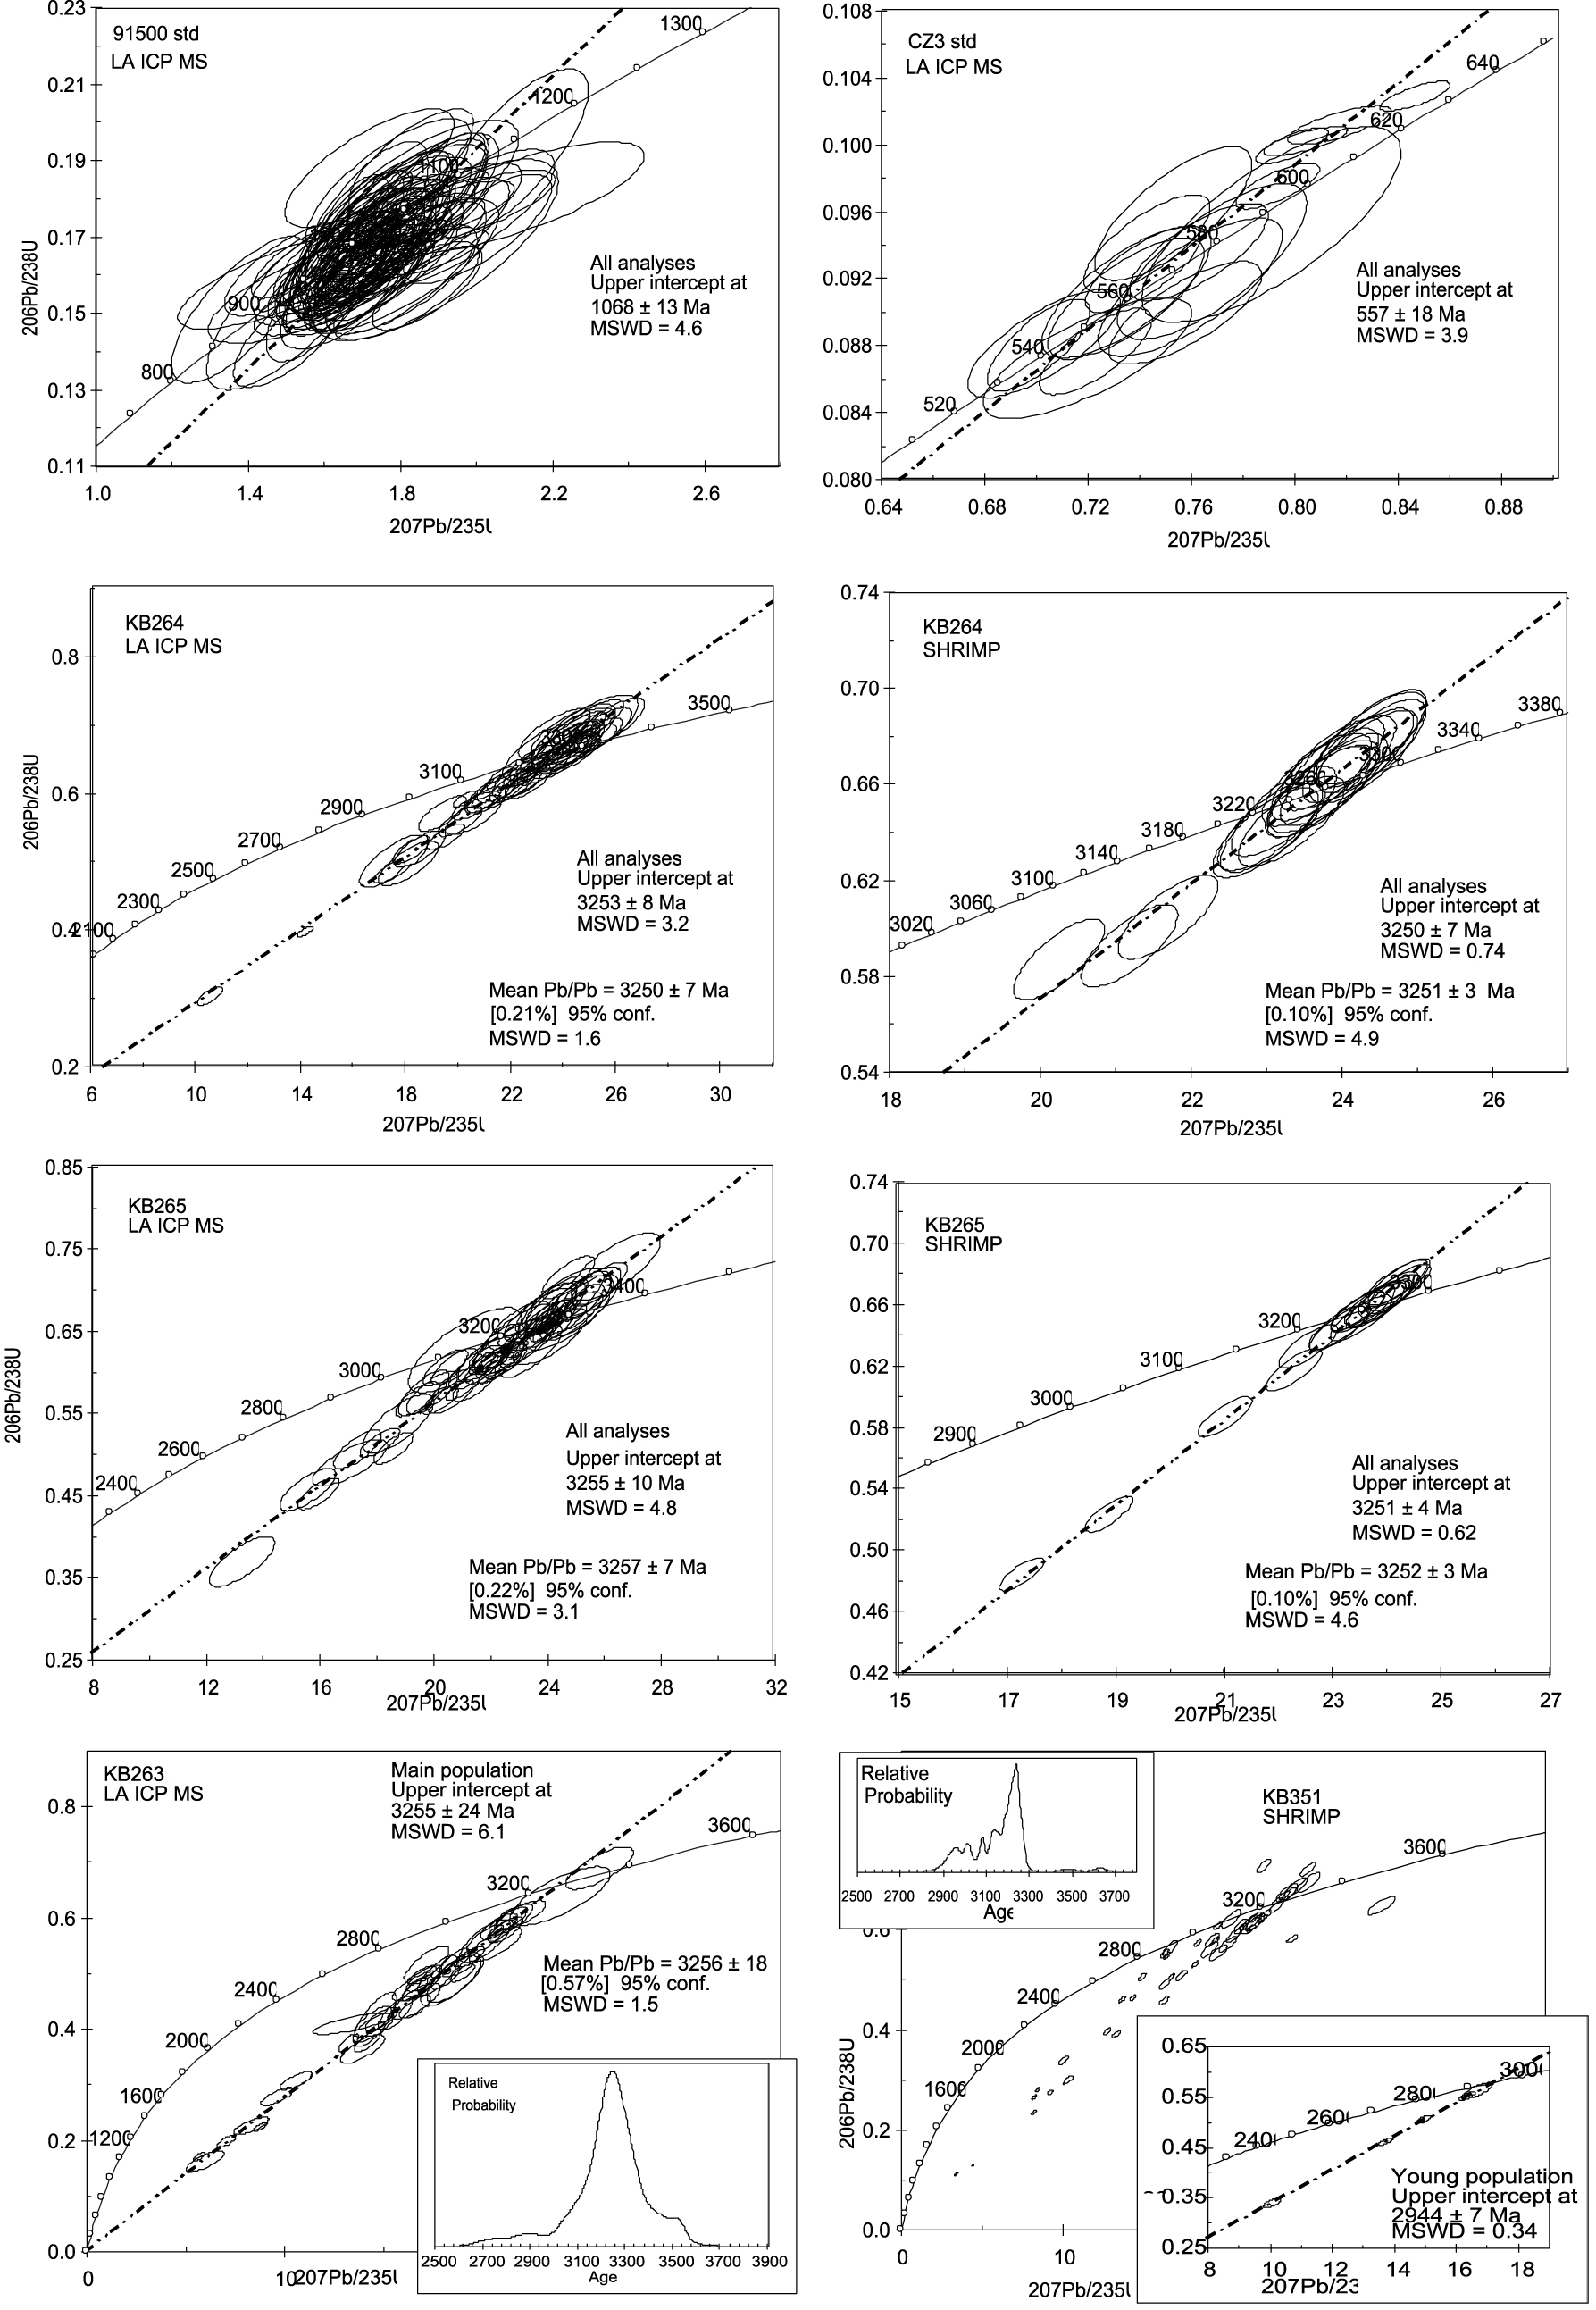
5. The concordia diagrams are shown in Figure
5a and 5b. The Laser Ablation data tables
can be found in Appendix A, the SHRIMP data tables in Appendix B. The inclusion
of results in our dataset by both laser ablation ICP-MS and SHRIMP required
a careful validation of the agreement of the two techniques for a number
of samples. The relatively fast analysis time by laser ablation ICP-MS enabled
populations of at least 60 zircons to be routinely measured per sample.
However, in some samples heterogeneous populations were measured and a range
of U-Pb ages could be determined depending upon the interpretation of the
number of different xenocryst populations. To overcome this limitation,
trace element data were used to better constrain the origin and extent of
xenocryst groups. Full U-Pb and major and trace element concentration data
are reported in Appendix C.
Standard data
The CZ3 in-house standard zircon was used as an internal standard for the
SHRIMP analyses and as an external check for the LA-ICP-MS results. Pidgeon
et al. (1994) reported that this Sri Lankan gem-quality zircon is free of
inclusions and zoning, contains no detectable 204Pb and that its crystal
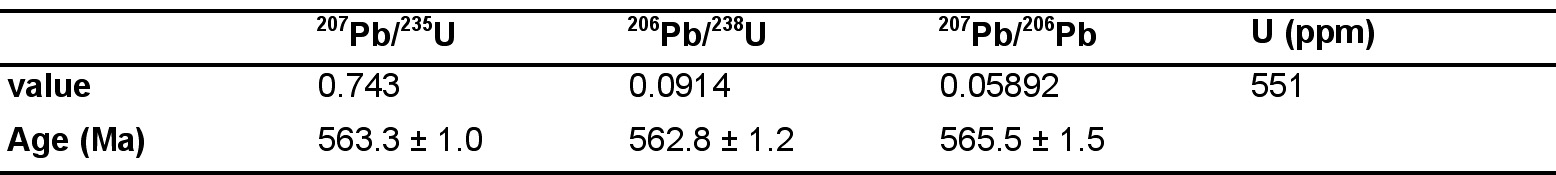
lattice is undamaged. This homogeneous zircon was dated previously by the
TIMS method (Nelson, 1997), giving a concordant age of 564 Ma. In this study,
LA-ICP-MS gave a mean Pb-Pb age of 559 ± 20 Ma and an upper intercept
U-Pb age of 557 ± 18 Ma (Figure 5a and
5b) showing excellent agreement with the TIMS
value.
Accuracy of the LA-ICP-MS was further assessed using the standard 91500
zircon. Wiedenbeck et al. (1995) reported that this very large (293 gm)
single grain of zircon is free of inclusions and zoning, contains no significant
204Pb and that its crystal lattice is undamaged. On the basis of data acquired
by the TIMS method, Wiedenbeck et al. (1995) assigned standard values and
ages to the isotope ratios as shown in Table 3.
The results are very slightly discordant with a mean 207Pb/206Pb age of
1062.4 Ma. The 91500 zircon standard was ablated during every analytical
session at regular intervals. Furthermore it was ablated during the setting
up of the instrument, and it was measured every 20 minutes to monitor drift.
The results were stable and consistent over the time period during which
all analyses were performed. Agreement with the reference TIMS data was
again excellent; the TIMS age is within the error of both LA-ICP-MS Pb-Pb
and U-Pb mean ages.
Comparison of laser ablation ICP-MS and SHRIMP results
Laser ablation ICP-MS has been widely used and developed for in situ U-Pb
zircon dating over the past decade (e.g. Feng et al., 1993; Fryer et al.,
1993; Hirata and Nesbitt, 1995). Recent techniques involving the simultaneous
nebulization of a standard solution (as used here) have eliminated the need
for an external standard (Horn et al., 2000) and give very similar results
to SIMS for zircon dating (Kohler et al., 2002). We have further verified
the ability of both techniques to give identical results in this study.
Although the results on the 91500 and CZ3 zircon standards have shown that
the LA-ICP-MS system returns accurate and reproducible data, it was necessary
to show agreement with the SIMS results before further interpreting the
ages in a geological context. A comparison was made by measuring two concordant
samples with single populations (KB 264 and KB 265) by both methods. As
these samples are significantly older (3250 Ma) than the 91500 standard
zircon (1062 Ma) and CZ3 (564 Ma) they contain more radiogenic Pb, and therefore
the results are more precise. Agreement was excellent, the laser ablation
results being within error of the SHRIMP results and vice versa (Figure
5a and 5b).
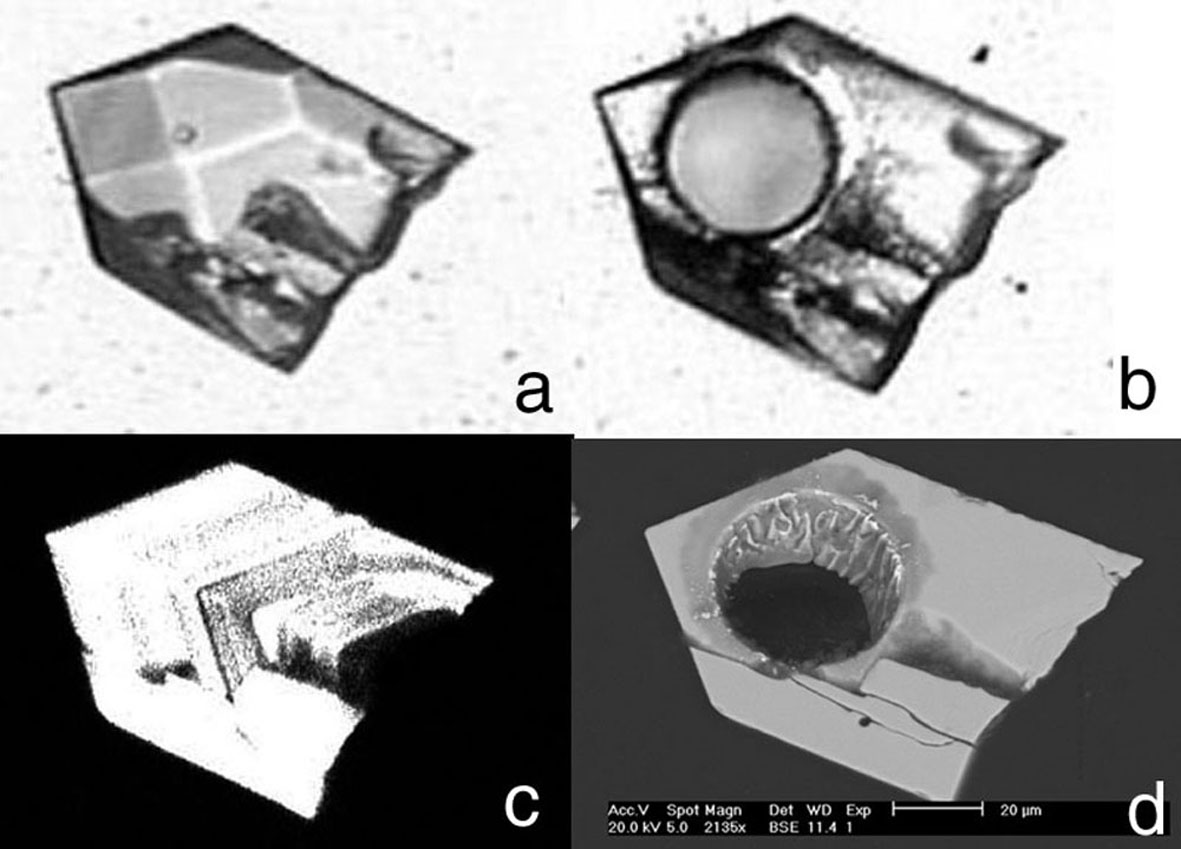
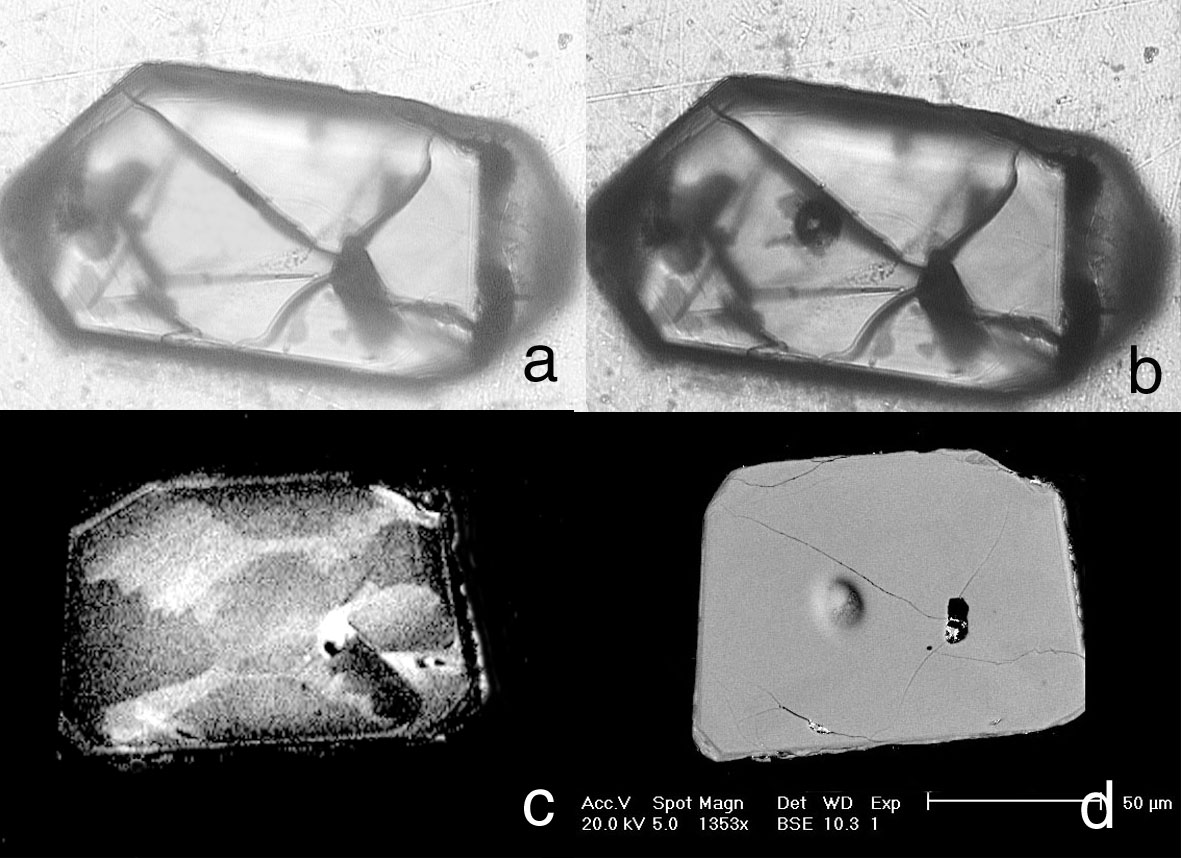
The volume of material analyzed was significantly larger in laser ablation
than for SHRIMP analyses. The SHRIMP spots were typically 15-20 mm in diameter
and no more than 5-10 mm deep (Figure 6), whereas
the laser ablation craters were typically 40-60 mm in diameter and penetrated
all the way through the zircon grain (Figure 7).
The greater 3D volume component during laser ablation increased the chance
of sampling different zones within the zircon during an analysis. The chances
of hitting a crack, inclusion or other impurity were therefore much larger
during laser ablation and this may account for the generally more discordant
nature of the laser ablation results. However, despite this it has been
shown here that the pooled 207Pb/206Pb ages by laser ablation ICP-MS agree
to within error to those of the SHRIMP.
Discussion
The oldest rocks found in the Tabba Tabba area are quartz-muscovite schists
interleaved with actinolite schists. On the basis of their geochemistry
(De Leeuw et al., 2001) they are interpreted to represent a deformed and
metamorphosed granite-granodioritic suite. The obtained 207Pb/206Pb ages
of 3256 ± 18 Ma and 3254 ± 12 Ma from samples KB263 and KB312
are within error of each other and are interpreted to record the time of
igneous crystallization. The samples contain apparent zircon populations
of 3464 ± 44 Ma and 3629 ± 35 Ma respectively that interpreted
to be xenocrystic in origin.
Field relationships show that a granodiorite (sample KB265) has been intruded
by granite (sample KB264). The SHRIMP 207Pb/206Pb ages of 3252 ±
3 Ma and 3251 ± 3 Ma are identical within error to the LA-ICP-MS
results, and are interpreted as magmatic crystallization ages of the granodiorite
and granite respectively. No other granites of this age are known to occur
in this part of the Pilbara. The occurrence of these rocks and the quartz-mica-amphibole
schists is confined to a narrow strip within the Tabba Tabba Shear Zone.
Dioritic and gabbroic suites represented by samples KB779 and KB810 intrude
the granite-granodiorite suite. The 207Pb/206Pb ages of 3238 ± 10
Ma and 3234 ± 9 Ma are interpreted as the time of magmatic crystallization
(Table 5). Their occurrences are confined
to lenses within the Tabba Tabba Shear Zone. The diorite contains xenocrystic
zircon populations of 3465 ± 33 Ma and 3426 ± 26 Ma. In order
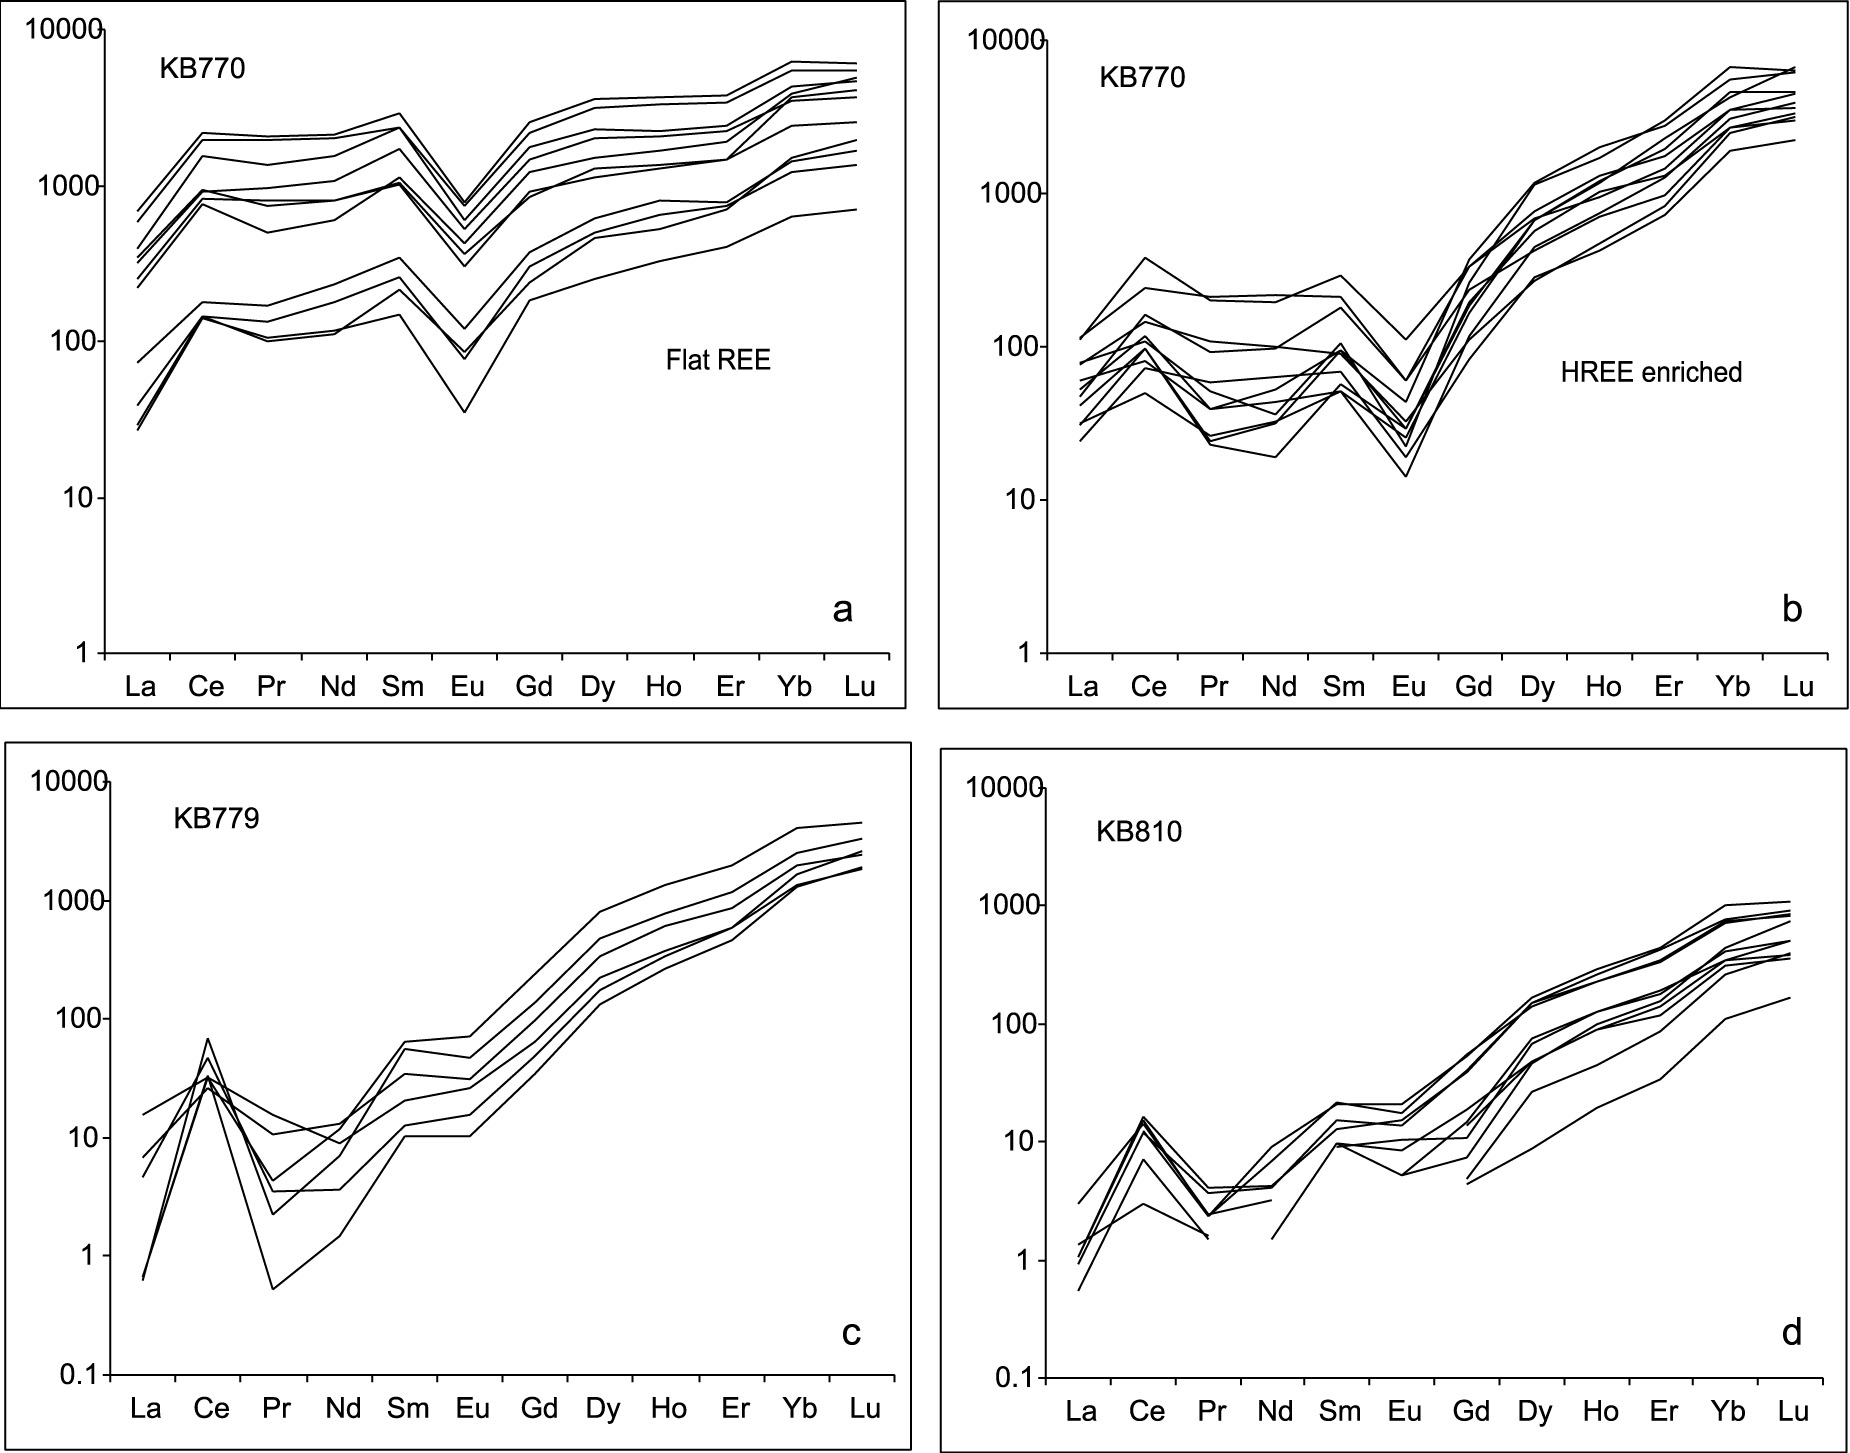
to establish the origin of the zircons, trace elements chemistry was determined
by laser ablation ICP-MS. Their trace element concentrations and patterns
(Figure 8) are consistent with dioritic to gabbroic
source rocks and the ages of the zircons are therefore interpreted to correlate
to the magmatic ages of the rocks.
Granite sample KB770 contains a young population at 2939 ± 21 Ma,
which is interpreted to represent the magmatic crystallization age of the
rock. It also contains apparent xenocrystic populations with 207Pb/206Pb
ages of 3049 ± 18 Ma and 3123 ± 14 Ma, and a group at 3250
Ma which indicates the presence of basement rocks similar in age to the
muscovite schists and granite-granodiorite suite (Table
5). Primary oscillatory zoning in zircons (as seen most clearly in CL
images) is due to unstable chemical gradients. It has been suggested (Connely,
2000) that diffusion associated with metamorphism blurs and destroys the
zoning, and this may be an indication of Pb loss and associated discordance.
However, diffusion rates of Pb in zircon are probably so slow that under
most geologic conditions Pb isotopes ratios will not be altered as the mean
closure temperature for zircon is more than 900°C (Cherniak and Watson,
2000). The absence of zoning in many of the zircons sampled here is therefore
unlikely to be the cause for the differences in the obtained ages.
The aplitic vein of sample KB351 is weakly deformed and its youngest zircons,
with a 207Pb/206Pb age of 2944 ± 8 Ma, provide an estimate of the
timing of the last stages deformation of the Tabba Tabba Shear Zone. The
sample contains many xenocrysts, and the biggest population indicates the
presence of rocks of 3250 Ma in this area. This is confirmed by the results
of other samples presented here.
The weakly foliated granite of sample KB746 is from the southerly extension
of the Tabba Tabba Shear Zone at Yandeyarra (Figure
1). The 207Pb/206Pb magmatic crystallization age of 2939 ± 12
Ma of this granite confines the last stages of movement of this part of
the structure. It contains xenocrysts of 3108 ± 38 Ma and 3251 ±
32 Ma. This corresponds to the data obtained from the Turner River locations.
This section is not linked in outcrop to the main part of the Tabba Tabba
Shear, but it does show a relation in gravity and magnetic images (courtesy
AGSO, Blewett pers. comm. 2000) and has a similar tectonic and geochronological
history.
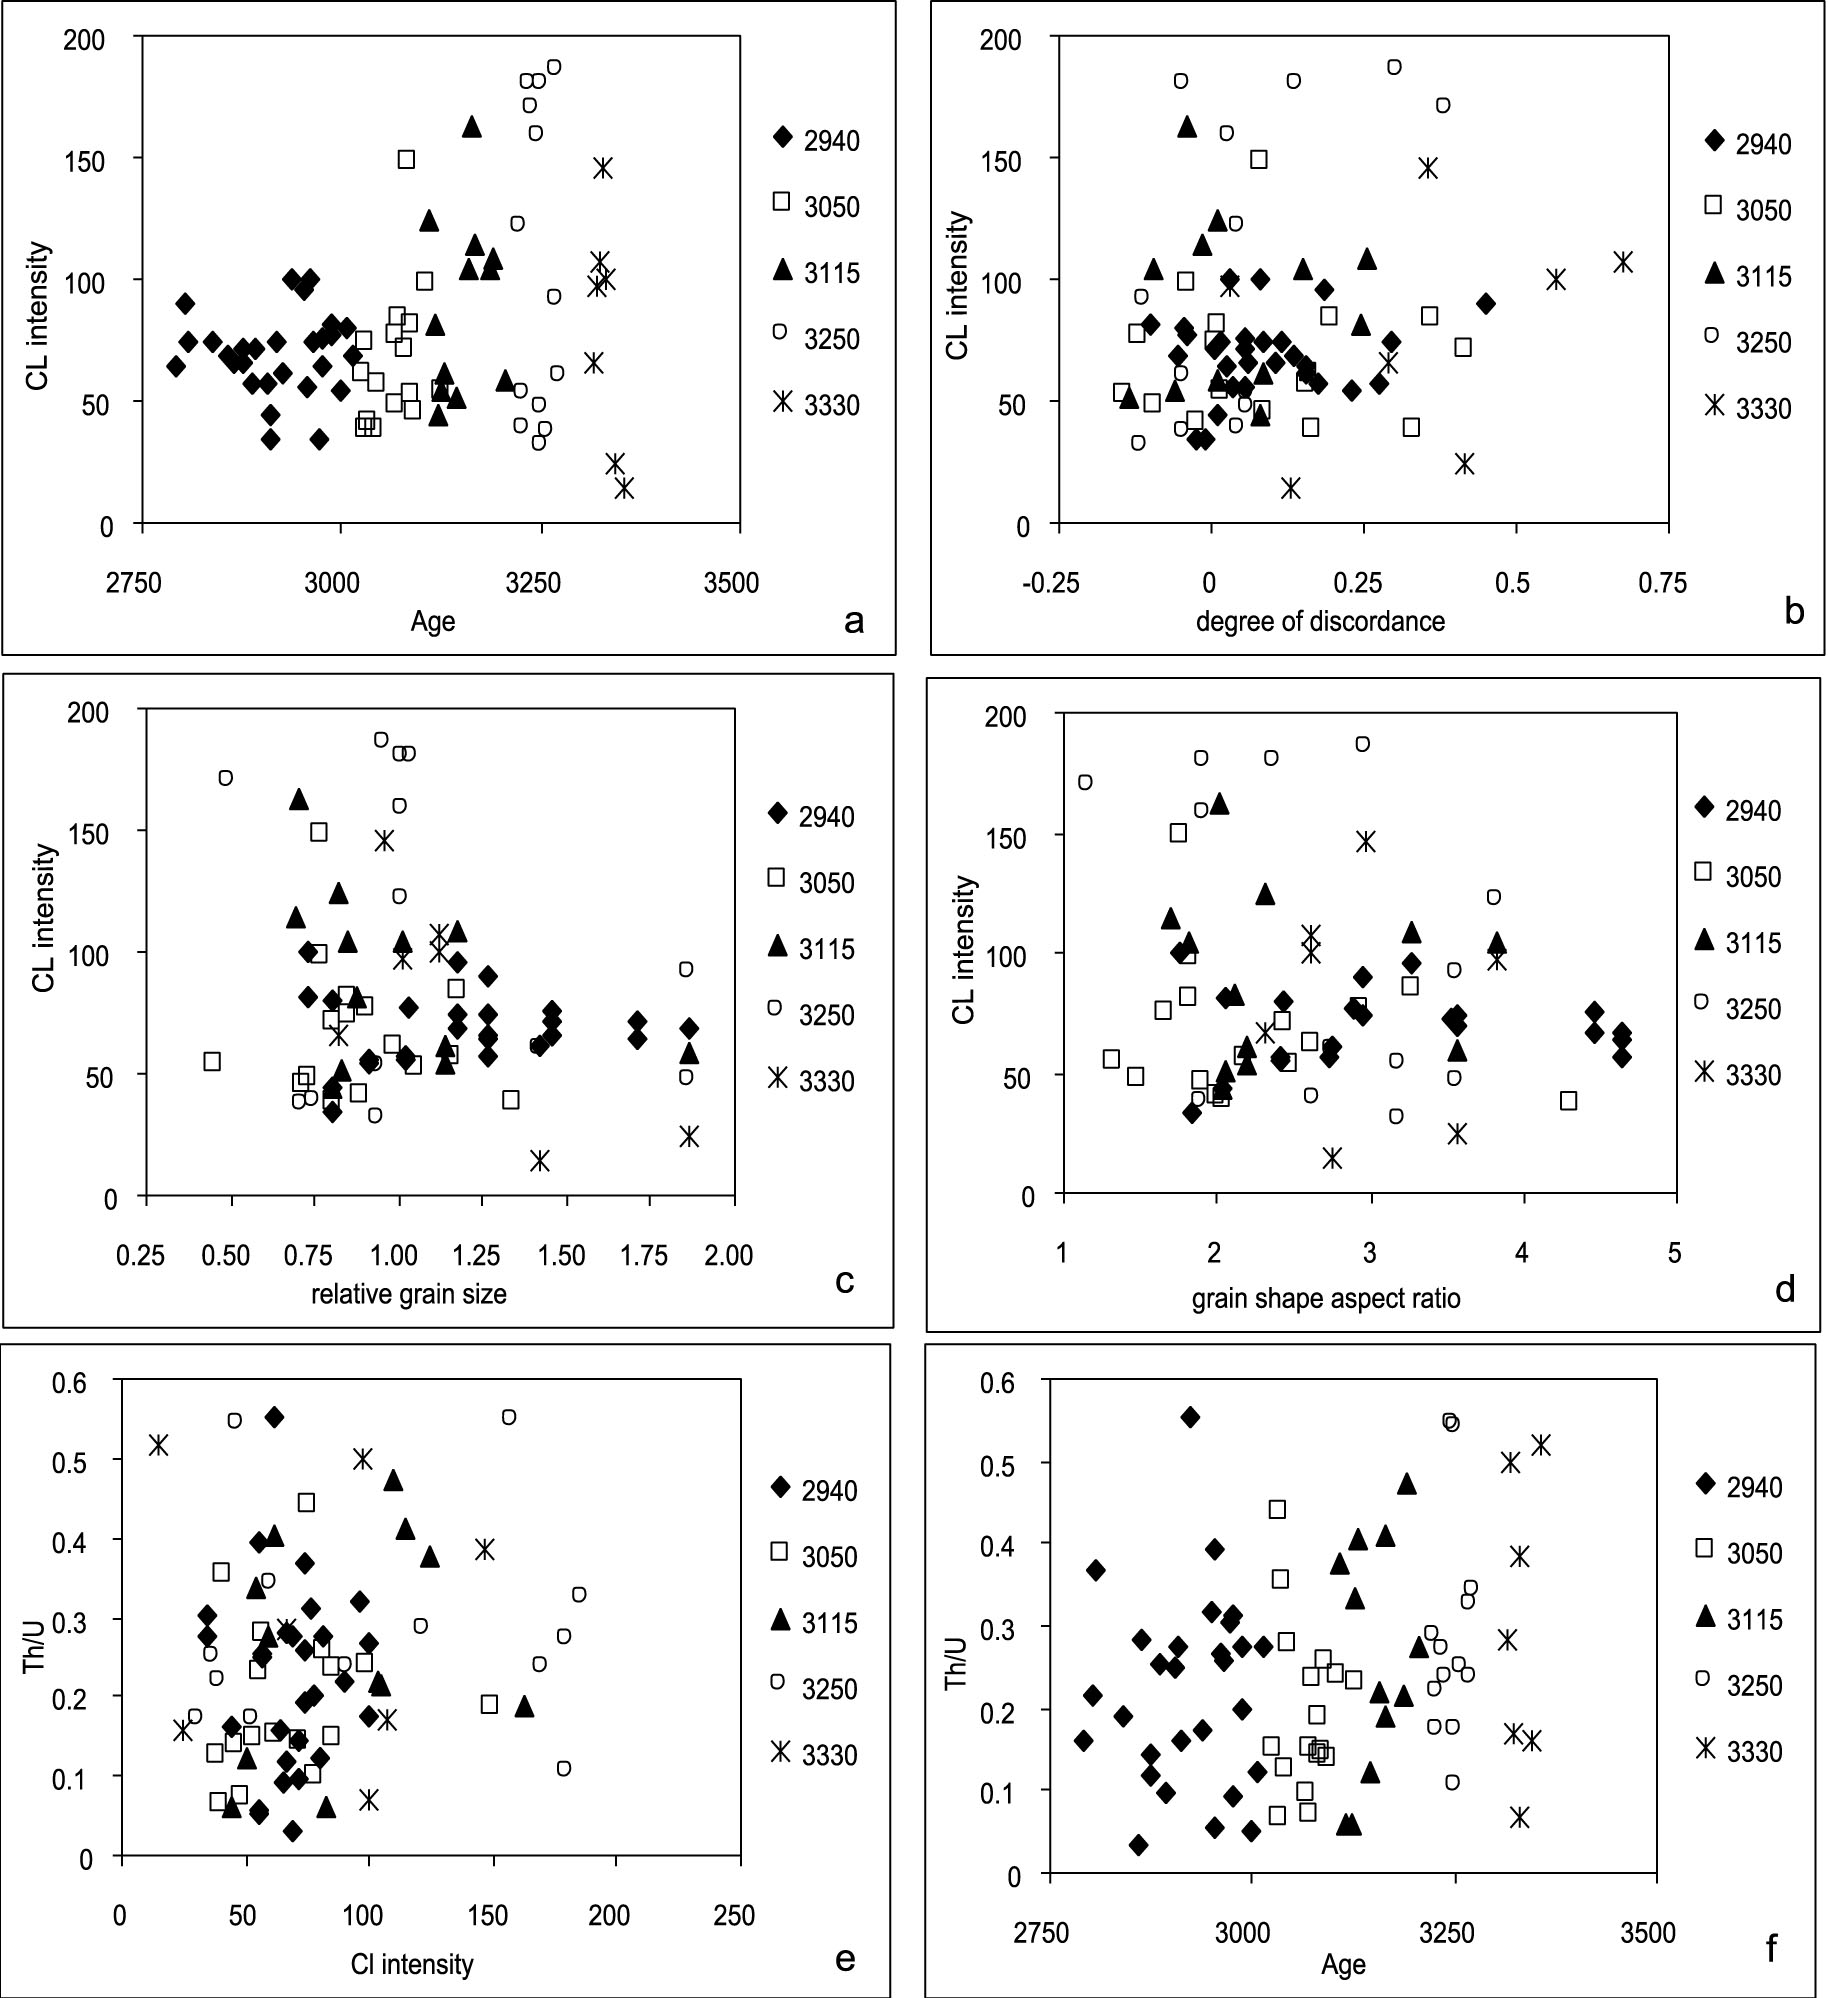
In order to identify possible multiple populations of zircons, we investigated
the relationship between zircon morphology and age. In granite KB770, which
is the sample with the most strikingly different populations (Table
5), there was no obvious correlation between age and length-width aspect
ratio, CL intensity or discordance as can be seen in Figure
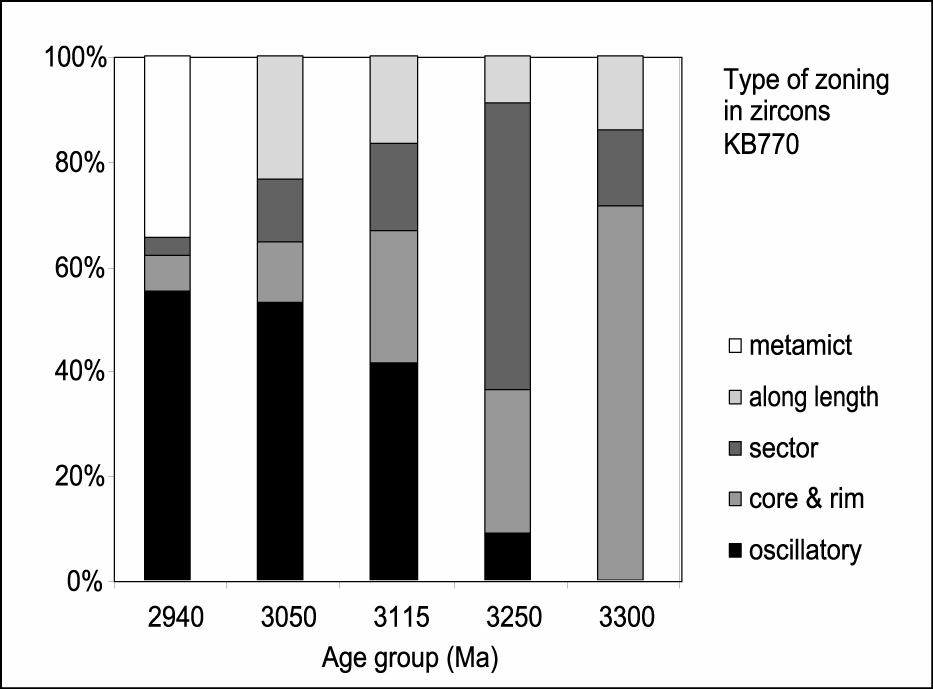
9. The type of zoning is the only visual indication of the presence
of more than one age population, see Figure 10
and Figure 11.
Another, potentially more powerful tool for distinguishing populations is
to use the trace element chemistry of the zircons (Belousova et al., 2002).
The zircons of sample KB770 can be divided into two groups on the basis
of their REE patterns, as shown in Figure 8. There
is a distinction between flat patterns and those that are enriched in HREE.
The group with the flatter REE pattern corresponds to both the cores and
rims of zircons from the group with an age of approximately 3250 Ma, confirming
that this is most probably xenocrystic in nature. Zircons with this type
of flat REE patterns typically originate from highly LREE enriched melts
consistent with a granitic origin (Belousova et al., 2002).
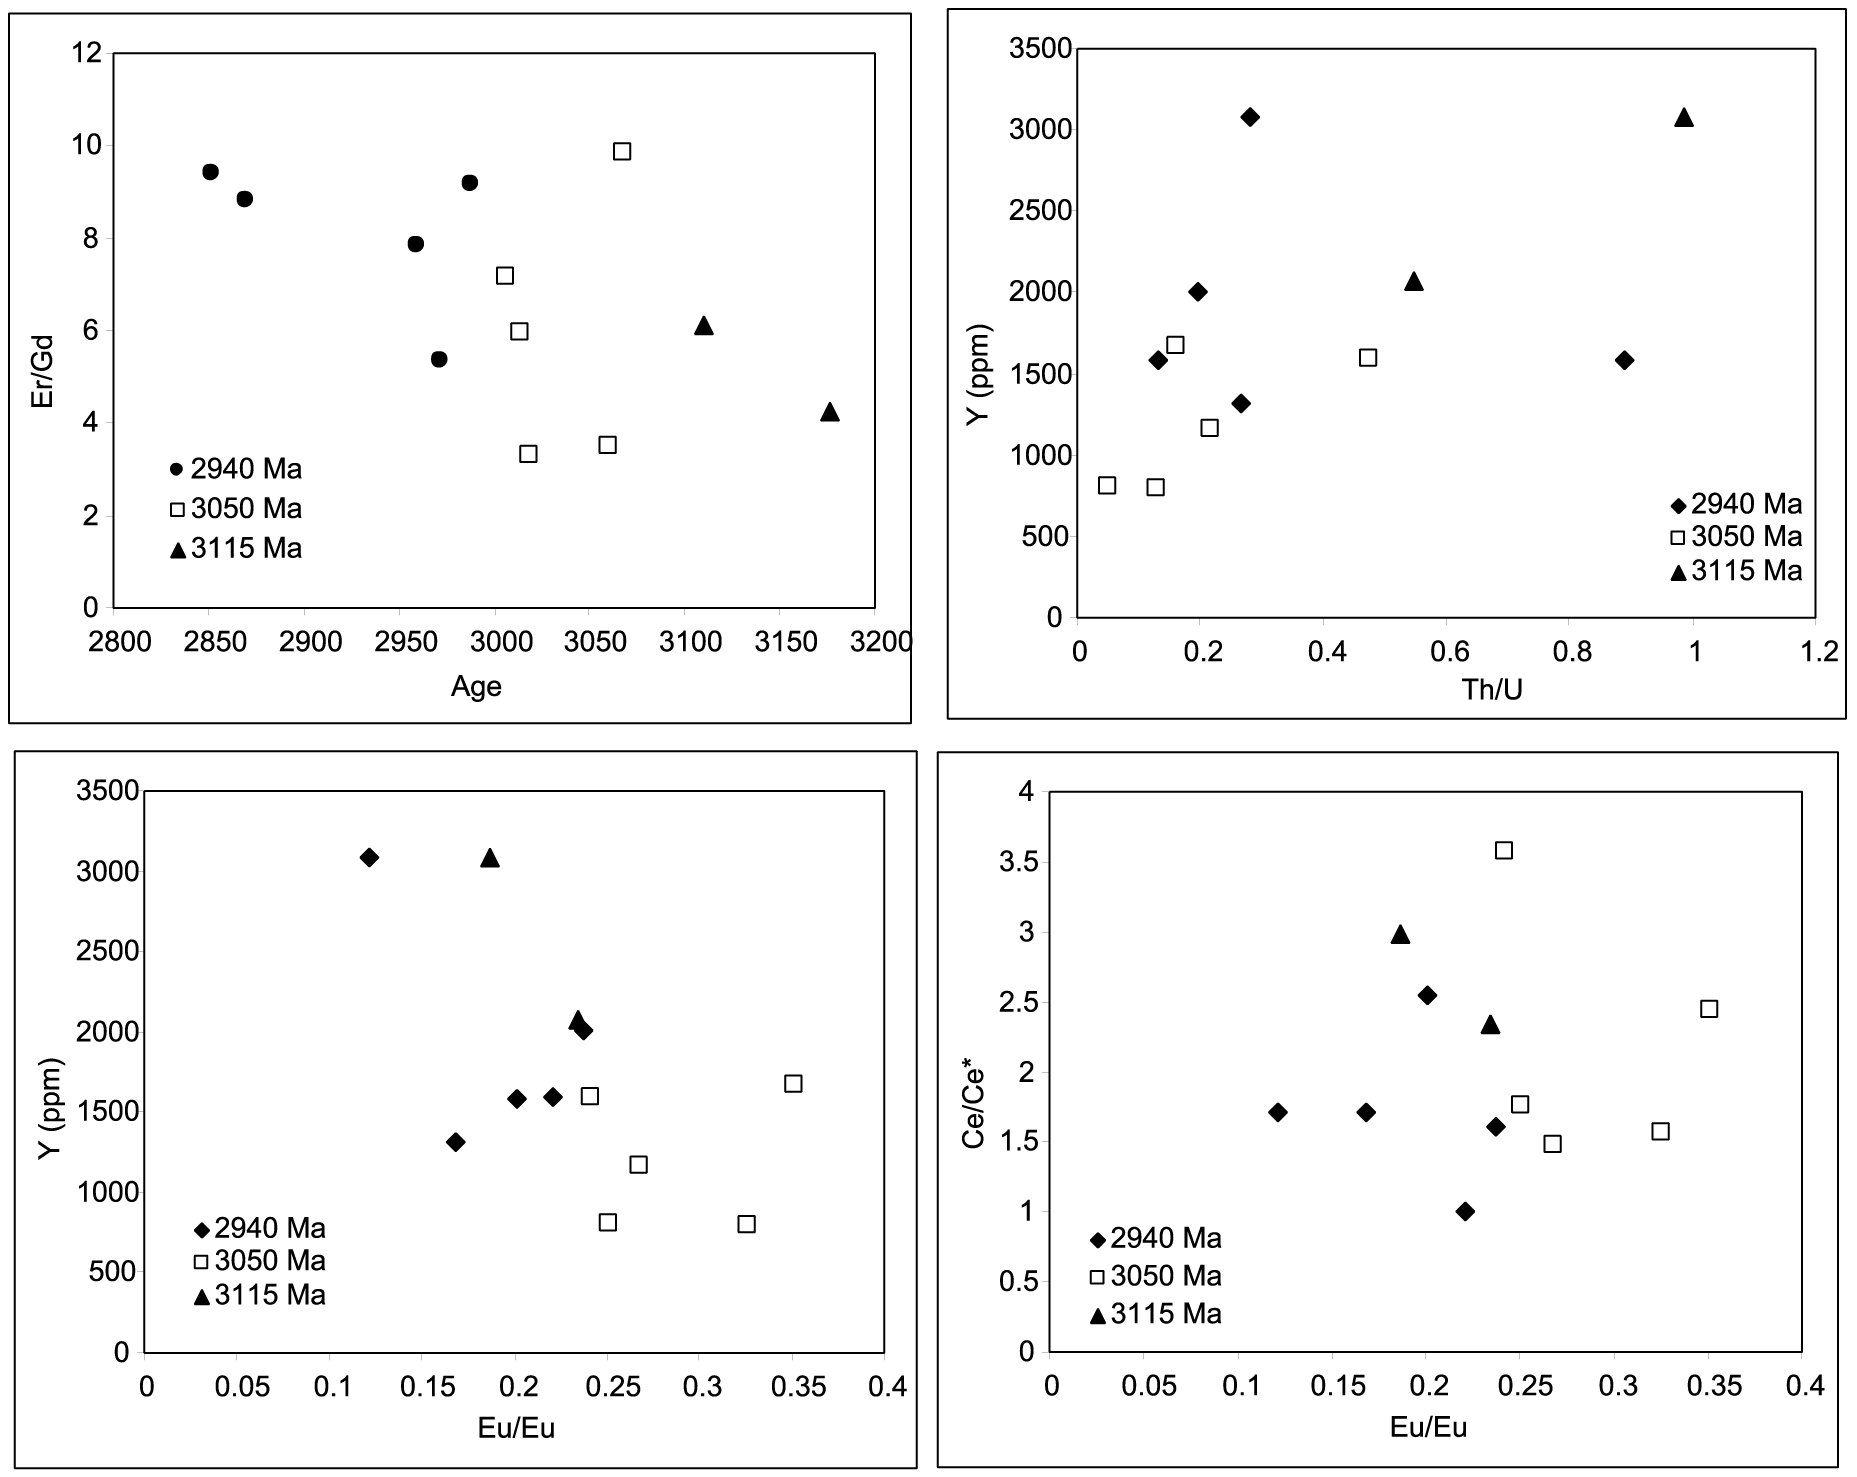
The HREE enriched zircons in sample KB770 are from groups with ages of ca
2940 Ma, 3050 Ma, and 3115 Ma. The magnitude of the HREE enrichment (Figure
12) is weakly related to age, being larger in the younger zircons. The
Th/U ratio and Y content is lowest for the 3050 Ma group (Figure
12) whilst Eu/Eu* is elevated (>0.25 as opposed to <0.25 for the
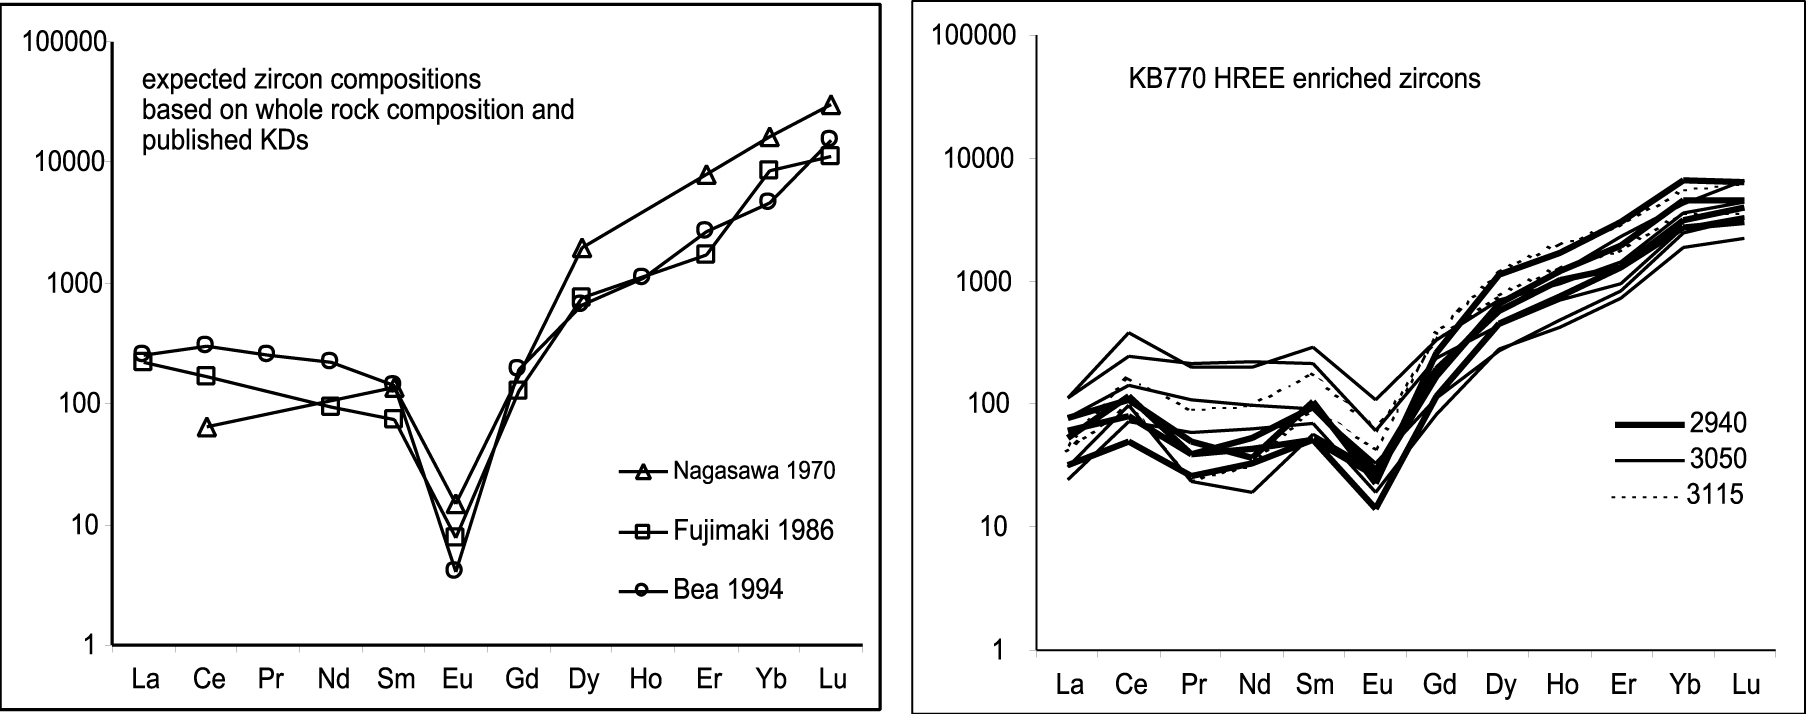
other groups). The whole rock analyses of the host granite (Appendix D)
provide an opportunity to model the expected REE compositions in zircons
that are in equilibrium with this rock. That is, assuming the whole rock
is representative of the melt composition, and assuming the zircons were
in equilibrium with the melt. The results for three different models (Bea
et al., 1994; Fujimaki, 1986; Nagasawa, 1970) and shown in Figure 13a.
When compared with the zircon patterns in Figure 13b
it might be concluded that the steepest pattern is most likely to be in
equilibrium with the granite. It is concluded that the 2940 Ma age group
represents the magmatic age of the rock. However, the differences are very
small and it is difficult to convincingly separate the groups on the basis
of this small amount of data.
Tectonic implications
The history of this part of the Pilbara Craton started with the intrusion
of a granite-granodiorite suite into unidentified basement at about 3255
Ma. The presence of xenocrysts similar in age to the 3475-3435 Ma Warrawoona
Group (Bickle et al., 1993; Buick et al., 2002; McNaughton et al., 1993;
Nelson, 1996; Nelson, 1998; Nelson, 1999; Nelson, 2000; Nelson, 2001; Pidgeon,
1978; Thorpe et al., 1992; Williams and Collins, 1990; Zegers et al., 1996;
Zegers, 1996; Zegers et al., 2001), indicates a possible basement or precursor
rock of that age, and implies a relation to the East Pilbara. The older
(ca 3630 Ma) xenocrysts are similar in age to parts of the Warrawagine granite,
also in the East Pilbara, and detrital zircons of this age range also occur
in the Mallina Basin (Smithies et al., 2001). The granitic and granodioritic
schists are similar in age to the Golden Cockatoo Formation in the Abydos
Belt, between the Pilgangoora Belt and the Yule Batholith. These rocks are
described as metamorphic pelite, quartzite, BIF and rhyolite, must have
been deposited on >3312 Ma rocks and are crosscut by 3240 Ma granites
(Blewett, 2002; Van Kranendonk et al., 2002). Alternatively the granite
and granodiorite may correlate to intrusive components of the Sulphur Springs
Group.
A dioritic and gabbroic suite intruded the area at about 3235 Ma, and the
occurrence of these rocks restricted to lenses within the Tabba Tabba Shear
Zone. This age is similar to the age of the intermediate to felsic volcanic
Sulphur Springs Group and Strelley Granite in the East Pilbara (Buick et
al., 2002; Vearncombe and Kerrich, 1999), but their age is the only similarity
between the two occurrences. These rocks also contain xenocrysts with ages
corresponding to the ca 3.45 Ga Warrawoona Group and gneisses in the East
Pilbara (Nelson, 1998; Nelson, 1999; Nelson, 2000; Pidgeon, 1978).
The rock types described above are the oldest in the area and they occur
only within the Tabba Tabba Shear Zone. They are interpreted to represent
an exotic block of possibly East Pilbara crust. A detrital zircon study
of the Mallina Basin (Smithies et al., 2001) indicates that sediments containing
zircons with ages between 3250 and 3200 Ma were derived from the east. This
conforms with the interpretation that the strip of rocks of that age within
the Tabba Tabba Shear Zone, represents a crustal block originally east of
the Tabba Tabba Shear Zone.
Structures within the Tabba Tabba Shear Zone indicate a dextral compressive
event affected the area after the early intrusive events described above.
The 3115 Ma age of xenocrystic zircons in younger granites within the Tabba
Tabba Shear Zone corresponds to a magmatic and volcanic event in the West
Pilbara represented by the Whundo Group and Cheratta Granitoid Complex (Hickman,
1999; Hickman et al., 2001; Nelson, 1996; Nelson, 1998; Smith et al., 1998),
and may indicate that the East and the West Pilbara spatially closer associated
by that time. The compressive event is interpreted to correspond to that
event.
Undeformed to weakly deformed granitoids in the area have an age of 2940
Ma (Smithies et al., 1999). Older samples show a metamorphic overprint at
about 2940 Ma. This overprint is interpreted to be due to a major oblique
sinistral tectonic event on the Tabba Tabba Shear Zone, and the thermal
disturbance associated with late- to post-kinematic granite intrusions.
Its age is within error of data from other studies which suggest the main
phase of activity of the Tabba Tabba Shear Zone took place between 2955
and 2928 Ma (Smithies et al., 2001). This major sinistral event is interpreted
to correspond to closure of the Mallina Basin, which existed between 2970
and 2940 Ma.
Two much weaker and younger overprints possibly correspond to intrusion
of tin-bearing monzogranites in the Pilbara at 2850 Ma (Nelson, 1998) and
the onset of the Fortescue Group volcanism at 2770 Ma (Arndt et al., 1991;
Nelson, 1997; Wingate, 1999). This indicates the structure may have been
reactivated at that time.
Summary and Conclusions
A comparison was made between LA-ICP-MS U-Pb zircon geochronology and SHRIMP.
Two concordant samples with single populations were analysed by both methods.
Agreement was excellent, the laser ablation results being within error of
the SHRIMP results and vice versa. The volume of material analyzed was significantly
larger in laser ablation than for SHRIMP analyses. The greater 3D volume
component during laser ablation increased the chance of sampling different
zones, cracks, inclusions or other impurities, and this may account for
the generally more discordant nature of the laser ablation results. However,
despite this it has been shown here that the pooled 207Pb/206Pb ages by
laser ablation ICP-MS agree to within error to those of the SHRIMP.
The Tabba Tabba Shear Zone is a structure with a history of more than 300
million years. Early granite and granodiorite intruded between 3255 and
3250 Ma. Subsequently the area was intruded by diorite and gabbro, at about
3235 Ma. Xenocrysts in these rocks indicate the presence of basement rocks
similar in age to the Warrawoona Group in the East Pilbara.
A compressive event with a dextral component affected the structure and
the surrounding area before 3115 Ma, as indicated by xenocrystic ages in
a suite of granites. The Whundo Group and Cheratta Granitoid Complex in
the West Pilbara comprise extensive extrusive and intrusive suites of about
3115 Ma. This leads to the interpretation that the East and West Pilbara
had coalesced at that time. The observed early dextral compression may be
the structural record of that event.
The Tabba Tabba Shear Zone then acted as a bounding fault of the Mallina
Basin, before it became reactivated during the major phase of oblique sinistral
movement on the Tabba Tabba Shear Zone, that occurred before intrusion of
granites at about 2940 Ma. The end of the major sinistral event is interpreted
to correspond to closure of the Mallina Basin, which existed between 2970
and 2940 Ma. After deformation had ceased, the central Pilbara was intruded
by post-tectonic granite, between 2940 and 2930 Ma. This marked the end
of the active tectonics of the Pilbara Granite Greenstone Terrane.
Acknowledgements
We are grateful to the Dr. Schürmann Fund for the financial support of our field work in the Pilbara with grant numbers 1999/14a, 2000/14a and 2001/14a, and we would like to thank the Molengraaff Fund for their financial support in 1999, 2000 and 2001. The Netherlands Organization for Scientific Research (NWO) is thanked for their financial contribution with grant number R75-386 to the SHRIMP part of this project, and for providing funding for the Utrecht LA-ICP-MS laboratory. We would like to thank R. van Elzas for his assistance with the mineral separation, Dr. H.L.M. van Roermond for his assistance with electron microscope imaging, A. Frew for his assistance with the SHRIMP analyses, and Dr. M. Barth and G. Nobbe for their help with the laser ablation analyses.
References
- Arndt, N.T., Nelson, D.R., Compston, W., Trendall, A.F. and Thorne, A.M., 1991. The age of the Fortescue Group, Hamersley basin, Western Australia, from ion microprobe zircon U-Pb results. Aust. J.Earth Sci., 38: 261-281.
- Barley, M.E., 1997. The Pilbara Craton. In: M.D. Wit and L.D. Ashwal (Editors), Greenstone Belts. Clarendon, Oxford, pp. 657-664.
- Bea, F., Pereira, M.D. and Stroh, A., 1994. Mineral/leucosome trace-element partitioning in a peraluminous migmatite (a laser ablation-ICP-MS study). Chemical Geology, 117: 219-312.
- Beintema, K.A., De Leeuw, G.A.M., White, S.H. and Hein, K.A.A., 2001. The Tabba Tabba Shear; a crustal scale structure in the Archaean Pilbara Craton, WA, 4IAS. AGSO, Record 2001/37, Perth, WA, pp. 285-287.
- Belousova, E.A., Griffin, W.L., O’Reilly, S.Y. and Fisher, N.I., 2002. Igneous zircon: trace element composition as an indicator of source rock. Contrib Mineral Petrol, 143: 602-622.
- Bickle, M.J. et al., 1993. Origin of the 3500-3300 Ma calc-alkaline in the Pilbara Archaean; Isotopic and geochemical constraints from the Shaw Batholith. Precambrian Research, 60: 117-149.
- Blewett, R., 2002. Archaean tectonic processes: a case for horizontal shortening in the North Pilbara Granite-Greenstone Terrane, Western Australia. Precambrian Research, 113: 87-120.
- Buick, R. et al., 2002. Geochronology and stratigraphic relationships of the Sulphur Springs Group and Strelley Granite: a temporally distinct igneous province in the Archaean Pilbara Craton, Australia. Precambrian Research, 114: 87-120.
- Buick, R. et al., 1995. Record of emergent continental crust ~3.5 billion years ago in the Pilbara craton of Australia. Nature, 375: 574-577.
- Cherniak, D.J. and Watson, E.B., 2000. Pb diffusion in zircon. Chemical Geology, 172: 5-24.
- Compston, W., Williams, I.R. and Meyer, C., 1984. U-Pb geochronology of zircons from lunar braccia 73217 using a sensitive high mass-resolution ion microprobe. Journal of Geophysical Research, B 89: 525-534.
- Connely, J.N., 2000. Degree of preservation of igneous zonation in zircon as a signpost for concordancy in U/Pb geochronology. Chemical Geology, 172: 25-39.
- De Leeuw, G.A.M., Beintema, K.A., Wijbrans, J.R. and White, S.H., 2001. Chemistry of Archaean gabbros intruding the Tabba Tabba Shear Zone, Pilbara, WA, 4IAS. AGSO, Record 2001/37, Perth, WA, pp. 143-145.
- Feng, R., Machado, N. and Ludden, J., 1993. Lead geochronology of zircon by laserprobe ICP MS. Geochimica et Cosmochimica Acta, 57: 3479-3486.
- Fryer, B.J., Jackson, S.E. and Longerich, H.P., 1993. The application of LAM-ICP-MS to in situ (U)-Pb geochronology. Chemical Geology, 109: 1-8.
- Fujimaki, H., 1986. Partition coefficients of Hf, Zr, and REE between zircon, apatite, and liquid. Contrib Mineral Petrol, 94: 42-45.
- Gunther, D., Frischknecht, R., Heinrich, C.A. and Kahlert, H.J., 1997. Capabilities of an argon fluoride 193 nm excimer laser for laser ablation inductively coupled plasma mass spectrometry microanalysis of geological materials. Journal of Analytical Atomic Spectrometry, 12: 939-944.
- Hickman, A.H., 1999. New tectono-stratigraphic interpretations of the Pilbara Craton, Western Australia. GSWA Record, 1999/6: 4-6.
- Hickman, A.H., Smithies, R.H., Pike, G., Farrell, T.R. and Beintema, K.A., 2001. Evolution of the West Pilbara Granite-Greenstone Terrane and Mallina Basin, Western Australia - a field guide. GSWA Record, 2001/16: 65p.
- Hirata, T. and Nesbitt, R.W., 1995. U-Pb isotope geochronology of zircon: Evaluation of the laser probe ICP MS technique. Geochimica et Cosmochimica Acta, 59(12): 2491-2500.
- Horn, I., Rudnick, R.L. and McDonough, W.F., 2000. Precise elemental and isotope ratio determination by simultaneous solution nebulization and laser ablation ICP-MS: application to U-Pb geochronology. Chemical Geology, 167: 405-425.
- Jackson, S.E., 1997. LAMTRACE v 1.73, LAM-ICP-MS data reduction spreadsheet. Department of Earth Sciences, Memorial University of Newfoundland, St John’s, Canada.
- Kohler, J., Fonneland, H., Sylvester, P., Tubrett, M. and Pedersen, R.-B., 2002. U-Pb dating of detrital zircons for sediment provenance studies - a comparison of laser ablation ICPMS and SIMS techniques. Chemical Geology, 182: 605-618.
- Ludwig, K.R., 2001. Isoplot, v 2.49. Berkeley Geochronology Center Special Publ. 1a.
- Mank, A.J.G. and Mason, P.R.D., 1999. A critical assessment of laser ablation ICP-MS as an analytical tool for depth analysis in silica-based glass samples. Journal of Analytical Atomic Spectrometry, 14: 1143-1153.
- Mason, P.R.D. and Kraan, W.T., 2002. Attenuation of spectral interferences during laser ablation inductively coupled plasma mass spectrometry (LA-ICP-MS) using an rf only collision and reaction cell. Journal of Analytical Atomic Spectrometry, 17: 858-867.
- McNaughton, N.J., Compston, W. and Barley, M.E., 1993. Constraints on the age of the Warrawoona Group, eastern Pilbara Block, Western Australia. Precambrian Res., 60: 69-98.
- Nagasawa, 1970. zircon trace element partition coefficients.
- Nelson, D.R., 1996. Compilation of SHRIMP U-Pb zircon geochronology data, 1995. 1996/5, Geological Survey of Western Australia.
- Nelson, D.R., 1997. Compilation of SHRIMP U-Pb zircon geochronology data, 1996. 1997/2, Geological Survey of Western Australia.
- Nelson, D.R., 1998. Compilation of SHRIMP U-Pb zircon geochronology data, 1997. 1998/2, Geological Survey of Western Australia.
- Nelson, D.R., 1999. Compilation of SHRIMP U-Pb zircon geochronology data, 1998. 1999/2, Geological Survey of Western Australia.
- Nelson, D.R., 2000. Compilation of SHRIMP U-Pb zircon geochronology data, 1999. 2000/2, Geological Survey of Western Australia.
- Nelson, D.R., 2001. Compilation of SHRIMP U-Pb zircon geochronology data, 2000. 2001/2, Geological Survey of Western Australia.
- Pearce, N.J.G. et al., 1997. A compilation of new and published major and trace element data for NIST SRM 610 and NIST SRM 612 glass reference materials. Geostandards Newsletter, 21: 115-144.
- Pidgeon, R.T., 1978. 3450-m.y.-old volcanics in the Archaean layered greenstone succession of the Pilbara Block, western Australia. 37: 421-.
- Pidgeon, R.T., Furfaro, D., Kennedy, A.K., Nemchin, A.A. and Van Bronswijk, W., 1994. Calibration of zircon standards for the Curtin SHRIMP II, 8th International Conference on Geochronology, Berkeley, USA. USGS Circular, 1107, pp. 251.
- Smith, J.B., Barley, M.E., Groves, D.I., Krapez, B. and McNaughton, N.J., 1998. The Sholl Shear Zone, Western Pilbara: Evidence for a domain boundary structure from integrated tectonostratigraphic analyses, SHRIMP U-Pb dating and isotopic and geochemical data of granitoids. Precambrian Res., 88: 143-171.
- Smithies, R.H., Hickman, A.H. and Nelson, D.R., 1999. New constraints on the evolution of the Mallina Basin, and their bearing on relationships between the contrasting eastern and western granite-greenstone terranes of the Archaean Pilbara Craton Western Australia. Precambrian Research, 94: 11-28.
- Smithies, R.H., Nelson, D.R. and Pike, G., 2001. Development of the Archaean Mallina Basin, Pilbara Craton, northwestern Australia: a study of detrital and inherited zircon ages. Sedimentary Geology, 141-142: 79-94.
- Sun, S.-S. and McDonough, W.F., 1989. Chemical and isotopic systematics of oceanic basalts: implications for mantle composition and processes. In: A.D. Saunders and M.J. Norry (Editors), Magmatism in the ocean basins. Geological Society Special Publications No. 42, pp. 313-345.
- Thorpe, R.I., Hickman, A.H., Davis, D.W., Mortensen, J.K. and Trendall, A.F., 1992. U-Pb zircon geochronology of Archaean felsic units in the Marble Bar region, Pilbara Craton, Western Australia. Precambrian Res., 56: 169-189.
- Van Kranendonk, M.J., Hickman, A.H., Smithies, R.H., Nelson, D.R. and Pike, G., 2002. Geology and tectonic evolution of the Archaean North Pilbara terrain, Pilbara Craton, Western Australia. Economic Geology, 97: 695-732.
- Vearncombe, S. and Kerrich, R., 1999. Geochemistry and geodynamic setting of volcanic and plutonic rocks associated with early Archaean volcanic massive sulphide mineralization, Pilbara Craton. Precambrian Research, 98: 243-270.
- White, S.H., Zegers, T.E., Van Haaften, W.M., Kloppenburg, A. and Wijbrans, J.R., 1998. Tectonic evolution of the eastern Pilbara, Australia. Geol. Mijnb., 76(4): 343-347.
- Wiedenbeck, M. et al., 1995. Three natural zircon standards for U-Th-Pb, Lu-Hf, trace element and REE analyses. Geostandards Newsletter, 19: 1-23.
- Williams, I.S. and Collins, W.J., 1990. Granite-greenstone terranes in the Pilbara Block, Australia, as coeval volcano-plutonic complexes; evidence from U-Pb zircon dating of the Mount Edgar Batholith. EPSL, 97: 41-53.
- Wingate, M.T.D., 1999. Ion microprobe baddeleyite and zircon ages for Late Archaean mafic dykes of the Pilbara Craton, Western Australia. Australian Journal of Earth Sciences, 46: 493-500.
- Zegers, T., Keijzer, M.d., Dirks, P. and White, S.W., 1996. Extensional structures during deposition of the 3460 Ma Warrawoona Group in the eastern Pilbara Craton, Western Australia. Precambrian Res., 80: 89-105.
- Zegers, T.E., 1996. Structural, kinematic and metallogenic evolution of selected domains of the Pilbara granitoid-greenstone terrain. Geologica Ultraiectina, 146, 208 pp.
- Zegers, T.E., Nelson, D.R., Wijbrans, J.R. and White, S.H., 2001. SHRIMP U-Pb zircon dating of Archaean core complex formation and pancratonic strike-slip deformation in the East Pilbara Granite-Greenstone Terrain. Tectonics, 20(6): 883-908.
Figures
- Figure 1.
- Simplified geological map of the Pilbara Craton, Western Australia. The location of the studied area is indicated.
- Figure 2.
- Overview of the geology of the exposed central section of the Tabba Tabba Shear Zone. Locality is indicated in Figure 1.
- Figure 3.
- Typical example of a laser ablation signal. Count rates vs time (a) and isotope ratios vs time (b).
- Figure 4.
- Fractionation slope for LA-ICP-MS analyses was determined on the standard, by plotting raw isotope ratios vs. crater depth (a). Fractionation slope vs. crater diameter (b).
- Figure 5.(a), (b)
- Concordia diagrams and cumulative probability plots of the results obtained on the 91500 standard zircon, the CZ3 standard zircon, and the samples.
- Figure 6.
- Photomicrograph of a zircon (a) before and (b) after analysis by LA-ICP-MS. CL image of the same zircon before analysis (c) and SEM image after analysis by LA-ICP-MS (d).
- Figure 7.
- Photomicrograph of a zircon before (a) and (b) after analysis with the SHRIMP. CL image before analysis (c) and SEM image after analysis with the SHRIMP(d).
- Figure 8.
- Chondrite-normalized REE patterns of zircons from sample KB770 (a, b), KB779 (c) and KB810 (d). Normalizing values from Sun and McDonough (1989).
- Figure 9.
- Plots of morphological relationship in the zircons of sample KB770. a) CL intensity (0 = dark, 255 = light) versus Age (Ma). b) CL intensity versus the degree of discordance. c) CL intensity versus relative grains size (normalized against the average grains size in the sample) d) CL intensity versus grain shape aspect ratio (length/width ratio for complete grains) e) Th/U ratio versus CL intensity. f) Th/U ratio versus age. No clear relations can be observed that allow a distinguishment between groups on the basis of the plotted characteristics.
- Figure 10.
- Diagram showing the different types of zoning in the five zircon populations in sample KB770.
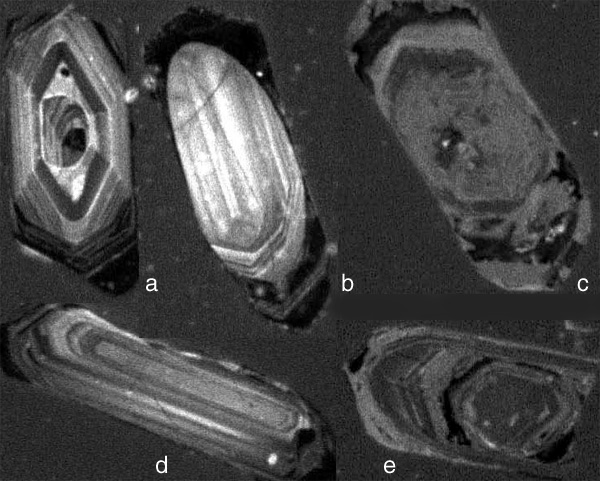
- Figure 11.
- CL images of examples of the different types of zoning in zircons in sample KB770. a) sector zoning, b) core & rim, c) metamict, d) lengthwise zoning, e) oscillatory zoning.
- Figure 12.
- Trace element correlations for zircons from sample KB770, for the 2940 Ma, 3050 Ma and 3115 Ma populations.
- Figure 13.
- (a) Expected trace element concentrations in zircons from sample KB770, that are in equilibrium with the melt, modeled on the bulk rock composition of sample KB770. b) trace element ratios found in zircons of the three populations. On this basis it is interpreted that the steepest pattern is most likely to represent the magmatic zircons. This is the ca 2940 ma population. The other populations are then xenocrysts.
- Table 1.
- Sample locations and descriptions. GPS locations in UTM, zone 50K, Australian geodetic grid 1966.
- Table 2.
- Zircon morphology.
- Table 3.
- Mean TIMS U-Pb zircon data for the 91500 zircon standard (from Wiedenbeck et al., 1995).
- Table 4.
- Mean TIMS U-Pb zircon data for the CZ3 zircon standard (from Nelson, 1997)
- Table 5.
- Summary of age results. All errors are 2s errors. n = number of analyses.