Tewari, H.C., Kumar P. 2003. Deep Seismic Sounding Studies in India and its Tectonc Implications. Journal of the Virtual Explorer, 12, 30-54.
Deep Seismic Sounding Studies In India And Its Tectonic Implications
Abstract
Deep Seismic Sounding (DSS) studies of the Indian continental crust were initiated in 1972 by the NGRI under an Indo-Soviet program. Subsequently, DSS experiments to delineate the shallow and deep structural features have been conducted in various parts of the country. Seismic refraction and wide-angle reflection data sets were acquired along more than 5000 km of profiles, including about 800 km of deep reflection profiles, in a variety of geologic and tectonic settings. Most of the studies were concentrated in the Archaean-Proterozoic peninsular shield, the southern granulitic terrain, the late Cretaceous Deccan Trap cover region of western India, across Narmada-Son lineament, the sedimentary basins of Cambay, West Bengal, Mahanadi & Godavari and the Kashmir Himalayan region. Since 1985 the data are being recorded in the digital form. The basic outcome of these studies is the determination of the velocity depth structures upto the crust-mantle boundary (Moho), in the above provinces and its imprint on the tectonics and evolution of various terrains. The amalgamation of the crustal seismic data with geologic and other geophysical data have provided new insight to a better understanding of the tectonic processes involved in the dynamics and evolution of the Indian crust.
In this paper we have focused on the results after 1992 only. The deep reflection profiling studies carried out across the Paleo-Meso-proterozoic Aravalli Delhi Fold Belt and the Archaean Bhilwara Gneissic Complex in the northwest Indian platform suggest a zone of Proterozoic collision. The Delhi Fold Belt appears to be a zone of thick (45-50 km) crust where the lower crust has doubled in width. The dynamics of the central Indian region is controlled by the east-west trending deep-seated faults systems viz. the Narmada North Fault and Narmada South Fault. Another NE-SW trending fault, the Barwani-Sukta fault, divides the upper crust in two parts, the eastern part being a basement uplift and the western a sedimentary graben under the Deccan Traps. This fault appears to be the northern limit of the Deccan Trap covered sedimentary graben. A mafic intrusion in the upper crust, represented by high velocity/density body to the east of the Barwani-Sukta fault, seems to have played significant role in shaping the present structural trends of the Narmada region. The Moho depth in the central Indian region varies between 38 and 44 km. In the West Bengal basin the crustal thickness is ~30 km. Further studies indicate the probable trace of a plume in the continental region, NNW-SSE trending path east of 87° E with an up-warp in Moho.
A four-layered crustal velocity structure, with a low velocity zone at depths of 7-15 km is seen on the north-south profile over the south Indian granulite terrain. The crustal thickness varies between 41-45 km.
Introduction
The present day configuration of continental crust is mostly an outcome of lithospheric evolution and crust-mantle interaction. To understand the mechanism of crustal evolution and its tectonic implications, it is essential to know the characteristic features of the lower crust. With this objective the Deep Seismic Sounding (DSS) studies were started in India in the year 1972, as an Indo-Soviet collaboration project for three years. Under this project, and later on independently by the National Geophysical Research Institute, Hyderabad, India, a number of geological and tectonic provinces have been covered by these studies.
DSS studies by controlled source seismic observations constitute the most definitive geophysical technique for exploring the structure of the Earth’s crust and uppermost mantle. Both shallow and deep structures can be resolved by suitable data sets, including narrow-and wide-angle reflection and refraction phases. Recent advances, both in the areas of seimsic data acquisition as well as processing and modeling techniques, offer wide-ranging possibilities to explore complex subsurface structures that may be both heterogeneous and anisotropic. It has been realized in recent times that coincident reflection/refraction experiments on selected geo-transects provide the most reliable seismic images of the deep crust and uppermost mantle as the two techniques are complementary to each other, together resolving the structural and physical property variations. The deep seismic images of the continental crust, revealed by coincident reflection/refraction profiling across various geological settings, provide necessary clues for understanding the complex geodynamic processes that might be operative during geological evolution. In tectonically active regions accurate mapping of the intra-crustal boundaries, including the crust-mantle boundary (Moho), and delineation of deep penetrating steep/low angle crustal faults/fracture zones reveal various blocks that may have been relatively displaced due to movements along these faults. Further, the DSS data sets, especially in the wide-angle range, provide viable models of the velocity distribution required to infer the petrological composition, grade of metamorphism and material properties such as brittle/ductile regimes. These may lead to consistent interpretations of reflectivity structures observed by vertical-incidence reflection data at deep crustal depths.
Seismic refraction and wide-angle reflection data sets have been acquired in different geological and tectonic provinces in Himalaya, Aravalli-Delhi Fold Belt, Narmada–Son Lineament, Southern peninsular shield, Southern Granulite Provinces and Cambay, West Bengal, Mahanadi, Godavari basins. Interpretation of the DSS data along various profiles has brought out the crustal structure and the Moho configuration, leading to a better understanding of the evolutionary processes involved in the formation of the terrain. A review of the studies carried out under the DSS program was done by Kaila and Krishna, (1992). Since then a lot of new studies, including deep reflection profiling, have been added and some of the older data sets have been reinterpreted to extract more information through the use of dynamic forward modeling and inversion programs. In this review we will only restrict ourselves to those studies, which have not been covered by Kaila and Krishna (1992) and also the reinterpretation of some data sets, which provide newer insights.
DSS Results in the Central Indian Region
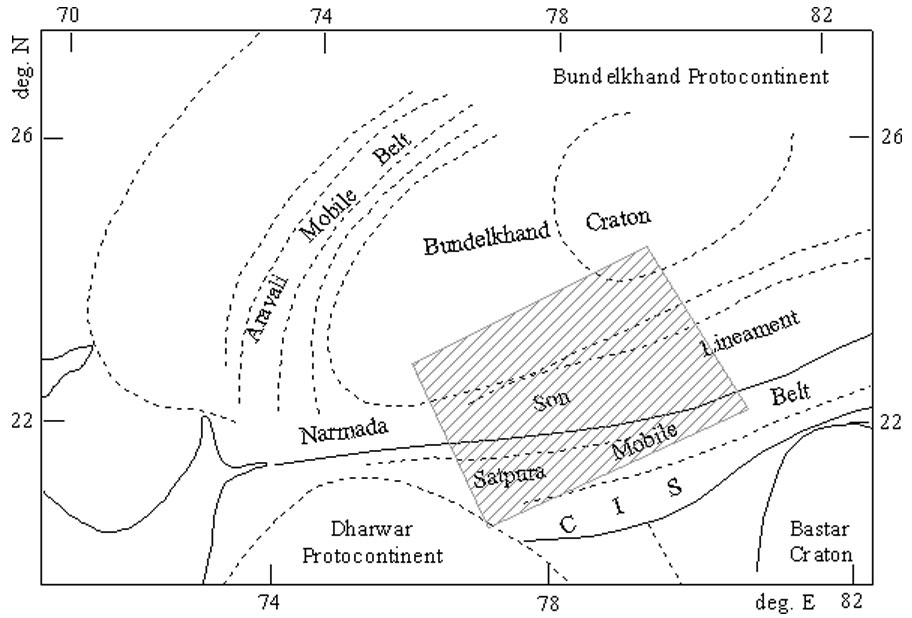
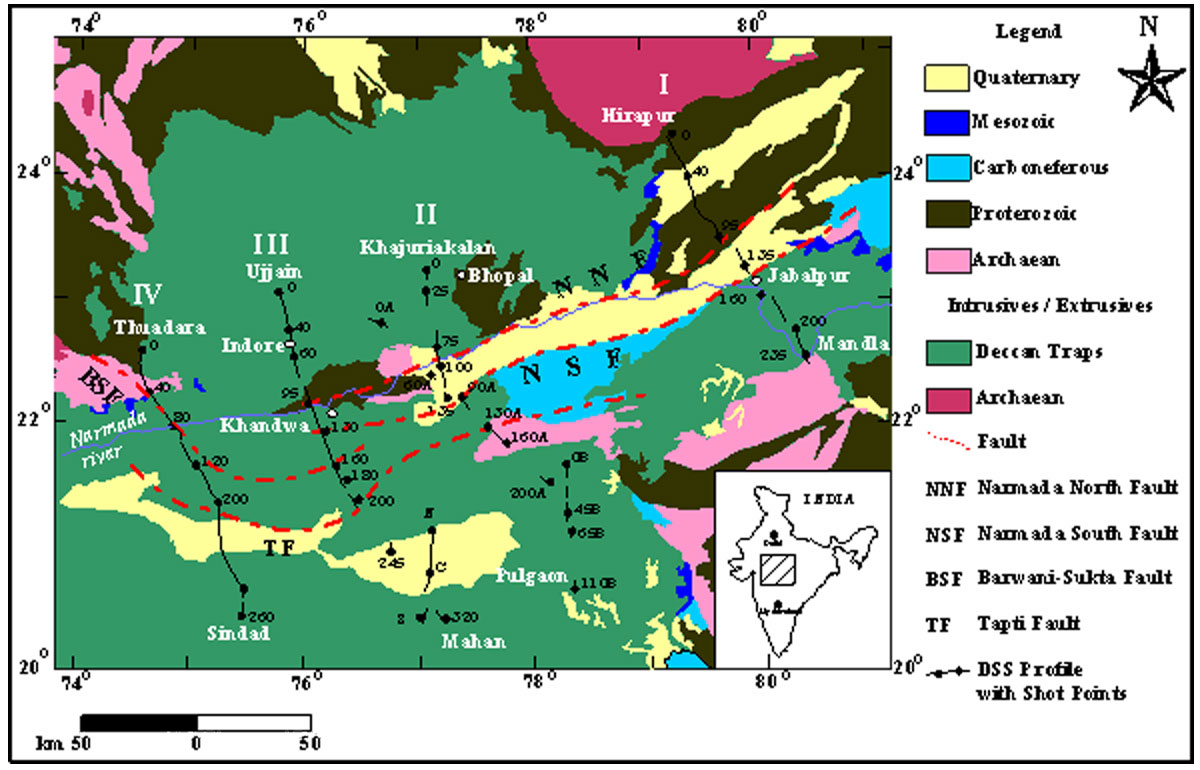
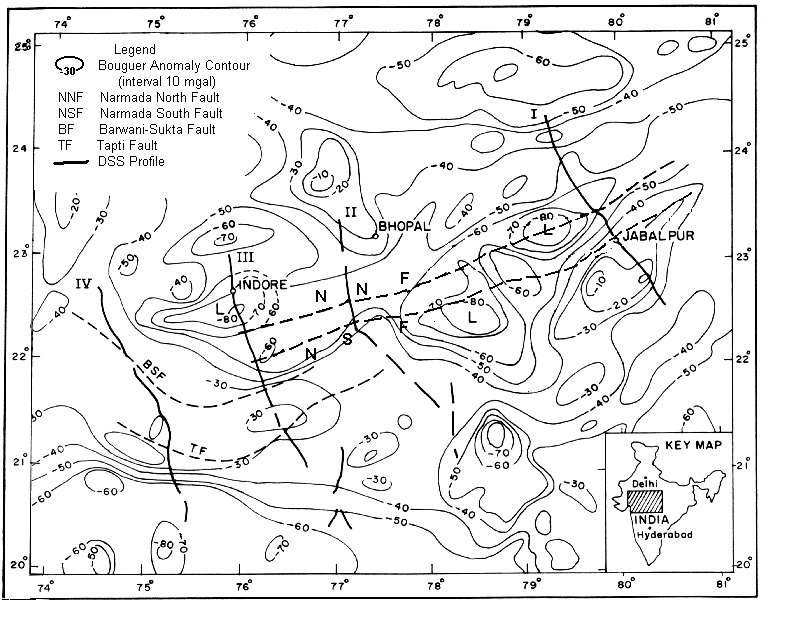
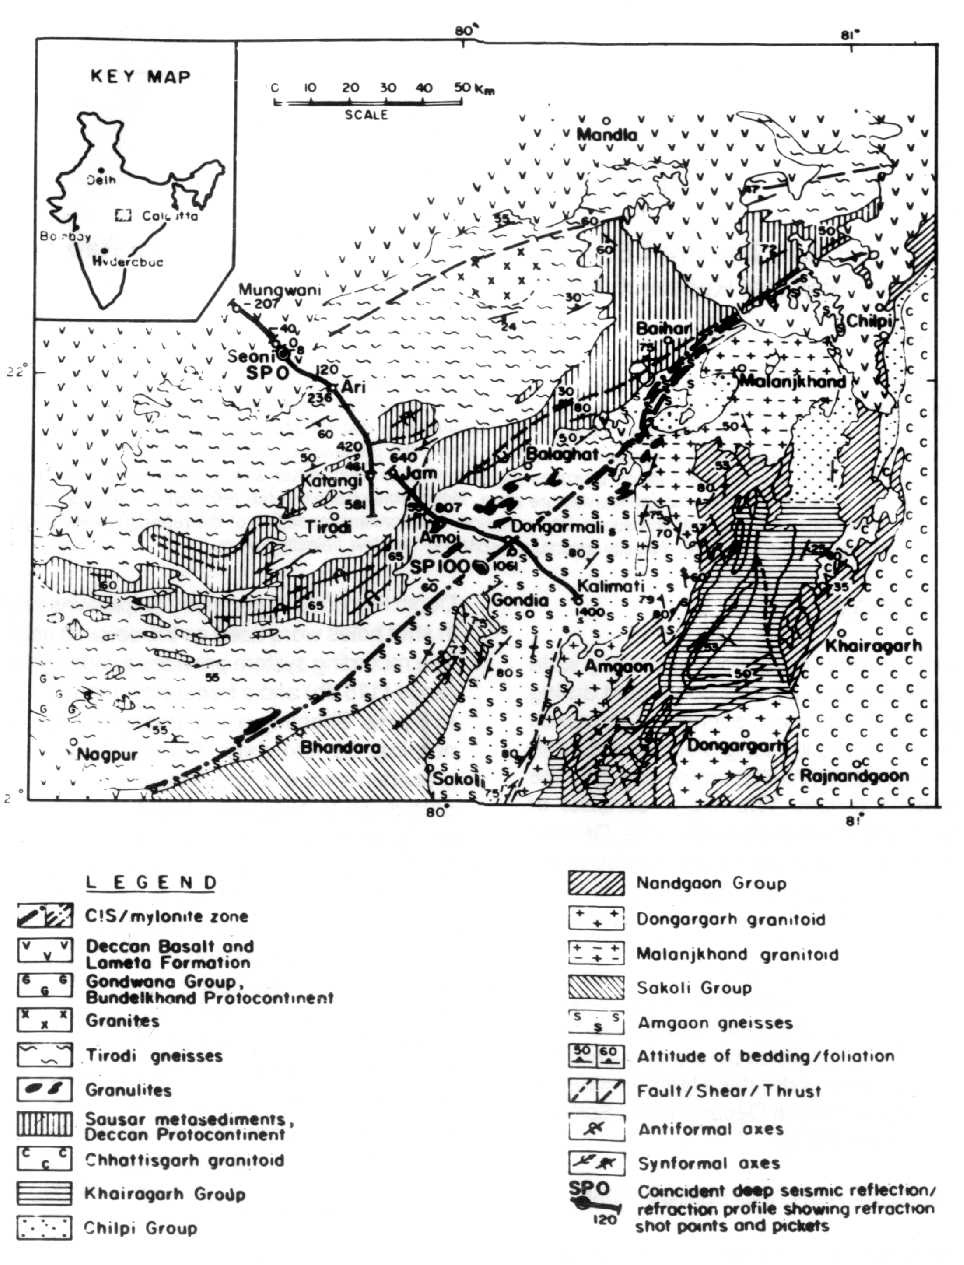
The central part of the Indian sub-continent (between 20° N to 24° N and 70° E to 82° E) consists of several important geologic and tectonic features, the main among them being the east-west trending Narmada-Son lineament (NSL) and the Central Indian Suture (CIS). The Narmada-Tapti region is dissected by a series of E-W/ENE-WSW trending faults. The faulting is generally of step type without any tilt of the blocks and with successive down throw towards south of the Narmada River. Major tectonic elements of the Narmada region are shown in figure 1 and the geological map of the region in the figure 2.
The Narmada Region
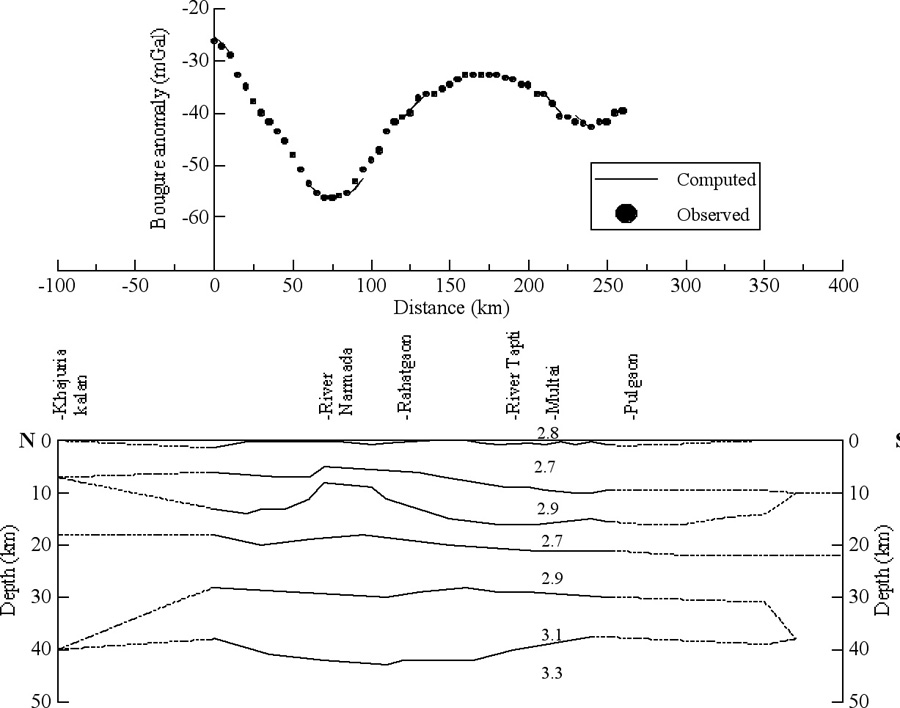
The revised seismic model of the Narmada region was obtained after re-interpreting the data along the four existing profiles of the region. New data along a profile across the CIS has been added to it. The basement and crustal configuration in the Narmada zone, based upon the wide-angle recording, and across the CIS based upon deep reflection studies, are described separately. The reinterpreted seismic sections along the various profiles and their gravity interpretations are shown in figures 3, 4, 5, 6, 7, 8, 9, and 10.
The Narmada Zone
Based on these results the Narmada zone can be divided in two parts. While a sedimentary graben under the Deccan Traps is revealed to the west of Barwan-Sukta fault, the eastern part is a basement uplift between the rivers Narmada and Tapti.
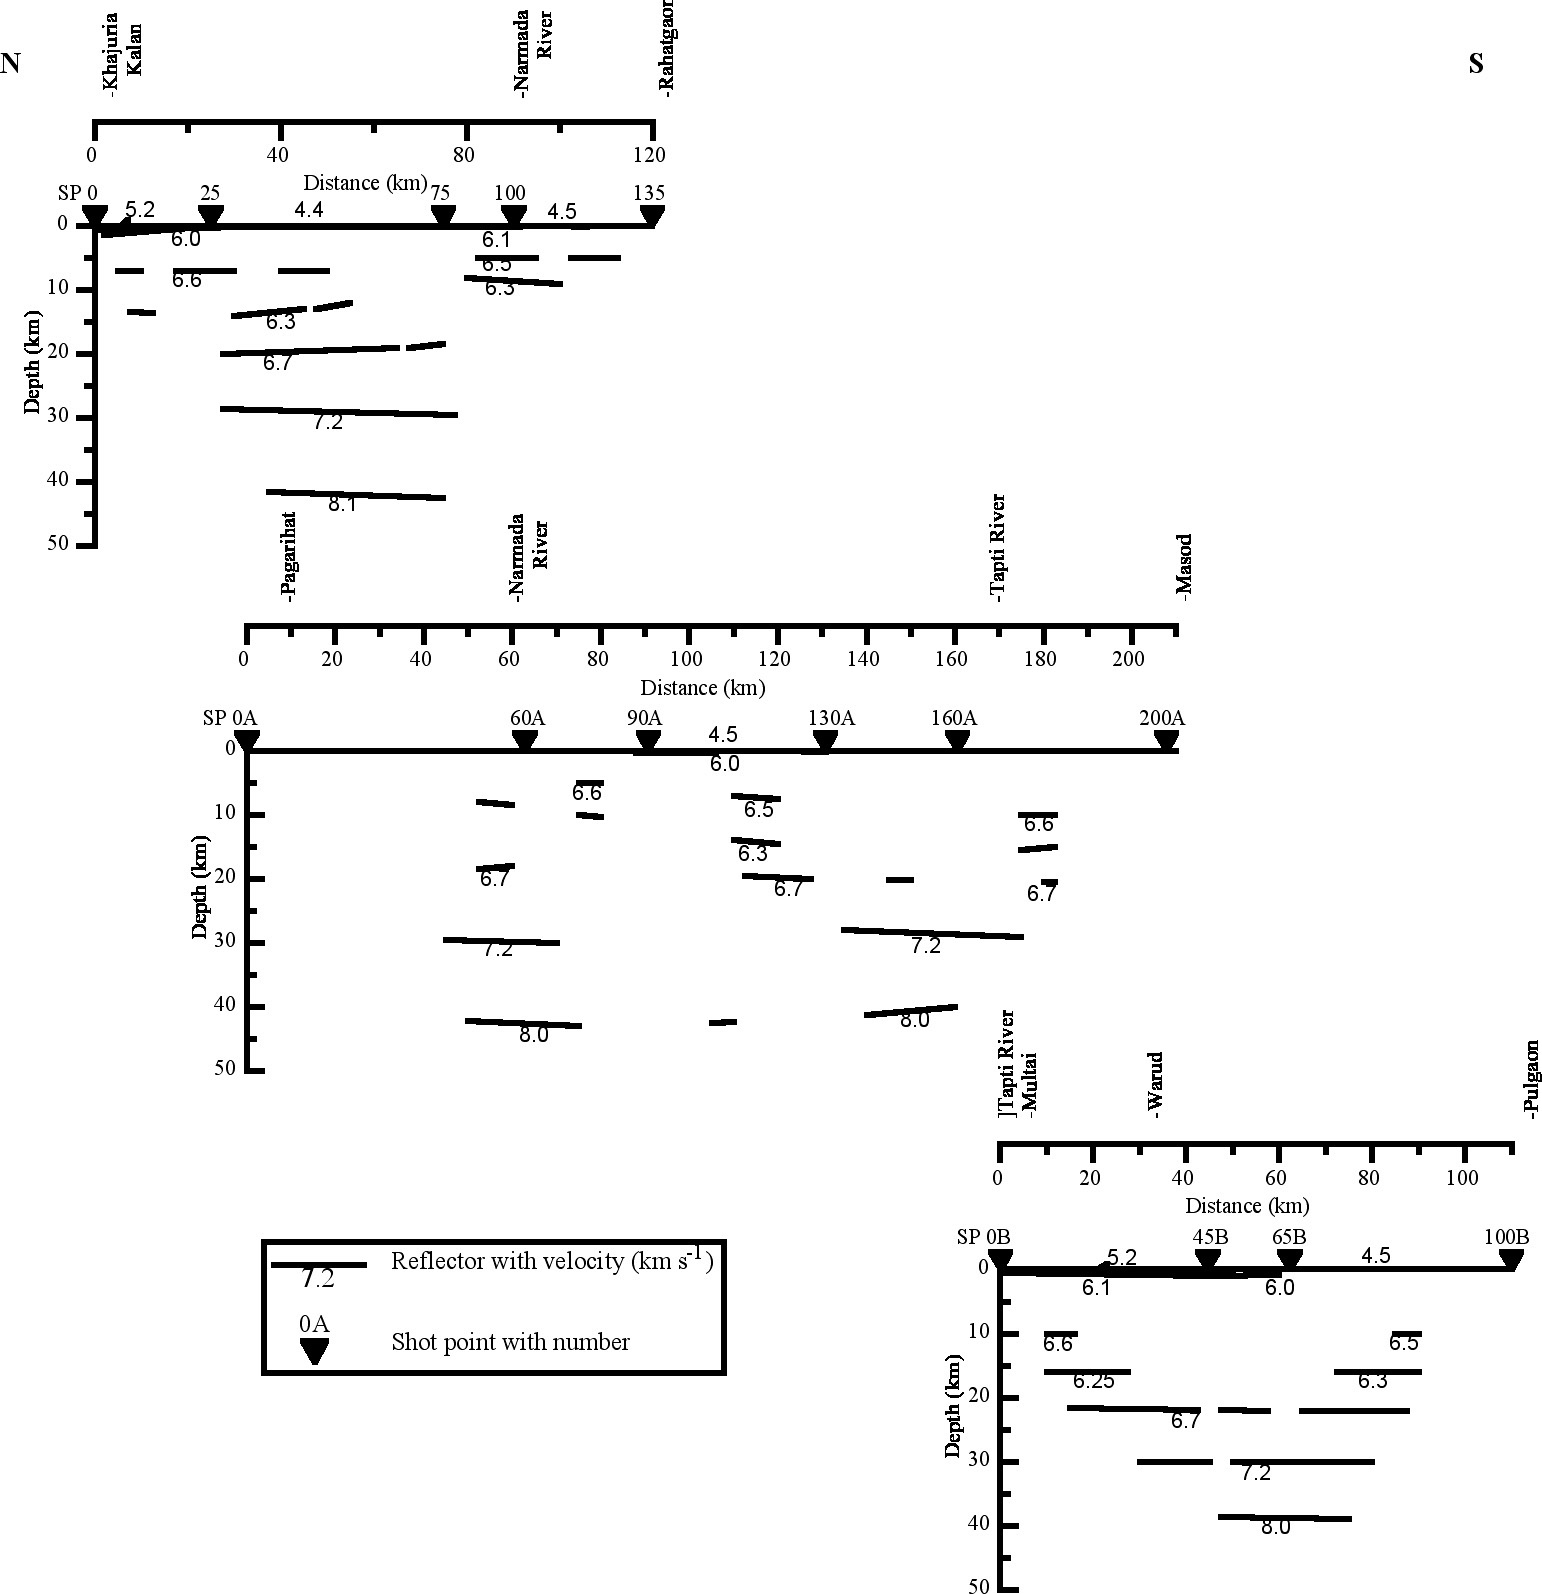
In the eastern part the granitic basement configuration is quite simple. The exposures mostly consist of the Deccan Trap volcanics with a maximum thickness of about 800 m. The top layer of 3.5 km s-1 on Profile II and 3.2 km s-1 on Profile III belongs to the Recent /Tertiary sediments of the Tapti River. Since the seismic data were acquired for delineating the crustal structure, they do not provide any evidence of Vindhyan/Mesozoic/Gondwana sediments occurring under the traps. Between SP 0 and SP 40, on Profile-III, the basement is at about 500 m depth. Nayak et al. (1986), based on gravity and magnetic studies have shown that the Vindhyan sediments at a depth of about 500 m, followed by the Archaean, form the basement to the Deccan Trap in this region. In such a case the basement velocity represented by seismic studies (6.0 km s-1) should correspond to the Vindhyan sediments. This is, however, close to the recorded velocity in Archaean and much higher than the velocity (5.4 km s-1) recorded in Vindhyan exposures in nearby regions. It is, therefore, not possible to agree with the contention of Nayak et al. (1986) regarding the occurrence of Vindhyan sediments in this part of the profile. The indication of an increase in basement depth to about 1000 m to the north of SP 60 may indicate the presence of Vindhyan sediments under the Deccan Trap.
South of SP 160 the basement depth is about 2500 m near SP N. The layer with velocity of 4.4-4.5 km s-1 shows a maximum thickness of about 1000 m under which another layer of 5.2 km s-1 velocity exists. This layer is south of the Narmada zone, where the presence of Vindhyan sediments is ruled out on geological considerations. Whether this layer belongs to the Deccan Trap or Proterozoic sediments or any other formation cannot be confirmed at present, as no geologic data are available at these depths. It is possible that this layer represents another flow of the Deccan Trap with a higher velocity, as at least 48 flows have been identified in the traps (Auden, 1949). Proterozoic exposures of similar velocity are also abundant in the Narmada region. Since the region under consideration is about 800 km away from the main source of Deccan Trap eruption, near the West Coast of India, the likelihood of the Deccan Trap being about 2000-2500 m thick is rather low. Various drill holes in the Deccan Trap covered regions of Central India indicate its thickness to be less than 600 m. However, magneto-telluric studies (Rao et al., 1995), a little to the east of Profile III between SP135 and SP C, have shown two distinct layers of Deccan Trap with the total thickness varying between 300-1000 m on the flanks and about 2000 m in the center and also the presence of 300-2000 m thick Gondwana sediments below the traps. If these results are matched with our interpretation, then both the 4.4-4.5 and 5.2 km s-1 velocity layers would belong to the Deccan Traps, and the Gondwana sediments can be expected to occur either as intra-trappean or below the traps. The gravity model of Profile III however, does indicate the presence of low-density layers (probably Gondwana) in this part.
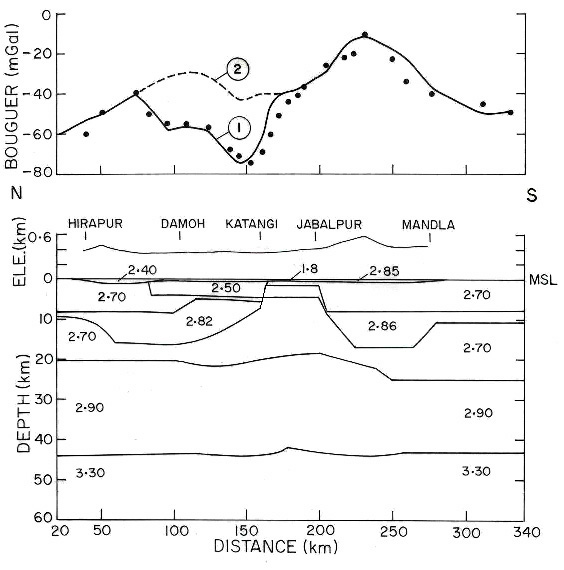
Murty et al. (1998) show shallow basement (~300 m) between the NNF and NSF along Profile I. Outside this region the basement depth increases. Kaila et al. (1987) indicated that the basement along Profile-I forms a horst in the Narmada zone, and has played a key role in the formation of the Vindhyan basin to the north. All these results indicate that at present the Narmada zone, to the east of BSF, is a region of shallow basement.
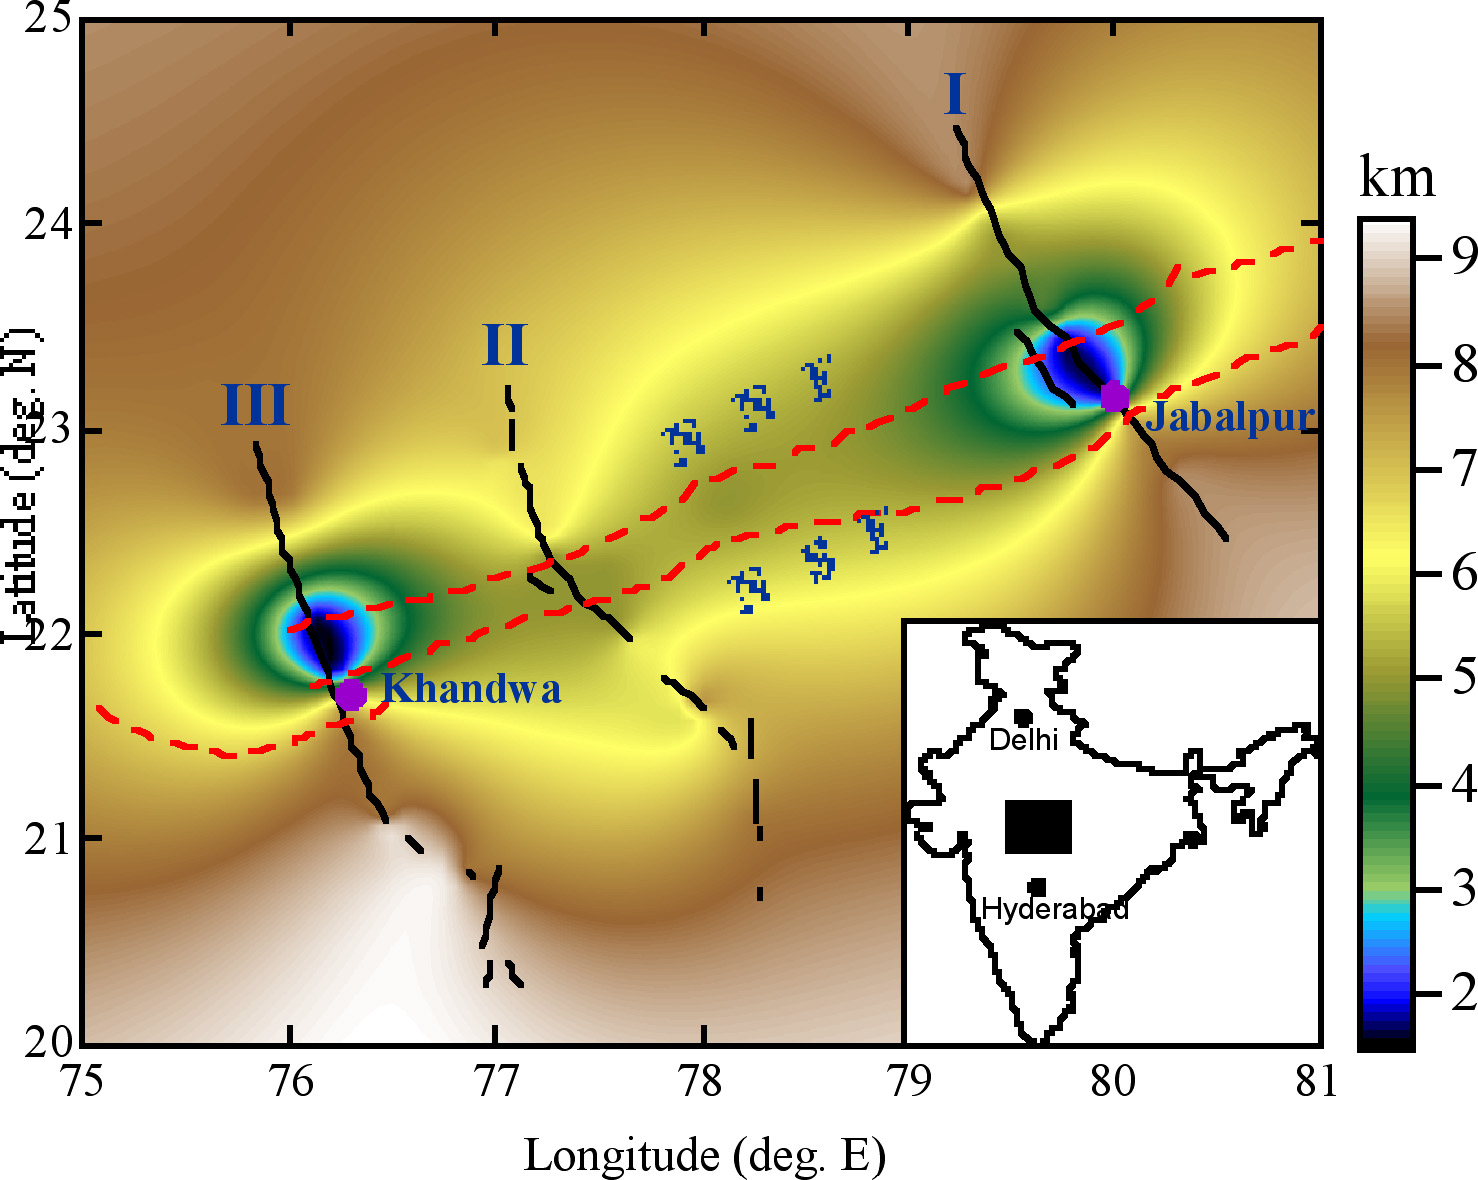
Based on the results discussed above and geological considerations a contour map (Figure 11) is drawn for the depth to the basement. The larger basement depth in the central part of Profile I indicates the presence of a Vindhyan basin. The other notable feature is to the south of Khandwa where the maximum depth up to the basement is ~2500 m.
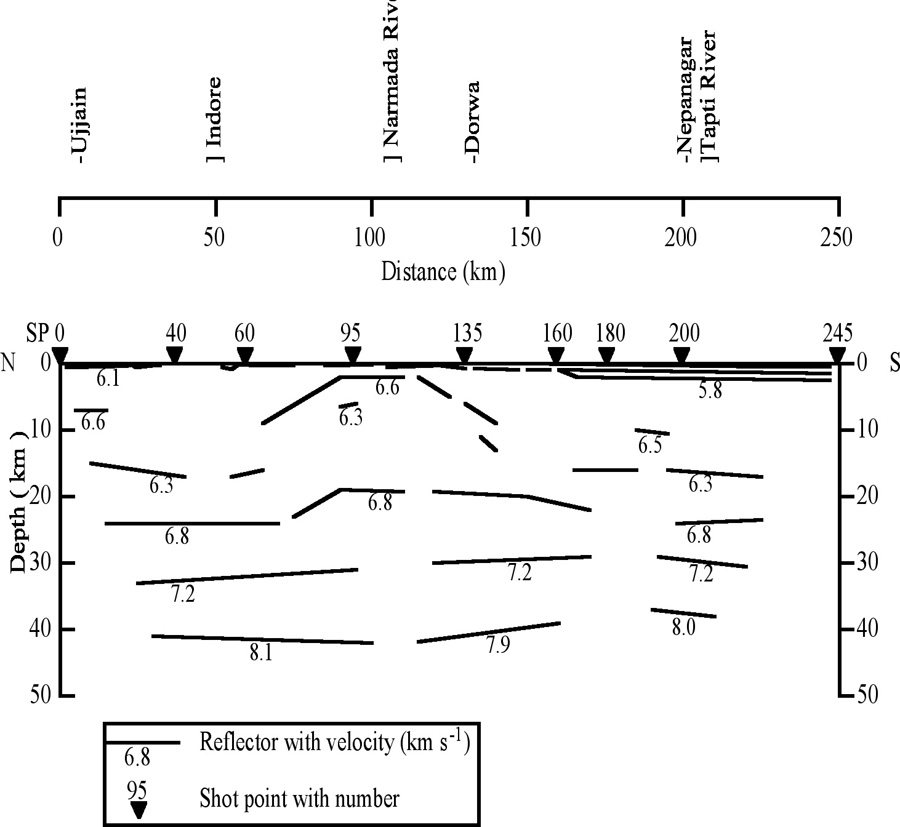
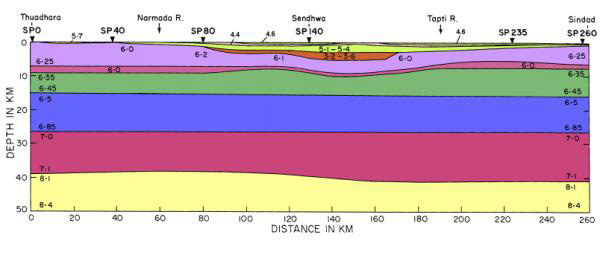
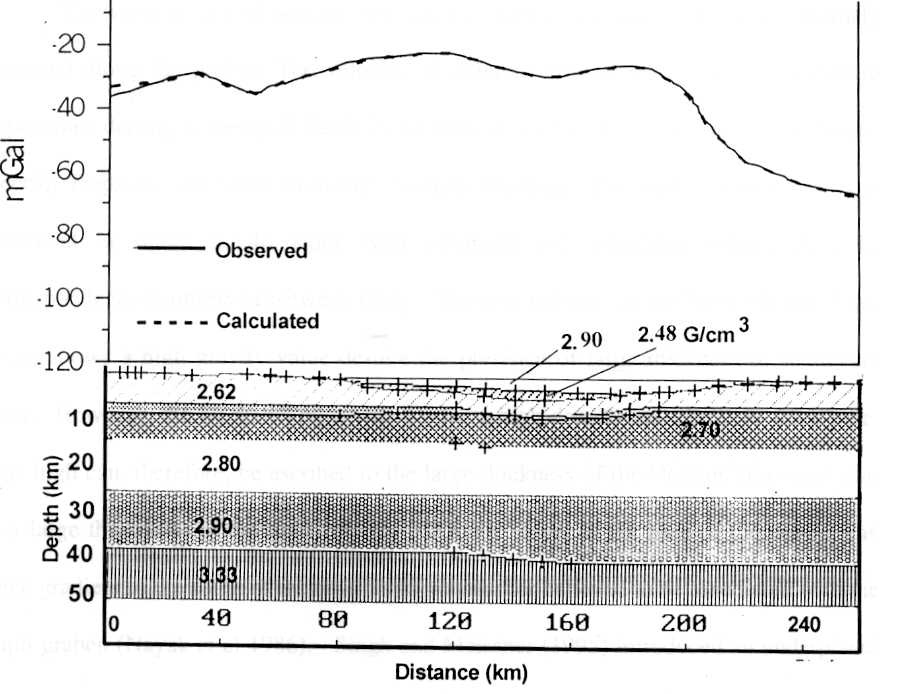
The results along Profile IV (Sridhar and Tewari, 2001) however, reveal a sedimentary graben between rivers Narmada and Tapti. Within the graben the depth to the basement (P- wave velocity 5.9-6.2 km s-1) is about 3000 m between the Narmada River and Sendhwa and 5000-5500 m between Sendhwa and river Tapti (Figure 9). This graben contains 1000-2800 m thick low velocity (Velocity 3.2-3.6 km s-1) sediments under a thick (max ~2500 m) cover of the Deccan Traps. The graben is bounded the Barwani-Sukta and Tapti faults. The velocity in the Deccan Traps varies between 4.0 and 5.0 km s-1 while that in its basement is in the range of 6.0-6.2 km s-1. The crustal structure is more or less similar to the other profiles in the region except that the high velocity upper crustal layer is not seen here. A high velocity (7.0 km s-1) under plated layer exists at a depth of about 27 km. The Moho depth varies between 38 and 42 km (Figure 9). The NE-SW trending Barwani-Sukta fault appears to be the northern limit of a Deccan Trap covered sedimentary graben. The possibility of sediment occurrence under the Deccan Traps on the southern parts of profile III and profile II, and the results of geo-electric survey in the near by regions (Mishra, 1992), suggest that the sedimentary basin may extend to south-east.
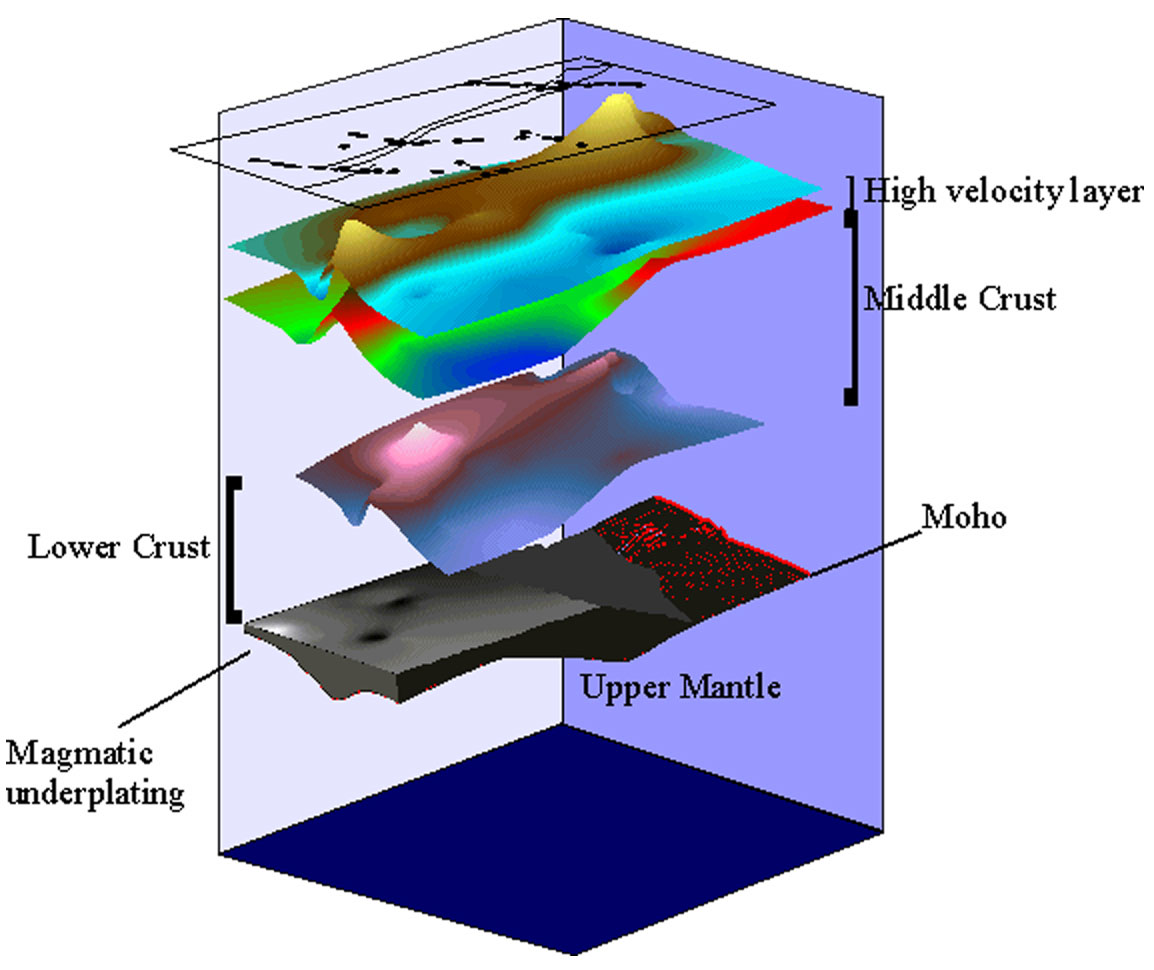
The 2-D crustal seismic velocity and gravity models along profiles I, II, III and IV (Prakash Kumar et al., 2000; Sridhar and Tewari, 2001) indicating that the Narmada North and South faults, to the east of Barwani-Sukta fault, divide the upper crust in such a way that a horst-graben structure is evident. The contour map (Figure 12) depicting the top of the upper crustal high velocity layer shows that the Narmada horst exists in large parts of this region. The upwelling in the Narmada zone indicates that both the Narmada faults have deeper origins, involving deep-seated tectonics.
The mafic intrusion in the upper crust, represented by the high velocity/density body to the east of the Barwani-Sukta fault, seems to be an important element in shaping the present structural trends of the Narmada region. According to Mishra (1992), the mid continental gravity high in central India is similar to mid continental gravity high of USA, which is caused by basaltic intrusions of high density. However, what appears to be important is not the gravity high but the gravity low axis (Figure 13). This axis appears to correspond to the zone of Narmada uplift, which would normally have given rise to gravity high. In the present case the thickness of the high-density body is least at the uplift, which creates the gravity low. This axis divides the region in two distinct parts, north and south of the Narmada zone. The upwelling appears to be related to deep-seated tectonics. Several workers share this belief. Agarwal et al. (1995) believe that the Moho up warp found under the Arravalis, the Satpuras and the Narmada Son lineament is related to vertical mass transfer, from upper mantle, in to the crust during the late Archaean to Paleoproterozoic period.
Ghosh (1975) too observed a domal up warp in this region. Based on the satellite magnetic data (MAGSAT), Mishra (1992) suggests a thick crust to the south of the Narmada-Son lineament, encompassing the entire region of the Tapti basin and the Gondwana rift valleys, suggesting basic rocks. He feels that the presence of linear and extensive basic intrusives in the crust is due to some deep-seated phenomena such as asthenospheric upwelling related to a mantle plume or hot spot trace and this activity appears to have been transmitted in time from central India to the east coast, providing the necessary thermo-mechanical framework for the separation of India from the Gondwanaland during the late Jurassic or the early Cretaceous. Venkat Rao et al. (1990) indicate a rise in Moho level followed by rifting/replacement of the shallow crust by emplacement of mantle-derived rocks at shallow crustal levels. Shivaji and Agarwal (1995) consider the Moho configuration along this zone as highly disturbed due to intense crustal movements and suggest that the southern and northern Narmada faults might have acted as fissure zones through which molten magma has erupted and emplaced on either side of the Narmada zone. Singh and Meissner (1995), while analyzing the upper crustal configuration of the Narmada-Tapti region from gravity studies, suggested that the Deccan flood basalt eruptions were associated with a huge magmatic intrusion at the base of the crust.
Earlier workers have interpreted the gravity high to the north of NSL as due to underlying intrusives/volcanics, which form a part of Bijawar formation (Ghosh, 1975). The Bijawars are composed of volcanic material that could have solidified within the upper crustal layer before emerging fully on to the surface. However, our interpretation suggests the presence of a high velocity/high density body, similar to that in the southern part below the Archaean basement. Due to lower density of the Vindhyan sediments (~2.50 gm cm-3) as compared to the basement (~2.70 gm cm-3), the gravity high in the Vindhyan region is not as prominent as the southern gravity high. The emplacement of the high velocity/density mafic body (supracrustal amphibolite/granulite enclaves) within the gneissic rock probably took place during the cratonization of the crust at the Archaean period in large parts of central India.
Acharya et al. (1998) are of the view that no major reactivation of north fault has taken place in the post Vindhyan period. Their views, combined with the fact of smaller thickness of the intrusive body between the Narmada faults as compared to those beyond the Narmada faults and the upper crustal uplift indicate that the post intrusion activity on the two sides of Narmada zone are independent. This means that the two Narmada faults may have been active at different geological times. Jain et al. (1995) reported that the initiation of the Narmada north faults must have been at a period not later than the late Archaean. It can, therefore, be conjectured that major magmatic activity accrued during the Proterozoic. The activity along the south fault might have started again during or after the breakup of Gondwana land. Whether the north fault was also active at that time is not clear, as there is no geological evidence for its activation at that time. What is, however, true is that the south fault is still active as is evidenced by occasional seismic activity along this fault. The Narmada uplift is obviously older than the activity along the south fault as indicated by smaller thickness of the intrusive layer here. A cartoon showing the development of the present day crustal configuration of the region is given in figure 14.
Deep Reflection Studies Across The CIS
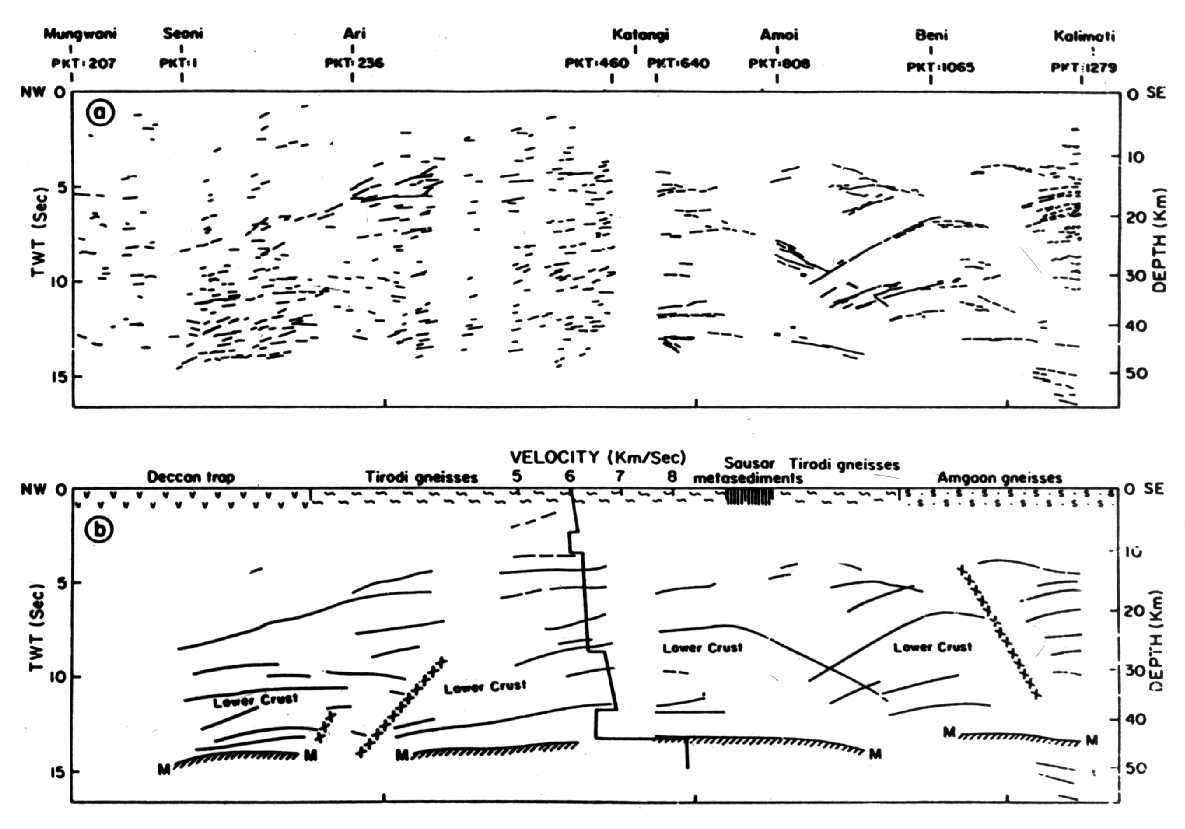
To study the seismic nature of the CIS a deep reflection profile was run from Seoni to Kalimati. The section is ~150 km long and passes mainly through the Deccan Traps and gneisses (Figure 15). The analysis of this section crossing the central Indian Suture (Reddy et al., 1995; 2000) indicates a distinct reflectivity pattern (Figure 16). The reflector lengths appear to be short and dense, especially at mid-crustal level.
According to Reddy et al. (2000) the reflectivity is very good from 5 s TWT down to 14 s TWT. The level at about 14 s TWT (~42-44 km depth), where the crustal reflectivity terminates, represents the crust-mantle boundary. The crustal roots are well defined. Unlike the recent orogenic belts, the crustal roots under the older belts are generally missing (Meissner et al., 1987) and the Moho is rather flat as it is likely to be equilibrated in a period of post orogenic extension (Meissner, 1989). In very few of the older belts, like in the Baltic shield (BABEL Working Group, 1990), the crustal root is as clearly defined as in the Central Indian peninsular shield. It is not clear how these two shields are maintaining their crustal roots.
Structural trends in the upper crust are broad and dip gently. These trends continue in the lower crust as well. Reddy et al. (2000) interpret a well-developed fracture zone, that offsets the Moho boundary, as the locus of either a subduction zone of oceanic crust or under thrusting of the continental crust in the collision zone. The Moho offset and the reflectivity pattern of two adjacent domains, each characterized by dips towards the other, generally mark a tectonically imbricated crust on the opposite sides of the suture zone. Similar crustal reflectivity pattern is chaacteistic of many Phanerozoic, (Alps; Heitzmann et al., 1991), Palaeozoic (Appalachian; Hall and Quinlan, 1994) and Proterozoic. (BABEL Working Group, 1990) orogens. In all these cases, the bivergent reflectivity pattern appears to mark the two sides of the suture zone.
Reddy et al. (1995) interpret that the two adjacent crustal domains represent different tectonic blocks or protocontinents. These segments are involved in the development of the Indian peninsula (Jain et al., 1991; Radhakrishna and Naqvi, 1986). The southeast dipping reflection sements are contained in the Bundelkhand protocontinent, while the northwest dipping reflection segments represent the Deccan protocontinent. Therefore, the area under discussion is probably related to a zone of continental collision-the suture developing during the Proterozoic. The CIS itself could not be imaged and therefore it can be interpreted as having a near vertical orientation.
Deep Reflection Studies in Aravalli-Delhi Fold Belt
The Aravalli Delhi Fold Belt, situated in the northwestern part of the Indian Shield, is a northeast southwest-trending 700 km long mountain chain consisting of intensively folded, deformed and metamorphosed Proterozoic rocks deposited over the Archaean gneissic basement. Deep seismic reflection studies were carried out, for the first time over the Indian Shield, along a 400 km long profile (Figure 17), across this fold belt, to delineate the crustal and tectonic evolution of the region. The profile starts from Nagaur (Shot Point 1) in the Neoproterozoic Marwar Basin to the northwest and traverses the Paleo-Mesoproterozoic Arawalli Delhi fold belts, the Archaean Sandmata Complex, the Archaean-Proterozoic Mangalwar Complex, the Hindoli Group and terminates in the Meso-Neoproterozoic Vindhyan Basin in the southeast.
The Arawalli Delhi Fold Belt in one of the major Proterozoic orogenic belts of the world. Seismic data acquisition, processing and certain aspects of interpretation were discussed in various papers (Tewari et al., 1995; Reddy et al., 1995; Tewari et al., 1997). The study by Vijay Rao et al. (2000) has brought out the comprehensive detail of the evolution of the area. The NW Indian Shield contains the geological history from Archaean to Neoproterozoic. Its lithostratigraphy is mostly due to Heron (1953). The 3.3 Ga old Bhilwara Gneissic Complex (Gopalan et al., 1990) represents the oldest cratonic nucleus of the region and has been reclassified in to the Sandmata and the Mangalwar Complexes (Sinha Roy et al., 1995). The Arawalli and Delhi sediments were deposited successively, over this Archaean basement with clear unconformities. The region has witnessed four major regional tectono-magmatic and metamorphic events with ages ~3000 Ma (Bhilwara Gneissic Complex), ~1800 Ma (Arawalli Orogeny), ~1100 Ma (Delhi Orogeny) and 850-750 Ma (post-Delhi magmatic event).
The Delhi Fold Belt consists of highly folded deformed rocks exhibiting polyphase metamorphisim, comprising deep-water to platformal sediments. The profuse basic volcanics and tectonised mafic/ultramafic rocks of this belt are named as the Phulad ophilite (Gupta et al., 1980; Singha Roy and Mahonty, 1988). Bhattacharya and Mukherjee (1984) suggest that the pillowed basalts are tholeiites developed near a trench in an island arc system. Sinha Roy and Mahonty (1988) reported similar ophiolitic melange, of contrasting ensialic rift and arc-trench sequence, further south of the study area. They identified relict blueschist assemblages in the ophiolite melange. The Pb model age of Delhi rocks of the area has been constrained to ~1100 Ma (Deb et al., 1989).
The Sandmata Complex comprises granulite facies rocks, which were formed at temperatures of 650 - 8500 C and pressures 8-11 kbar (Sharma, 1988). U-Pb zircon dating of these granulites yielded an age of 1730 Ma (Sarkar et al., 1989). They occur as isolated bodies, tectonically emplaced along the margin of ductile shear zone. The Mangalwar Complex with metavolcanics and metasediments is regarded as an older granite-greenstone belt (Sinha Roy, 1988), with amphibolite facies metamorphism. The metavolcanics of the region resemble low-K tholeiitic to calkaline basalts, suggesting their origin from mantle sources Sugden et al., 1990). The age of Mangalwar Complex, viz. Sawar, Banera and Dariba rocks are dated ~1800 Ma (Deb et al., 1989). Heron (1953), Sharma (1988) and Sinha Roy (1988) also consider it as equivalent to Paleoproterozoic Arawallies.
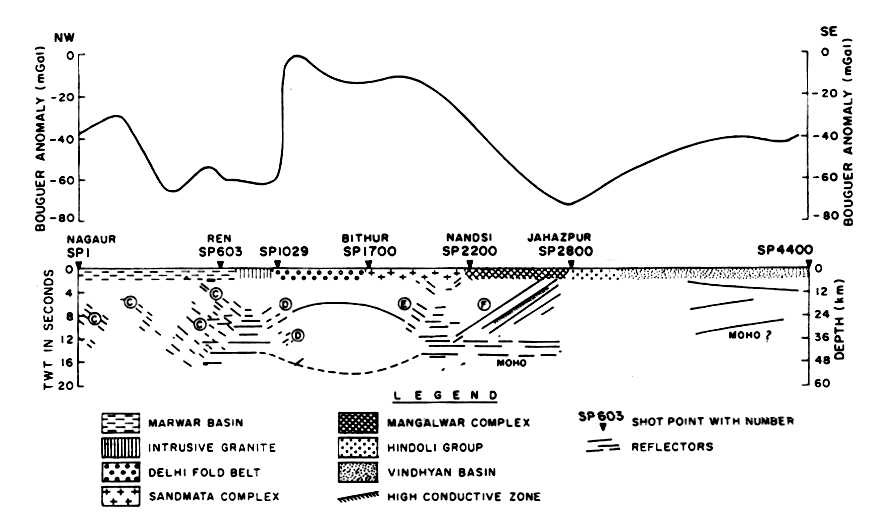
Deep seismic reflection studies along the 400 km long profile generated a migrated stacked section of the data (Vijay Rao et al., 2000) up to 18 sec two way time (Figure 18) that shows the variations in crustal reflectivity patterns. These were used to interpret the tectonics of the region. The upper crust is poorly reflective except for a few horizontal and dipping reflections, whereas, the lower crustal reflectivity varies considerably all along the profile.
Changes in reflectivity pattern (dip direction) appear to demarcate the boundaries between Marwar Basin-Delhi Fold Belt and Sandmata-Mangalwar Complexes. The data reveal steeply dipping reflections (Figure 18) at various crustal depths cutting across subhorizontal reflections. The Moho has been identified at the base of reflection bands between 12.5 and 15 s and at a depth of 46 km under Mangalwar Complex. It is inferred (Vijay Raoet al., 2000) at a depth of ~50 km for the Delhi Fold Belt and Sandmata Complex region by 2-D gravity modeling (Tewari et al., 1997). A highly reflective crustal scale thrust fault (Jahazpur thrust), originating from the Moho to a depth of 5 km near Jahazpur is a major feature. It is a 25 km thick pile of parallel dipping reflections with 80 km of lateral extension. A divergent reflectivity pattern is seen at the Sandmata-Mangalwar Complex boundary. The seismic sections show a complex domal shaped lower-crustal reflector from 10s twt to 6s twt below the Delhi Fold Belt and Sandmata Complex. A high velocity of 7.3 km s-1 is assigned to this domal feature (Tewari et al., 1997). This feature is assigned a density of 3.1 gm cm-3. The interpreted depth section is shown in figure 19.
A line diagram, based on the migrated section, showing the main reflecting horizons along the profile is shown in figure 20.
The ramp and flat geometry of the Jahazpur thrust indicates that it has developed in a compressional environment, as compressional faults (thrust) show similar structures, whereas, extensional faults exhibit a listric geometry. The nature and dimensions of this thrust (Figure 20) indicate that thick skinned tectonics were responsible for its development. The lower crust is generally ductile in nature and therefore the existence of faults at that depth is rare. However, faults can survive in the lower crust of subduction/suture zones due to different environments and strain hardening processes that act at these places (Meissner, 1996).
The Jahazpur thrust appears to be a major crustal boundary with great tectonic significance in the evolution of the region. It demarcates two contrasting tectonic domains, the greenshist facies of the Hindoli Group and the amphibolite facies of the Mangalwar Complex. The geochemical signatures (Sugden et al., 1990; Deb et al., 1989) suggest the presence of an ocean in the region, which separated the eastern Bundelkhand craton (crustal block east of Bhilwara Gneissic Complex) from the western Marwar craton (Figure 21). The compressional forces that developed in the region moved the eastern craton westwards. The intervening oceanic crust along with the sediments (Sinha Roy, 1988; Sugde et al., 1990) was subducted under the western craton. Wrenching parallel to the fault accommodated further convergence creating an imbricated fault zone (Jahazpur thrust,). Most of the subduction zones and orogenic boundaries are highly reflective and conductive. Base metal mineralization observed at the surface location of the thrust fault may be due to this subduction-related activity as large-scale metallogenic provinces, world over, are associated with subduction zones.
Further convergence of the two crustal blocks steepened the subduction and resulted in the development of an island arc evidenced by the presence of theoleiitic and cal-alkaline nature of the metabasalts. In the next stage of convergence, collision between the two cratons resulted in the Arawalli orogeny (Figure 21b). The opposite dipping reflection fabric, regarded as a collision signature (BABEL Working Group, 1990; Lucas et al., 1993; Rajendra Prasad et al., 1998) is observed near SP 2200. These bivergent reflections (E and F of Figure 20) characterize different crustal blocks on either side of the terrain boundary. The collision process resulted in crustal shortening and thickening. As the collision continued, the initial thrust steepened and the colliding blocks got effectively locked. This led to the development of Aravalli suture between the two cratons, viz. the Bundelkhand craton to the east and the Marwar craton to the west. Such a suturing at the subduction zone has been observed in many ancient collision boundaries of stable, colder Precambrian regions and electrically conductive zones (Hyndman, 1988; Mooney and Meissner, 1991; BABEL Working Group, 1993).
A thickened crust in a subduction/collision zone provides an ideal pressure, temperature regime for the generation of granulites. The carbonic fluids released from the sediments of a subduction slab also help in their formation. The Sandmata granulites, generated under such an environment, were thrusted up due to collision and are emplaced as tectonic wedges within the basement gneisses (Sinha Roy et al., 1995). They occur as imbricate zones between various rocks and are represented by an E-reflection band in the seismic section (Figure 20). The P-T regime of the granulites of this region suggests that they are the products of volcanic arc environment (Sarkar et al., 1989). The 1730 Ma age of these granulites is in agreement with the Pb model age of ~1800 Ma (Deb et al., 1989) for the Aravaili orogeny. Bohlen (1987) feels that continental collision is the main mechanism for the generation of many granulite grade metamorphic belts. He further suggests that the volcanic arc environments have characteristics appropriate for generation of granulites.
The presence of bimodal volcanism (Bhattacharje et al., 1988; Deb et al., 1995) in the Delhi Fold Belt region suggested that subsequent to the evolution of the Paleoproterozoic Aravalli orogeny, the region underwent another episode of rifting during the Mesoproterozoic period. The rifting process separated the Bhilwara Gneissic Complex (BGC) as a rift fragment from the Marwar craton. This also opened an ocean (Bhattacharya and Mukherjee, 1984), with the Bundelkhand-Aravaili-BGC craton to the east and the Marwar craton to the west (Figure 21). The Delhi sediments were deposited on the basin thus created. Following compressional phase led to eastward subduction of the western Marwar craton along with the oceanic crust. The Marwar Basin appears as a distinct litho-tectonic unit with southeast dipping, C-reflection band (Figure 20), between 5 and 18 s twt from SP 1 to SP 820. The BABEL Working Group (1990) and Calvert et al. (1995) have identified dipping reflections in the lower crust and upper mantle of the Baltic and Canadian Shields and related them to a similar subduction process.
Volpe and Macdougall (1990), based on geochemical, geochronological and isotope studies on Phulad ophiolites (and related rocks) from the Delhi Fold Belt, concluded that they are the fragments of the Proterozoic island arc complex. Mooney and Meissner (1991) have suggested a high velocity thick crust for island arc regions. Tewari et al. (1997) have proposed a high velocity of 7.3 km s-1 for the lower crust with a Moho depth of around 50 km for the Delhi Fold Belt region. All these opinions suggest the presence of an island arc in this region. Continuous subduction of the western block might have resulted in the development of this island are. The absence of reflections in the Delhi Fold Belt region is possibly due to the diapiric rise of high-density magmatic material at the island arc, which has disturbed the normal crustal structure. Rise of the magmatic material at the island arc is manifested as a gravity high (Figure 20). Further convergence of the Marwar and Bundelkhand-Aravaili-BGC cratons with the island arc between them resulted in collision and development of the Delhi Fold Belt around 1100 Ma (Figure 21d). The bivergent reflection fabric (C and D reflection bands, Figure 20) corresponds to the Delhi orogeny (Rajendra Prasad et al., 1998). The intervening oceanic crust was transformed into the continental setting by a subduction process (Dewey, 1976) along the Basantgarh-Pbulad zone forming ophiolites. Relocation of Pbulad ophiolites towards the west of the Delhi Fold Belt also indicates subduction of the western block (Marwar craton) towards the cast. Subsequent to collision, the crustal material got partially melted at depth under the high P-T regime emplacing the Erinpura granites (Gangopadhyay and Lahiri, 1988) all along the MB-DFB boundary (Figure 17). Such a feature is normally observed at suture zones. The discontinuous character of C-reflections may be due to the post- Delhi magmatic events of Malani igneous suite (750 Ma) and Erinpura granites (850 Ma) in the Marwar Basin. The convergence, subduction and collision process finally resulted in the development of ‘Delhi Suture’, at this boundary. Differences in crustal reflectivity, gravity signature and metamorphic grades across this boundary support the location of suture between the Marwar and Bundelkhand-Aravalli-BGC cratons (Figure 21). A subduction zone is normally associated with a large negative anomaly over the trench and a high positive anomaly over the island, constitutes a bipolar gravity anomaly. Such an anomaly pair observed over the region indicates that the collision and suturing took place between a continent and an island arc. In the gravity model (Figure 20) the negative anomaly corresponds to the underthrusted older craton while positive anomaly characterizes the overthrusted younger mobile/fold belt. The model correlates well with the direction and the dip of the reflectors, high velocity intrusive body and the thrust fault observed in the seismic sections.
The older dipping reflections are still present at various crustal levels at many other places. Presence of old and young tectonic features exhibits the complex reflectivity pattern. Presence of 1800-Ma old collision fabric indicates the tectonic stability of the region. The presence of dipping reflectors up to 18 s TWT and the island arc signature in the Aravalli Delhi Fold Belt suggest that originally a thick crust was formed and it has not been significantly altered after Proterozoic collision, indicating the thermal and tectonic stability of the region. Evolutionary periods of the Aravalli (~ 1800 Ma) and Delhi (- 1100 Ma) fold belts correlate well with the global orogenic activity (Hoffman, 1989) and may correspond to the supercontinental episodes.
DSS Results in Bengal Basin
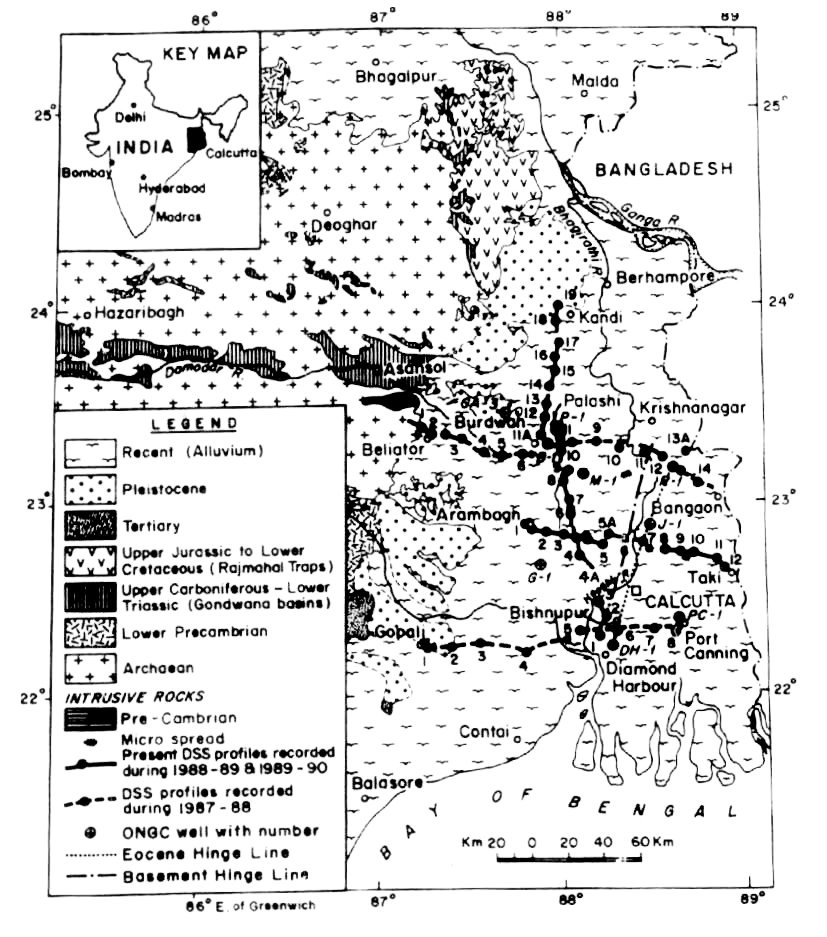
The West Bengal delta, situated in the northeast of the Indian peninsula (Figure 22), is bounded on the west by the Indian peninsular shield, on the south by the Bay of Bengal, and on the east by the Bangladesh plains covered by recent alluvium. The Rajmahal traps (Upper Jurassic to Lower Cretaceous) form the northwestern formations and overlie the Archaean basement. These are deposited in grabens in a continental environment (Tiwari, 1983). At the end of the Carboniferous period, the basin appears to have been affected by intense tectonic activity, and the regional dip towards the southeast became prominent (Tiwari and Banerjee, 1985). The only large tectonic feature, which has developed during late Cretaceous and early Paleocene time, is a flexure trending in the NE-SW direction. During the Eocene and Paleocene times the flexure acted as a continental slope (Tiwari, 1983). According to Sengupta (1996), the Sylhet limestone (Eocene), displays a conspicuous basinward flexure, which is known as the ‘Hinge zone’ or Eocene shelf break, at a depth of about 5200 m.
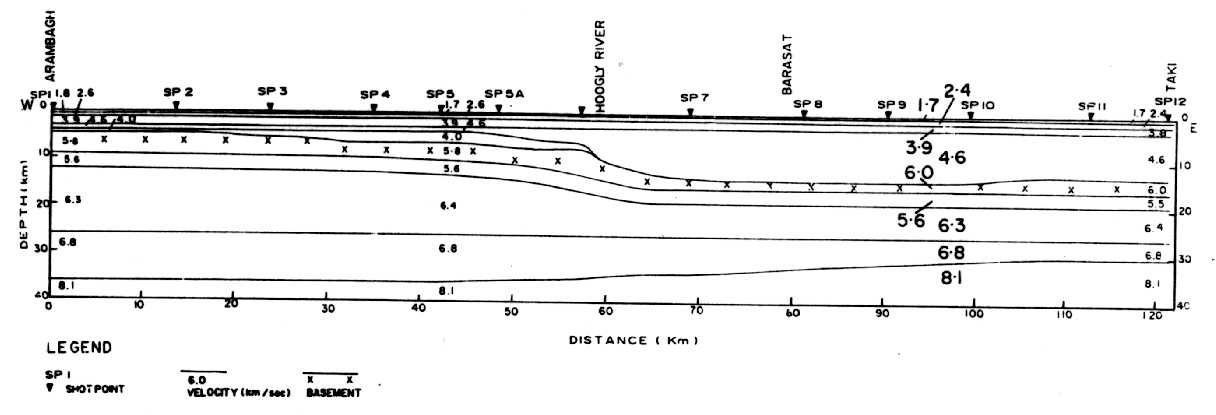
Rao et al. (1999) find a low-velocity layer (5.6 km s-1), of ~3 km thickness, as the most important crustal feature on the east-west profiles (Figure 23). This layer is dipping towards east in conformity with the basement and an overlying 7-14 km thick high-velocity layer of velocity 6.3 to 6.4 km s-1. The P-wave velocity in the lower crustal layer above the Moho discontinuity is found to be 6.8 km s-1. A broad up-warp from ~37 km depth on the west near to a depth of 28 km in the east is observed in the Moho (Figure 23).
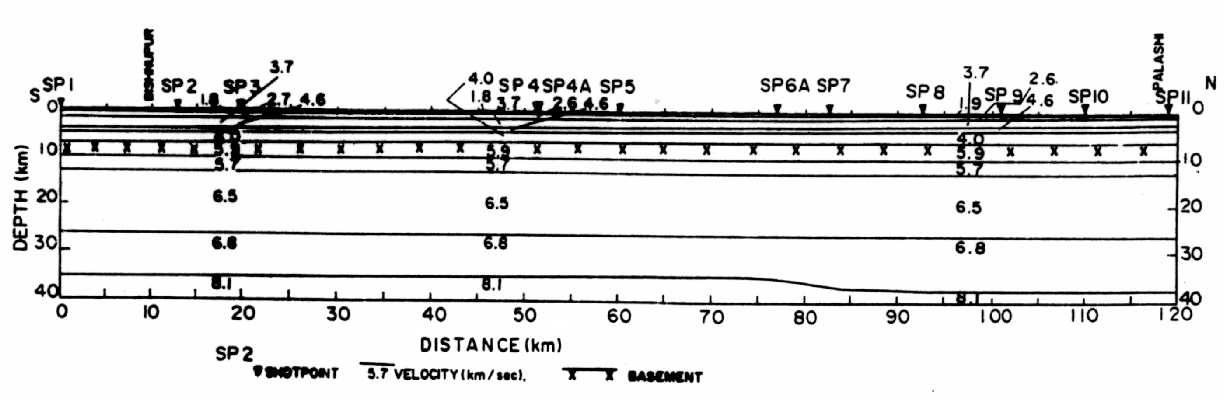
Along the north-south profile the crustal section could be modeled up to Palashi only due to the paucity of data. Kaila et al. (1992) modeled the reflections from the top and bottom of a mid-crustal low-velocity layer of velocity 5.7 km s-1 at a depth of about 10 km. Like in the east-west profiles the significant feature of the upper crustal model includes an ~3 km thick low-velocity layer of velocity 5.7 km s-1 below a 5.9 km s-1 layer and above a 6.3 km s-1. The Moho has been inferred at a depth of ~35 km in the south and ~38 km in the north, with a downwarp between SPs 5 and 8.
According to Tiwari and Banerjee (1985) the Bengal basin appears to be affected by tensional forces, which result in the outpouring of basaltic lava during the Late Jurassic and the Early Cretaceous periods. The above observation combined with a thick accumulation of sediments and broad Moho unwrap, seem to indicate drifting of the crust in this region, even though a high-velocity rift pillow in the lower crust which is normally associated with rift basins, is not observed (Rao et al., 1999).
The crustal section of the north-south profile (Figure 24) revealed P-wave velocities ranging from 1.8 to 8.1 km s-1 with the crustal thickness varying from about 35 to 38 km. This crustal velocity structure is similar to the other models obtained in the cast-west direction. The model consists of nine layers above the crust-mantle boundary and the thickness of the upper crust is about 13 km including sediments. The lower crust consists of two intra-crustal layers with velocities of 6.3 and 6.8 km s-1, with an average thickness of about 13 and 8 km, respectively.
The most intriguing geophysical problem of the West Bengal basin is the problem of the Calcutta gravity high (Tiwari, 1983). However, it was found from the seismic reflection data that there was no structural feature in the basement corresponding to the Calcutta gravity high and Tiwari (1983) opined that it was due to compact shales belonging to the Oligo- Miocene age and a thick section of Sylhet limestone of the Eocene age. The Moho boundary is the only interface dipping towards west, which means that the high-density upper mantle is going down westwards. Therefore, it appears that the dipping Moho is the only source of fall in the gravity anomaly. In fact, the Moho boundary rising towards east should reveal gravity high but for the presence of large thickness of low-density sediments. It can therefore be concluded that the Calcutta gravity high is not due to a basement structural high but rather to dipping Moho boundary towards west and deposition of thick low-density sediments in the deep basin part east of the Eocene shelf break (Rao et al., 1999).
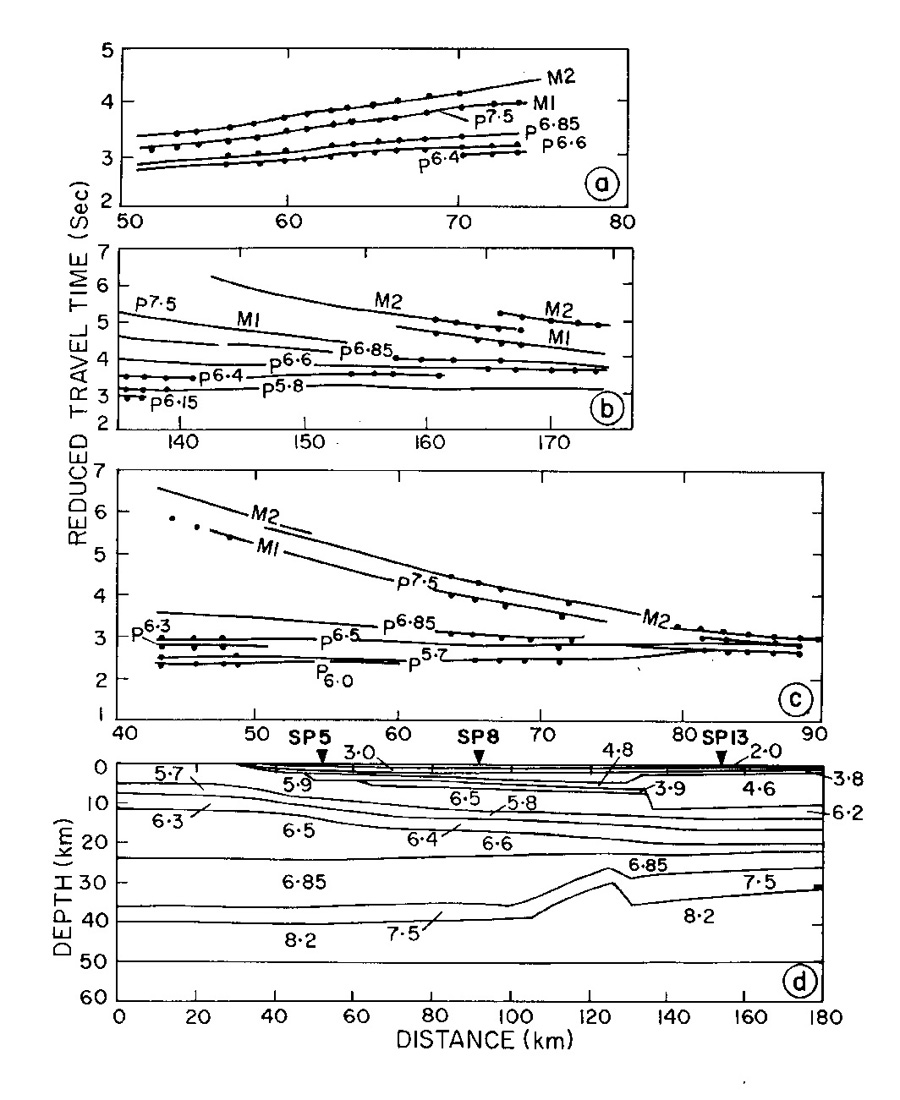
The reinterpretation of the West Bengal seismic data by Mall et al. (1999) show the existence of an additional reflection (M2), that could be identified on the seismograms from most of the major shot points (Figure 25). The M1 reflections, which were earlier identified as reflection from Moho, were identified from top of the velocity zone (7.5 km s-1) in the lower crust, while the M2 reflector was identified as Moho. It is to be noted that the 7.5 km s-1 layer in the lower crust is interpreted as an underplated mantle material (Furlong and Fountain, 1986). It is possible that the tectono-thermal episodes, i.e., the suggested plume paths, separation of Gondwana land (Powell et al., 1988), and the heavy load of the sedimentary basin, might have contributed to the deformation of the deep tectonic configuration in the Bengal basin (Mall et al., 1999). They further consider that a mantle plume supplied the mantle material for the Rajmahal Traps through the lithosphere (oceanic or continental) that must have contributed to the deformation of the crust and lithosphere through secondary convection.
Their study indicates an underplated material with a velocity (7.5 km s-1) less than the Pn (8.2 km s-1) in the area. This inferred that the layer of 7.5 km s-1 is present on all profiles in Bengal basin. The formation of M2 reflections might be attributed to the Moho while the M1 could be associated with mantle plume-related rifting during Cretaceous by underplating above the Moho.
Thick sedimentary cover hides the trace of plume in the Bengal Basin. Its presence could be inferred by subsurface basaltic rocks in seismic depth sections and also in deep bore wells. Its extension in the east has been found in Bangladesh, at least up to 89∞ east; in deep bore wells (Khan, 1991). The Moho and basement contour maps of Bengal basin (Kaila et al., 1992) indicate a north-south elongation and a Moho upwarp toward the eastern part of the profiles II, parallel to 87∞ east, which is the average axis of the plume path in Bengal basin (Mall et al., 1999). The plume path could either take a swing towards 85∞ E or towards 90∞ E ridge because changes in plate motions, due to the impact of plume, have been also noticed elsewhere (Ratcliff et al, 1998).
DSS Results in Southern Granulite Province
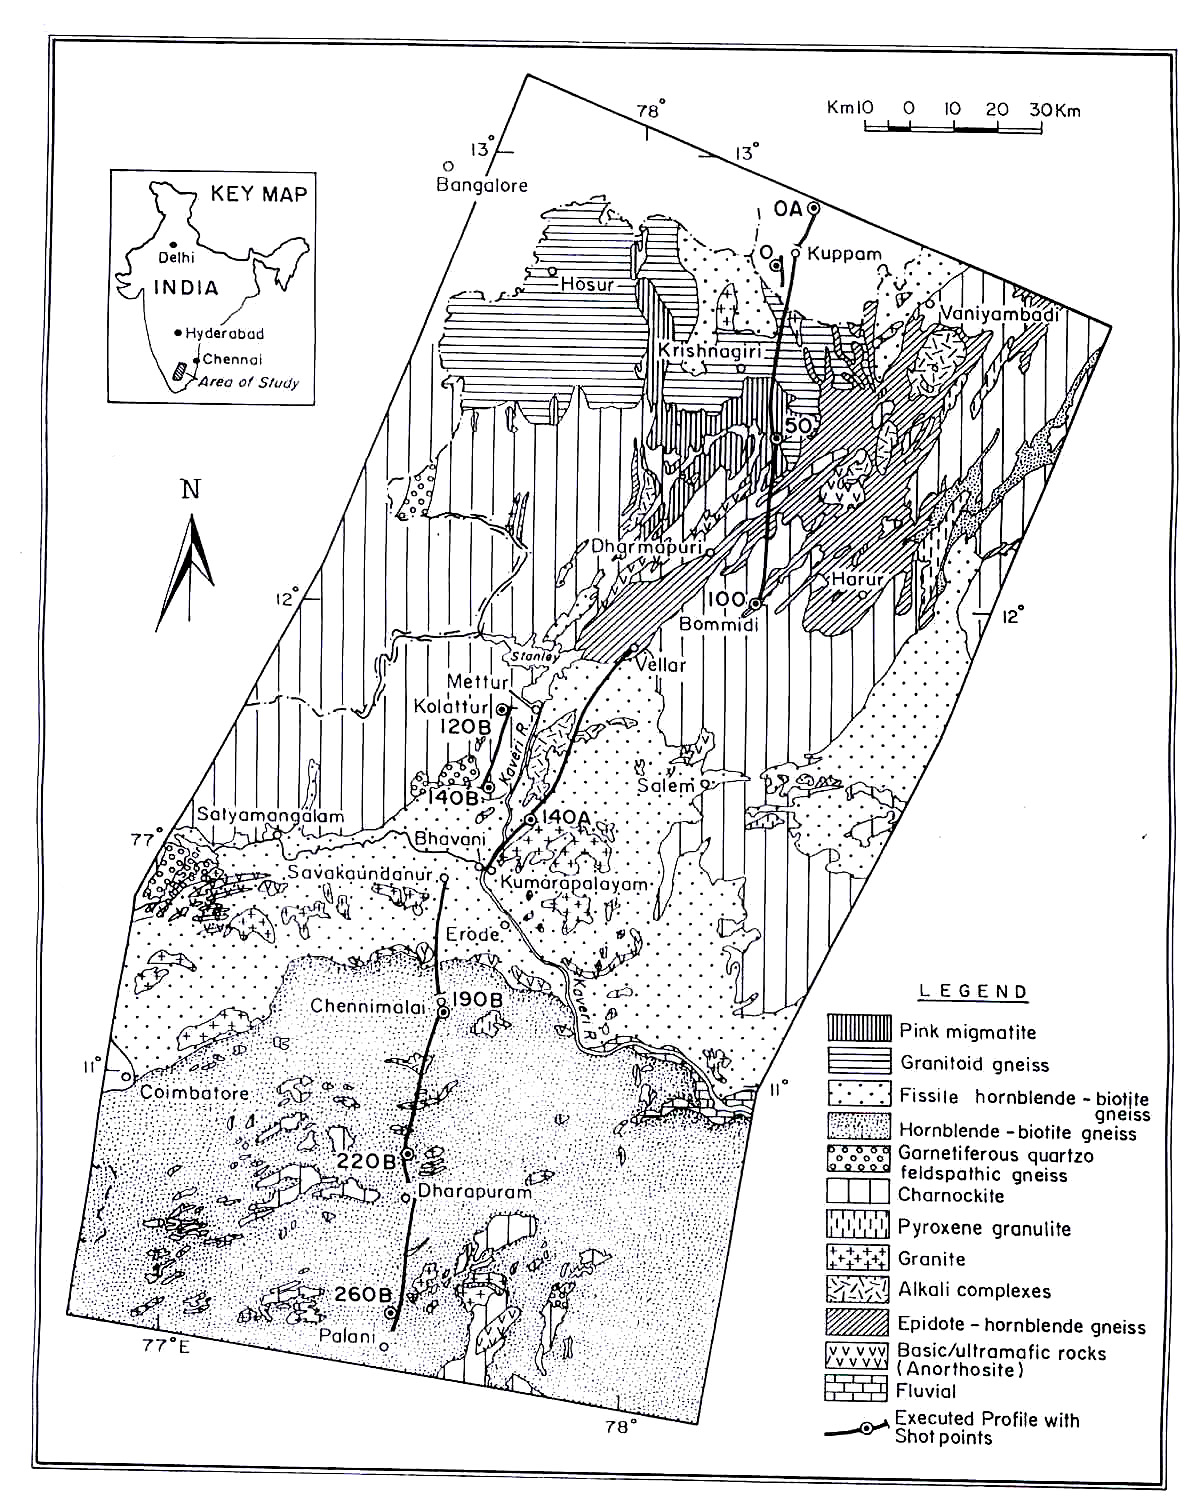
The Indian shield is a mosaic of crustal blocks of independent evolutionary history and juxtaposed together during different geological periods (Radhakrishna, 1989). The Southern Granulite Terrain of India, the extensive granulites believed to be of lower crustal origin, is one of the few terrains in the world that has preserved the Archeaen crust. It has a geological history from early Archaean to Neoproterozoic (3500-550 Ma). The region is a mosaic of high-grade granulite massifs and quartzo-felspathic gneisses, with shear zones in between. Such a terrain provides ample scope to understand the nature of deep continental crust and the geological processes involved in its formation and evolution. Coincident deep seismic reflection and refraction/wide-angle reflection studies were carried out along a 300 km long Kuppam-Palani transect (Figures 26, 27) in the Southern Granulite Terrain.
Seismic near-vertical reflection and refraction data sets were collected to delineate the subsurface features of the region and to understand its structural and tectonic evolution (Reddy et al., In press). Due to logistic constraints, data acquisition was not possible along a straight line, and the 300 km long, N-S trending transects (Figure 27) was divided into three segments namely: (1) Kuppam-Bommidi (90 km) (II) Vellar-Kumarapalaiyam (60 km) (III) Savakaundanur-Palani (147 km).
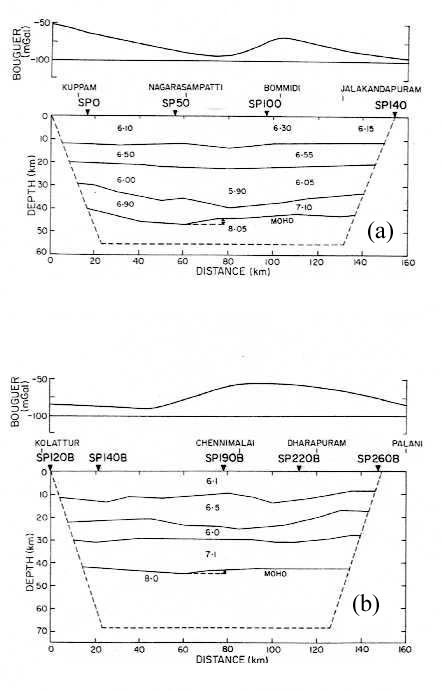
The analysis of seismic data by Reddy et al. (in press) reveal the velocity structure derived from refraction/wide-angle reflection data along the Kuppam-Kumarapalaiyam segments. This shows a four-layered crustal velocity model with a surface velocity of 6.1 km s-1 followed by 6.5 km s-1, 6.0 km s-1 and 7.0 km s-1 corresponding to upper, middle and deeper intracrustal horizons respectively. The first layer velocity increases to 6.30 km s-1 near Bommidi. This could be due to the presence of high-density rocks in the shallow part of the region. Presence of a mid-crustal low velocity (6.0 km s-1) layer of 10 to 15 km thickness is noticed in the entire region of this segment. A thin high velocity (7.0 km s-1) layer underlain by Moho (velocity 8.05 km s-1) is present throughout this segment. The wide-angle reflections from this layer are observed as a band. A crustal root zone below SP 50 is followed by Moho up-warp between SP 50 and SP 100 (Figure 28a).
Velocity model of the Kolattur-Palani segment also depicts a four-layered crustal velocity structure (Figure 28b) with 6.1, 6.6, 6.0 and 7.1 km s-1 velocities respectively. The shallow seismic structure from Chennimalai to Palani indicates a graben-type of configuration. A high velocity (7.1 km s-1) lower crustal layer of 10-15 km thickness underlies the low velocity layer, of 6 to 10 km thickness. This is followed by a layer of 8.05 km s-1 velocity for Moho, which shows an up-warp near SP 190B. This velocity structure is significantly different from that of the first segment.
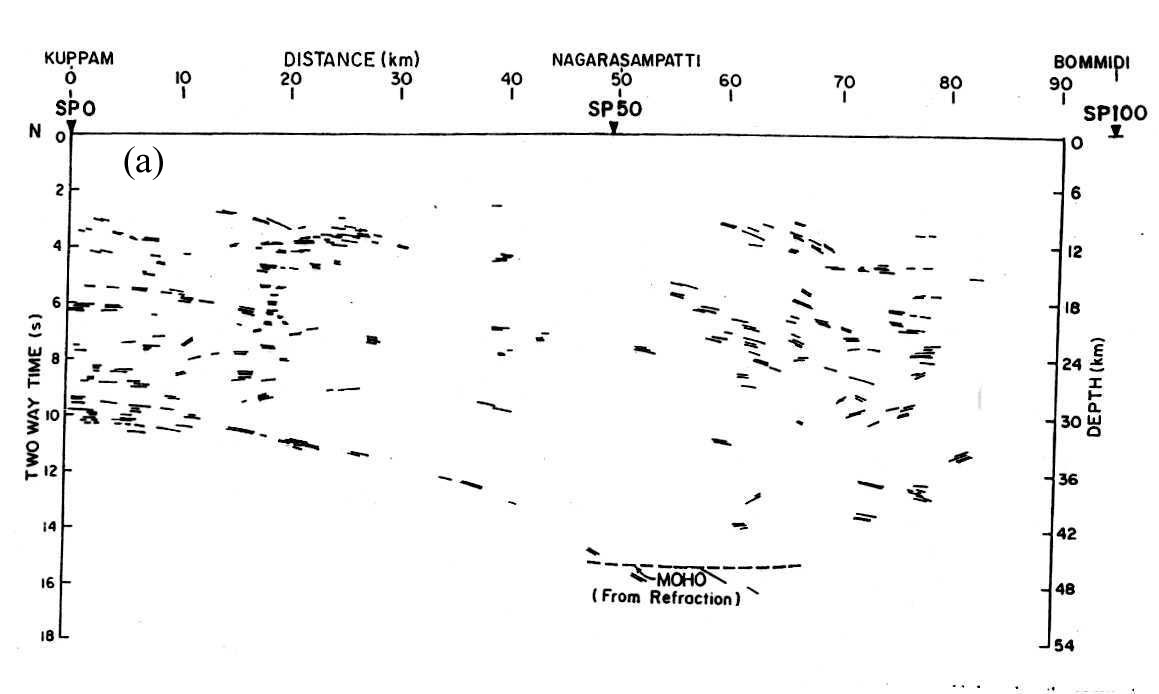
Seismic reflection data with dipping reflections, variations in the crustal seismic reflectivity patterns and crustal scale fault zones provide key constraints to understand the tectonics of a region. Line drawing of the stack section of Kuppam-Bommidi segment (Reddy et al., In press) is presented in Figure 29(a). The northern part of the profile lies on gneisses, whereas the southern part covers the NE-SW trending epidorite-hornblende gneisses and charnockites. Generally, the upper crust is poorly reflective and there are no recognizable reflections in the top 2 seconds of the seismic stack section whereas the middle and lower crustal reflectivity varies and shows horizontal and dipping reflections. The reflectivity in the northern part, starting from Kuppam to a distance of 25 km, is good. A strong south-dipping reflection band, that extends up to a distance of 25 km, is observed around 6 s two way time (TWT) near Kuppam. Further south, the reflectivity is rather poor and no prominent reflections are observed up to a distance of 50 km. Another prominent reflection band, also dipping south, is observed from 10 s TWT near Kuppam to 15 s TWT near SP 50, corresponding to depths of 30 and 45 km respectively. From that point onwards, an up dip trend towards Bommidi is noticed. Similar pattern is also noticed from the 2-D velocity-depth information obtained using refraction data. In general, the reflectivity is poor between the profile distance of 25 and 50 km. This abrupt decrease in middle and lower crustal reflectivity near SP 50 can be attributed to the existence of a deep-seated fault. The reflectivity increases again beyond SP 50. A strong up-doming reflection band is observed between 15 and 30 km profile distance at around 4s TWT. The reflection Moho is usually defined at the bottom of the lower crustal reflectivity. This coincides with Moho up-warp delineated by wide-angle reflections around SP 50.
The Vellar-Kumarapalaiyam segment located south of the Mettur shear zone, mostly consists of the fissile hornblende-biotito, gneisses. The upper 2s of seismic stack section (Figure 29b, from Reddy et al., in press) is devoid of any useful reflections. Most of the reflections, from Kumarapalaiyarn to Vellar, dip towards north. This reflection trend is opposite to that of the Kuppam-Bommidi segment. Continuity of the reflections is lost at a few places where up doming of reflections is observed. A prominent reflection band extends to 14 s TWT, corresponding to a depth of ~ 42 km, near Vellar.
The other important features of the line drawings from both the segments are the small domal features. The southerly dipping reflector, south of SP 140A, is possibly an incomplete limb of a larger dome. The profile does not extend further to cover the other limb. In between, there is no strong unidirectional dip for any of the reflectors, all of which are undulating. Such a reflectivity pattern could be due to the presence of granitic bodies, south of SP140A and alkaline (syenite-carbonatite) intrusives south of Vellar. The undulations in the reflecting surfaces could be due to intrusions, some of which may not be exposed at the surface.
Seismic stack section of the Sayakaundanur-Palani segment, covering the Moyar-Bhabani and Palghat-Cavery shear zone region, is of poor quality. The Paighat-Cauvery shear zone seems to be highly disturbed due to structural heterogeneity and the presence of a number of other shear zones. No definite conclusions can be made based on the seismic data in this section.
According to Reddy et al. (In press), the low velocity layer present in this region indicates that the Southern Granulite Terrain does contain a low velocity, low-density ductile mega shear zone of mantle origin. The reflectivity pattern derived from the seismic reflection study indicate a deep penetrating, prominent south dipping reflection band from Kupparn which extends to Moho depth, near SP50, the Mettur shear zone region, which represents the continuation of the Eastern Ghat mobile belt (Drury et al., 1984). The nature of this reflection band indicates that the region has been subjected to compression. The dip reversals observed at this shear zone constitute a divergent reflection fabric and indicate that they have developed as a collision between the Dharwar craton and another crustal block which could be a part of the present Eastern Ghat mobile belt. This suggests that thrusting and collision were responsible for the evolution of the Southern Granulite Terrain during the Precambrian. The domal feature indicates intrusions in later part of the geological history. They are represented by Mesol Neo- proterozoic alkaline (syenite-carbonatite) and granitic plutons at various places which have obliterated the earlier structures.
The seismic reflection study also indicates difference in the reflectivity pattern on either side of the Mettur shear zone (extension M-B), where north - and south - dipping reflections from Kuppam and Kumarapalaiyam converge. The crustal velocity model shows a Moho upwarp at the convergent point of two oppositely dipping reflectors (Figure 28). This suggests that it can be a terrain boundary between Dharwar craton and the crustal block containing Eastern Ghat mobile belt.
References
- Acharyya, S.K., Kayal, J.R., Roy, A. and Chaturvedi, R.K. 1998. Jabalpur Earthquake of May 22, 1997: Constraint from Aftershock study, J. Geol. Soc. of India, 51, 195 304.
- Agrawal, B. N. P., Shivaji, C. H., Chakraborty, K. and Kumar, B. 1995. Digital techniques of interpretation of potential field data. Newsletter, Deep Continental Studies in India, 1, 2, 3-6.
- Auden, J. B., 1933. Vindhyan sedimentation in Son valley, Mirzapur district, U. P. Rec, Geol. Surv. India, 96, 2.
- BABEL Working Group. 1990. Evidence for early Proterozoic plate tectonics from seismic reflection profiles in the Baltic shield. Nature, 34, 34-38.
- BABEL Working Group. 1993. Intergrated seismic studies of the Baltic shield using data in the Gulf of Bothnia region. Geophys. J. Int., 112, 305-324.
- Bhattacharya, P. K. and Mukherjee, A. D. 1984. Pertochemistry of metamorphosed pillow and the geochemical status of the amphibolites (Proterozoic) from Sherohi district, Rajasthan, India. Geol. Mag., 121, 465-473.
- Bhattacharjee, J., Golani, P. R., Reddy, A. B. 1988. Rift relatd bimodal volcanism and metallogeny in the Delhi fold belt, Rajasthanand Gujrat. Indian J. Geol., 60, 191-199.
- Bohlen, S.R. 1987. Pressure-remperature-time paths and atectonic model for the evolution of granulites. J. Geol., 95, 617-632.
- Calvert. A.J., Sawer, E.W., Davis. W.J. and Ludden, J.N. 1995. Archaean subduction inferred from seismic images of mantlesuture in the Superior Provinces. Nature, 375, 670-674.
- Deb, M., Thorpe. R. I., Cumming. G.L. and Wagner. P.A. 1989. Age, source and stratigaphic implications of Pb isotope data for conformable, sediment hosted basemetal deposits in the Proterozoic.Aravalli Delhi orogenic belt, N-W India. Precambrian Res., 43, 1-22.
- Deb, M., Talwar. A. K., Tewari. A. and Banerjee. A.K. 1995. Bimodalvolcanism in South Delhi fold belt: a suite of differentiated felsic lava at Jharivav, north Gujarat. In: Singha-Roy, S., Gupta, K.R. (eds.), Continental Crust of N-W and Central India. Geol. Soc. India, Memoir 31, pp. 259-278.
- Dewey. J.G. 1976. Ophiolite abduction. Tectonophysics, 3l, 93-120.
- Durheirn, R.J. and Mooney, W.D. 1994. Evolution of the Precambrian Lithosphere: geological and gecheniical constraints. J. Geophys. Res., 99, 15359-15374.
- Drury, S.A., Harris, N.B.W., Holt, R.W., Smith, R.G.J. and Wightman, R.T. 1984. Precambrian tectonics and crustal evolution in south India. Jour. Geol., 92, 3-20.
- Furlong, K.P. and Fountain, M.D. 1986. Continental crustal underplating: thermal considerations and seismic petrologic consequences. J. Geophys. Res., 91, 8285-8294.
- Gangopadhyay, P.K., Lahiri, A., 1988. Anjna granite and associated rocks of Deogarh, Udaipur district, Rajasthan. In: Roy. A.B.(Ed.), Precambrian of the Aravalh Mountain, Rajasthan, India.Geol. Soc. India, Memoir 7, pp. 307-316.
- Ghosh, D. B., 1975. The Nature of Narmada-Son lineament, Geol Surv. India, Misc. Publ. No., 34, part 1, 119.
- Gopalan. K., Macdougall. J.D., Roy. A.B. and Murali. A.V. 1990. Sm-Nd evidence for 3.3 Ga old rocks in Rajasthan. northwestern India. Precambrian Res., 48, 287-297.
- GSI. 1995. Geological and Mineral Map of TamilNadu and Pondicherry (Scale 1:0.5 million).
- Gupta. S.N., Arora. Y.K., Mathur. R.K., lqbaluddin. Balmiki Prasad, Sahani, T.N. and Sharma. S.B. 1980. Lithostratigraphy map of Aravalli region. Geol. Surv. India.
- Hall, J and Quinlan, G. 1994. A collisional crustal fabric pattern recognized from seismic reflection profiles of the Appalichian/ Caledonide orogen. Tectonophysics, 232, 31-42.
- Heron, A. M., 1917. The geology of north-eastern Rajputana and adjacent district, Mem. Geol. Surv. India. 45, part I, 1-128.
- Heron, A.M. 1953. The geology of Central Rajpurana. Geol. Surv. India. Memoir 79, pp. 389.
- Heitzmann, P., Watern, F., Peter, L. and Paul, V. S. 1991. Crustal indentation in the Alps – An overview of reflection seismic profiling in Switzerland continental lithosphere. Geodynamics Series, 22, AGU, pp. 161-176.
- Hoffman, P. F. 1989. Precambrian geology and tectonic history of North America. In: Bally, A. W. and Palmer, A. R. (eds.). The Geology of North Ameraica Â3⁄4 An overview. Geological Scc. America, Boulder, CO, pp. 447-512.
- Hyndman. R.D. 1988. Dipping seismic reflectors, electrically conductive zones and trapped water over a subduction plate. J. Geophs. Res., 93, 13391-13405.
- Jain, S. C., Nair. K. K. K. and Yedekar, B. D., 1995. Geology of the Son-Narmada-Tapti Lineament zone in Central India. Geoscientific Studies of The Son-Narmada-Tapti Lineament Zone, In: Project CRUMSONATA, Sp. Pub. 10, Geol. Surv. India, 1-154.
- Jain, S. C., Yedekar, D. B. and Nair, K.K.K. 1991. Central Indian shear zone: A major Precambrian crustal boundary. J. Geol. Soc. India, 37, 521-531.
- Kaila, K. L. and Krishna, V. G., 1992. Deep seismic sounding studies in India and major discoveries. In: Special Issue, Seismology in India Â3⁄4 An overview, Current Science, 62, 117-154.
- Kaila, K. L., Reddy, P.R., Mall, D. M., Venkateshwarlu, N., Krishna, V. G. and Prasad, A.S.S.S.R.S. 1992. Crustal structure of the West Bengal basin, India from deep seismic sounding investigations. Geophys. J. Int., 111, 45-66.
- Kaila, K. L., Murty, P. R. K., Mall, D. M., Dixit, M. M. and Sarkar, D., 1987. Deep seismic sounding along Hirapur-Mandla Profile, Central India, Geophys. J. R. astr. Soc., 89, 399-404.
- Khan, F. H. 1991. Geology of Bengladesh, pp. 207. Wiley Eastern Ltd., New Delhi.
- Lucas. S.B., Green. A., Hajnal. Z., White, D., Lewry, J., Ashton, K.,Weber, W. and Clowes, R. 1993. Deep seismic profile across a Proterozoic collision zone: surprises at depth. Nature, 363, 339-342.
- Mall, D.M., Rao, V. K. and Reddy, P. R. 1999. Deep sub-crustal features in the Bengal basin: seismic signatures for Plume activity. Geophys. Res. Lett., 26, 2545-2548.
- Meissner, R., Wever, T. H. and Fluh, E. R. 1987. The Moho in Europe Â3⁄4 Impolications for crustal development. Ann. Geophysicae, 55, 357-364.
- Meissner, R. 1989. Repture, Creep, lamellae and crocodiles: happenings in the continental crust. Tera Nova, 1, 17-28.
- Meissner, R. 1996. Faults and folds, facts and fiction. Tectonophysics, 264, 279-293.
- Mishra, D. C., 1992. Mid-continent Gravity high of central India and Gondwana tectonics. Tectonophysics, 212, 153-161.
- Mooney, W. D. and Meissner, R. 1991. Continental crustal evolution, observations. EOS, 72, 537-541.
- Murty, A. S. N., Mall, D. M., Murty, P. R. K. and Reddy, P. R., 1998. Two- dimensional Crustal Velocity structure along Hirapur- Mandala Profile from Seismic Refraction and Wide-angle Reflection Data, Pure and Applied Geophysics, 152, 247-266.
- Murty, A. S. N., Tewari, H. C. and Reddy, P. R. (in press). 2-D Crustal velocity model along Hirapur-Mandla DSS Profile Â3⁄4 An update. PAGEOPH.
- Nayak, P. N., Dutta, K. K., Ravi Shankar and Sehgal, M. N., 1986. Geological and geophysical studies vis-Ã-vis results of DSS profiles in Central India, in An analysis, in Deep Seimic soundings and Crustal Tectonics, eds Kaila, K. L and Tewari, H. C., AEG, Hyderabad, 83-97.
- Powell, C. M., Roots, S. R. and Veevers, J. J. 1988. Pre-breakup continental extension in east Gondwana land and early opening of the eastern Indian ocean. Tectonophysics, 155, 261-283.
- Prakash Kumar, Tewari, H. C. and Khandekar, G., 2000. An Anomalous high velocity layer at a shallow crustal depth across the Narmada zone, India, Geophys. J. Int. 142, 95-107.
- Ratcliff, J. T., Barcovici, D., Schubert, G. and Kronenke, L. W. 1998. Mantle plume heads and the initiation of plate tectonic reorganizations. Earth Planet. Sci. lett., 156, 195-207.
- Radhakrishna, B. P. 1989. Suspect tectono-stratigraphic terrane elements in the Indian subcontinent. Jour. Geol. Soc. India, 34, 1-24.
- Radhakrishna, B. P. and Naqvi, S. M. 1986. Precambrian continental crust of India and its evolution. J. Geol., 94, 145-166.
- Rajendra Prasad, B., Tewari. H. C., Vijaya Rao, V., Dixit, M. M. and Reddy, P.R. 1998. Structure and tectonics of the Proterozoic Aravalli-Delhi fold belt in NW India from deep seismic reflection studies. Tectonophysics, 288, 31-41.
- Rao, C. K., Gokarn, S. G. and Singh, B. P., 1995. Upper Crustal structure in the Torni-Purnad Region, Central India using Magnetotelluric studies, J. Geomag. Geoelectr, 47, 411-420.
- Rao, I. B. P., Murty, P. R. K., Rao, P. K., Murty, A. S. N., Rao, N. M. and Kaila, K. L. 1999. Structure of the lower crust revealed by one- and two-dimensional modeling of wide-angle reflections Â3⁄4 West Bengal basin, India. PAGEOPH, 156, 701-718.
- Reddy, P.R., Rajendra Prasad. B., Vijaya Rao, V., Khare, P., Rao. G. K., Murry, A. S. N., Sarkar, D., Raju, S., Rao, G.S.P. and Sridhar,V. 1995. Deep seismic reflection profiling along Nandsi-Kunjer section of Nagaur-Jhalawar transect, preliminary results. In: Sinha-Roy, S., Gupta, K.R. (eds.), Continental Crust of NW and Central India. Geol. Soc. India. Memoir 31, pp. 353-372.
- Reddy P. R., Murty, P. R. K., Rao, I. B. P., Mall, D. M. and Rao, P. K. 2000. Coincident deep seismic reflection and refraction profiling, Central India. In: O. P. Varma and T. M. Mahadevan (eds.), Research Highlights in Earth System Science. Indian Geological Cong., pp. 49-53.
- Reddy, P. R., Rrasad, B. R., Rao, V. V., Sain, K., Rao, P. P., Khare, P. and Reddy, M. S. (In press). Deep seismic reflection and refraction/wide-angle reflection studies along Kummap-Palani transect in the Souther Granulite Terrain of India. Mem. Geol. Soc. India.
- Sarkar, G., Ray Burman, T., Corfu, F. 1989. Timing of continental arc-type magmatism in NW India: evidence form U-Pb zircon geochronology. J. Geol., 97, 607-612.
- Sengupta, S. 1996. Geological and Geophysical studies in western part of Bengal Basin, India. Am. Assoc. Petr. Geol. Bull., 50, 1001-1017.
- Sharma, R. S. 1988. Patterns of metamorphism in the Precambrian rocks of the Aravalli Mountain belt. In: Roy, A.B. (ed.), Precambrian of the Aravalli –Mountain, Rajasthan, India. Geol. Soc. India. Mermoir 7, pp. 33-75.
- Sinha-Roy, S. 1988. Proterozoic Wilson cycles in Rajasthan. In: Roy. A.B. (ed.), Precambrian of the Aravalli Mountain, Rajasthan, India. Geol. Soc. India, Memoir 7, pp.95-108.
- Sinha-Roy, S. and Mohanty, M. 1988. Blue shist facies metamorphismin the ophilite melange of the late Proterozoic Delhi fold belt, Rajasthan, India. Precambrian Res., 42, 97-105,
- Sinha-Roy, S., Mathotra, G. and Guha, D.B. 1995. A transect across Rajasthan Precambrian terrain in relation to geology, tectonics and crustal evolution of south central Rajasthan. In: Singha Ray. S. and Gupta. K.R. (eds.), Continental Crust of NW and Central India. Geol. Soc. India, Memoir 31, pp. 63-89.
- Singh, A. P. and Meissner, R., 1995. Crustal configuration of the Narmada-Tapti region (India) from gravity studies. J. Geodynamics, 20, 111-127.
- Shivaji, Ch. and Agrawal, B. N. P. 1995. Application of the Relaxation techniques in mapping of crustal discontinuities from Bouguer anamolies over central India. Mem. Geol. Soc. India, 31, 425-578.
- Sridhar, A. R. and Tewari, H. C. 2001. Existence of a sedimentary basin under the Deccan volcanics in the Narmada region. J. Geodynamics, 31, 19-31.
- Sridhar, A. R. 2001. Crustal Seismic structure across the Western Narmada Zone (Thuadara Sindad) with special emphasis on the structure up to the basement. Ph. D. Thesis, Submitted to Osmania University, Hyderabad, India.
- Sugden, T. J., Deb, M. and Windely, B.F., 1990. The tectonic setting of mineralization in Proterozoic Aravalli Delhi orogenic belt, NW India. In: Naqvi. S.M. (ed.). Precambrian Continental Crust and its Economic resources, Developments in Precambrian Geology. vol. 8. Elsevier, Amsterdam. pp. 367-390.
- Tewari, H.C., Rao, V.V., Dixit, M.M., Prasad, B. R., Rao, N. M., Venkateswarlu, N., Khare, P. and Kaila, K. L. 1995. Deep crustal reflection studies across the Delhi-Aravalli Fold Belt: results from the northwest part. Geol. Soc. of India Mem., 31, 383-402.
- Tewari, H.C., Dixit, M. M., Rao, N.M., Venkateswarlu, N. and Rao, V.V. 1997. Crustal thickening under the Paleoproterozoic Delhi Fold Belt in NW India: evidence from deep reflection profiling. Geophys. J. Int., 129, 657-668.
- Tewari, H. C. and 11 others, 1998. Nagaur-Jhalawar geotransect across the Delhi-Aravalli Fold Belt in northwest India. Jour. of Geol. Soc. of India, 52, 153-162.
- Tewari, H. C., Murty, A. S. N., Prakash Kumar and Sridhar, A. R., 2001. A Tectonic model of Narmada region, Current Sci., 80, 873-878.
- Tiwari, S. 1983. The Problem at Calcutta Gravity High and its Solution. Bull. Oil and Natural Gas Commission, 20, 48-61.
- Tiwari, S. and Banerjee, S. K. 1985. Seismic Stratigraphy of onshore West Bengal Basin. Bull. Oil and Natural Gas Commission, 22, 97-121.
- Venket, Rao K., Srirama, B. V. and Ramasastry, P. 1990. A Geophysical appraisal of Mahakoshal Group of upper Narmada valley in Precambrian of central India. Geol. Surv. India, Spl. Pub. 28, 99-117.
- Verma, R. K. and Banerjee, P. 1992. Nature of continental crust along the Narmada- Son lineament, inferred gravity and deep seismic sounding data. Tectonophysics, 202, 375-397.
- Vijay Rao, V., Prassd, B. R., Reddy, P. R. and Tewari, H. C. 2000. Evolution of Protrerozoic Aravalli Delhi fold belt in the northwestern Indian shield from seismic studies. Tectonophysics, 327, 109-130.
- Volpe, A. M. and Macdougall, J. D. 1990. Geochemistry and isotope characteristics of mafic (Phulad Ophiolite) and related rocks in the Delhi supergroup, Rajasthan, India: Implications for rifting in the Proterozoic. Precambrian Res. 48. 167-191.
Figures
- Figure 1
- Location of various tectonic elements of the central Indian shield vis-a-vis other major tectonic units of the region [modified from Verma and Banerjee, 1992] on the basis of work by Bandyopadhyay et al., [1995]. Shaded portion is the study area
- Figure 2
- Geological map of central India showing the Deep Seismic Sounding profiles with shot point numbers. [Faults boundaries after Acharyya et al., 1998].
- Figure 3
- 2-D Velocity-depth section along the Profile I [after Murty et al., in press]
- Figure 4
- 2-D Density model along the Profile I [after Murty et al., in press]
- Figure 5
- 2-D Velocity-depth sections on the three segments along the Profile II
- Figure 6
- 2-D density model along the DSS Profile II based on the above seismic models.
- Figure 7
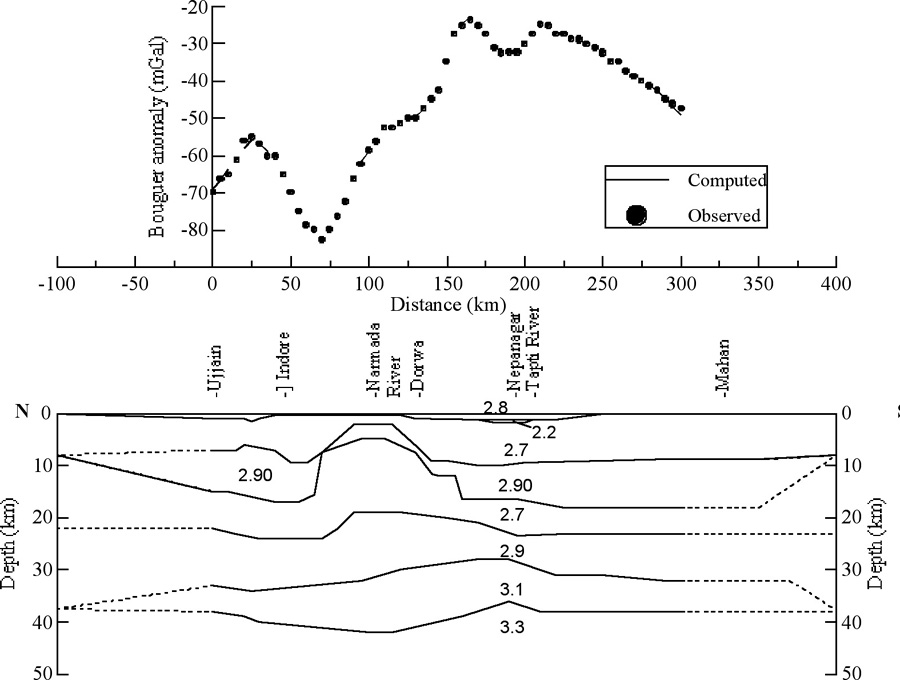
- 2-D Velocity-Depth Section along the DSS Profile III
- Figure 8
- 2-D density model along the DSS Profile III
- Figure 9
- 2-D Velocity-depth section along DSS Profile IV [after Sridhar and Tewari, 2001].
- Figure 10
- 2-D density model along the DSS Profile IV [after Sridhar, 2001].
- Figure 11
- Basement depth (velocity: 5.8-6.1 km s-1) contour map of central India with DSS Profiles. The basement is shallower (~200 m) between NNF and NSF. Larger values of basement depth, close to Profile I, are due to the larger thickness of Vindhyan sediments in that region [after Prakash Kumar et al., 2000].
- Figure 12
- Image map of the top of the high velocity layer (velocity: 6.6-6.7 km s-1) in the upper crust in central India [after Prakash Kumar et al., 2000].
- Figure 13
- Bouguer anomaly map of central India (after Verma and Banerjee, 1992) and Narmada faults [after Acharryya et al., 1998]. The gravity low axis marked as ‘L’. The seismic profiles are also plotted.
- Figure 14
- Schematic cartoon diagram depicting the development of seismic crust and subcrustal lithosphere in the Narmada region (After Tewari et al., 2001).
- Figure 15
- Geological map of a part of the central Indian craton shown with the coincident deep reflection/wide-angle reflection profiles across the Central Indian shear zone (Mungwani-Seoni-Katangi-Kalamati) [from Reddy et al., 1995].
- Figure 16
- Line drawing (a) and interpreted section (b) of the reflections along the CIS profile [after Reddy et al., 2000]
- Figure 17
- Geological map of NW Indian shield with Nagaur – Jhalawar DSS Profile with shot point numbers. [from Rao et al., 2000]
- Figure 18
- Migrated two-way travel time section of a part of the Nagaur-Jhalawar DSS profile [after Tewari et. al., 1998].
- Figure 19
- Tectonic mod along the Nagaur-Jhalawar transect [after Tiwari et al., 1998].
- Figure 20
- A line diagram based on the migrated section showing the main reflecting horizons along the Nagaur-Jhalawar DSS profile [after Vijay Rao et. al., 2000].
- Figure 21
- Cartoon depicting the evolutionary stages of the Arawalli-Delhi Fold Belt [after Vijay Rao et al., 2000]
- Figure 22
- DSS profiles (Gopali-Port Canning, Beliator-Bangaon, Arambagh-Taki and Bishnupur-Kandi) plotted on the geological map of Bengal Basin. [from Rao et al., 1999].
- Figure 23
- Velocity-depth section along Arambagh-Taki DSS profile [after Rao et al., 1999].
- Figure 24
- Velocity-depth section along Bishnupur-Palashi section of the Bishnupur-Kandi DSS profile [after Rao et al., 1999]
- Figure 25
- Synthetic (continuous lines) and observed travel times (heavy dots) in wide angle distance range for (a) west of shot point 13, (b) east of shot point 8 (c) east of shot point 5 and (d) interpreted velocity model with velocity values in km s-1 of different layers of profile Beliator-Bangaon. Phase M1 represents Moho identified by earlier study and phase M2 identified in present study [after Mall et al., 1999].
- Figure 26
- Simplified geological map of a part of Southern India (based on GSI, 1994) showing the N-S corridor under study. The domains are separated by major Ductile shear zones: Moyar (M), Bhavani (B), Palghat-Cauvery (P-Ca). Also shown are the Western and Eastern parts of the Dharwar Craton (WDC, EDC).
- Figure 27
- Location of Kuppam-Palani transect over the geological map of the Southern Granulite Terrain [after GSI, 1995].
- Figure 28
- 2-D Velocity structure and gravity profiles of the Kuppam-Kumerapalaiyam (a) and Kolattur-Palani (b) [after Reddy et al., In press].
- Figure 29a, 29b
- Line drawing of the stack section along the Kupam- Bommidi (a) and Vellar-Kumarapalaiyam (b) segments. The depth scale on the right side is approximate and is based on the conversion of travel to depth with a constant velocity of 6.0 km s-1 throughout [after Reddy et. al., In press].