Gokarn, S.G., Gupta, G., Rao, C.K. and Selvaraj, J. 2003. Some Interesting Observations on the Tectonics in the Deccan Volanic Province Observed From Magnetotelluric Studies. Journal of the Virtual Explorer 12, 55-65
Some Interesting Observations on the Tectonics in the Deccan Volanic Province Observed From Magnetotelluric Studies.
Abstract
Magnetotelluric studies in the northern DVP near Nasik have delineated a deep seated thrust zone, indicative of the compressional tectonics prior to the Deccan volcanism, where as, in the region around Koyna to the south an extensional tectonic regime is observed. The Panvel flexure is a major feature along the western margin, which may have been formed prior to the eruption of the Deccan volcanics, although the vertical movements may still be persisting due to the loading of the volcanics as well as the erosional unloading. Our studies indicate that different parts of the NS trending Panvel flexure may have been formed due to different tectonic and intrusive processes. An approximately NW-SE trending high conductivity (100 Ω-m) is delineated at depth of 60 km and beyond. This seems to be extending to the south beneath the Dharwar craton and seems to be due to the passage of the Indian plate over the Reunion hot spot.
Keywords:
Deccan Volcanics,ĀĀ Magnetotelluric studies,ĀĀ Reunion hot spot
Introduction
The crust in Deccan volcanic province (DVP) is covered by the fissure erupted basaltic magma, which has spread over an area of about half a million sq.km. in the western part of the Indian peninsula. The continental flood basalts with thickness ranging from a few meters to about 3000 meters are emplaced over the northern part of the Dharwar craton (Qureshy, 1981), which has suffered intense tectonic activity during the Precambrian. Further more, the isostatic imbalance caused by the nearly 1015 tons of the basalts as well as the subsequent weathering and erosional processes may have made a significant contribution to the tectonic evolution of the DVP (Widdowson and Mitchell, 1999). In order to get the geoelectric structure of the pre-Trappean crustal configuration and the deeper features, magnetotelluric studies were conducted over two E-W corridors in the western DVP, one in the north, about 100 km north of Nasik and the other, in the south near Koyna. Most of the work reported here is a part of the integrated multidisciplinary project for investigating the seismicity of the western part of the DVP, under the funding from the Government of Maharashtra. The selection of the profiles was thus to a large extent governed by the broader objectives of the multidisciplinary project.
Tectonic setting and previous Geophysical Studies
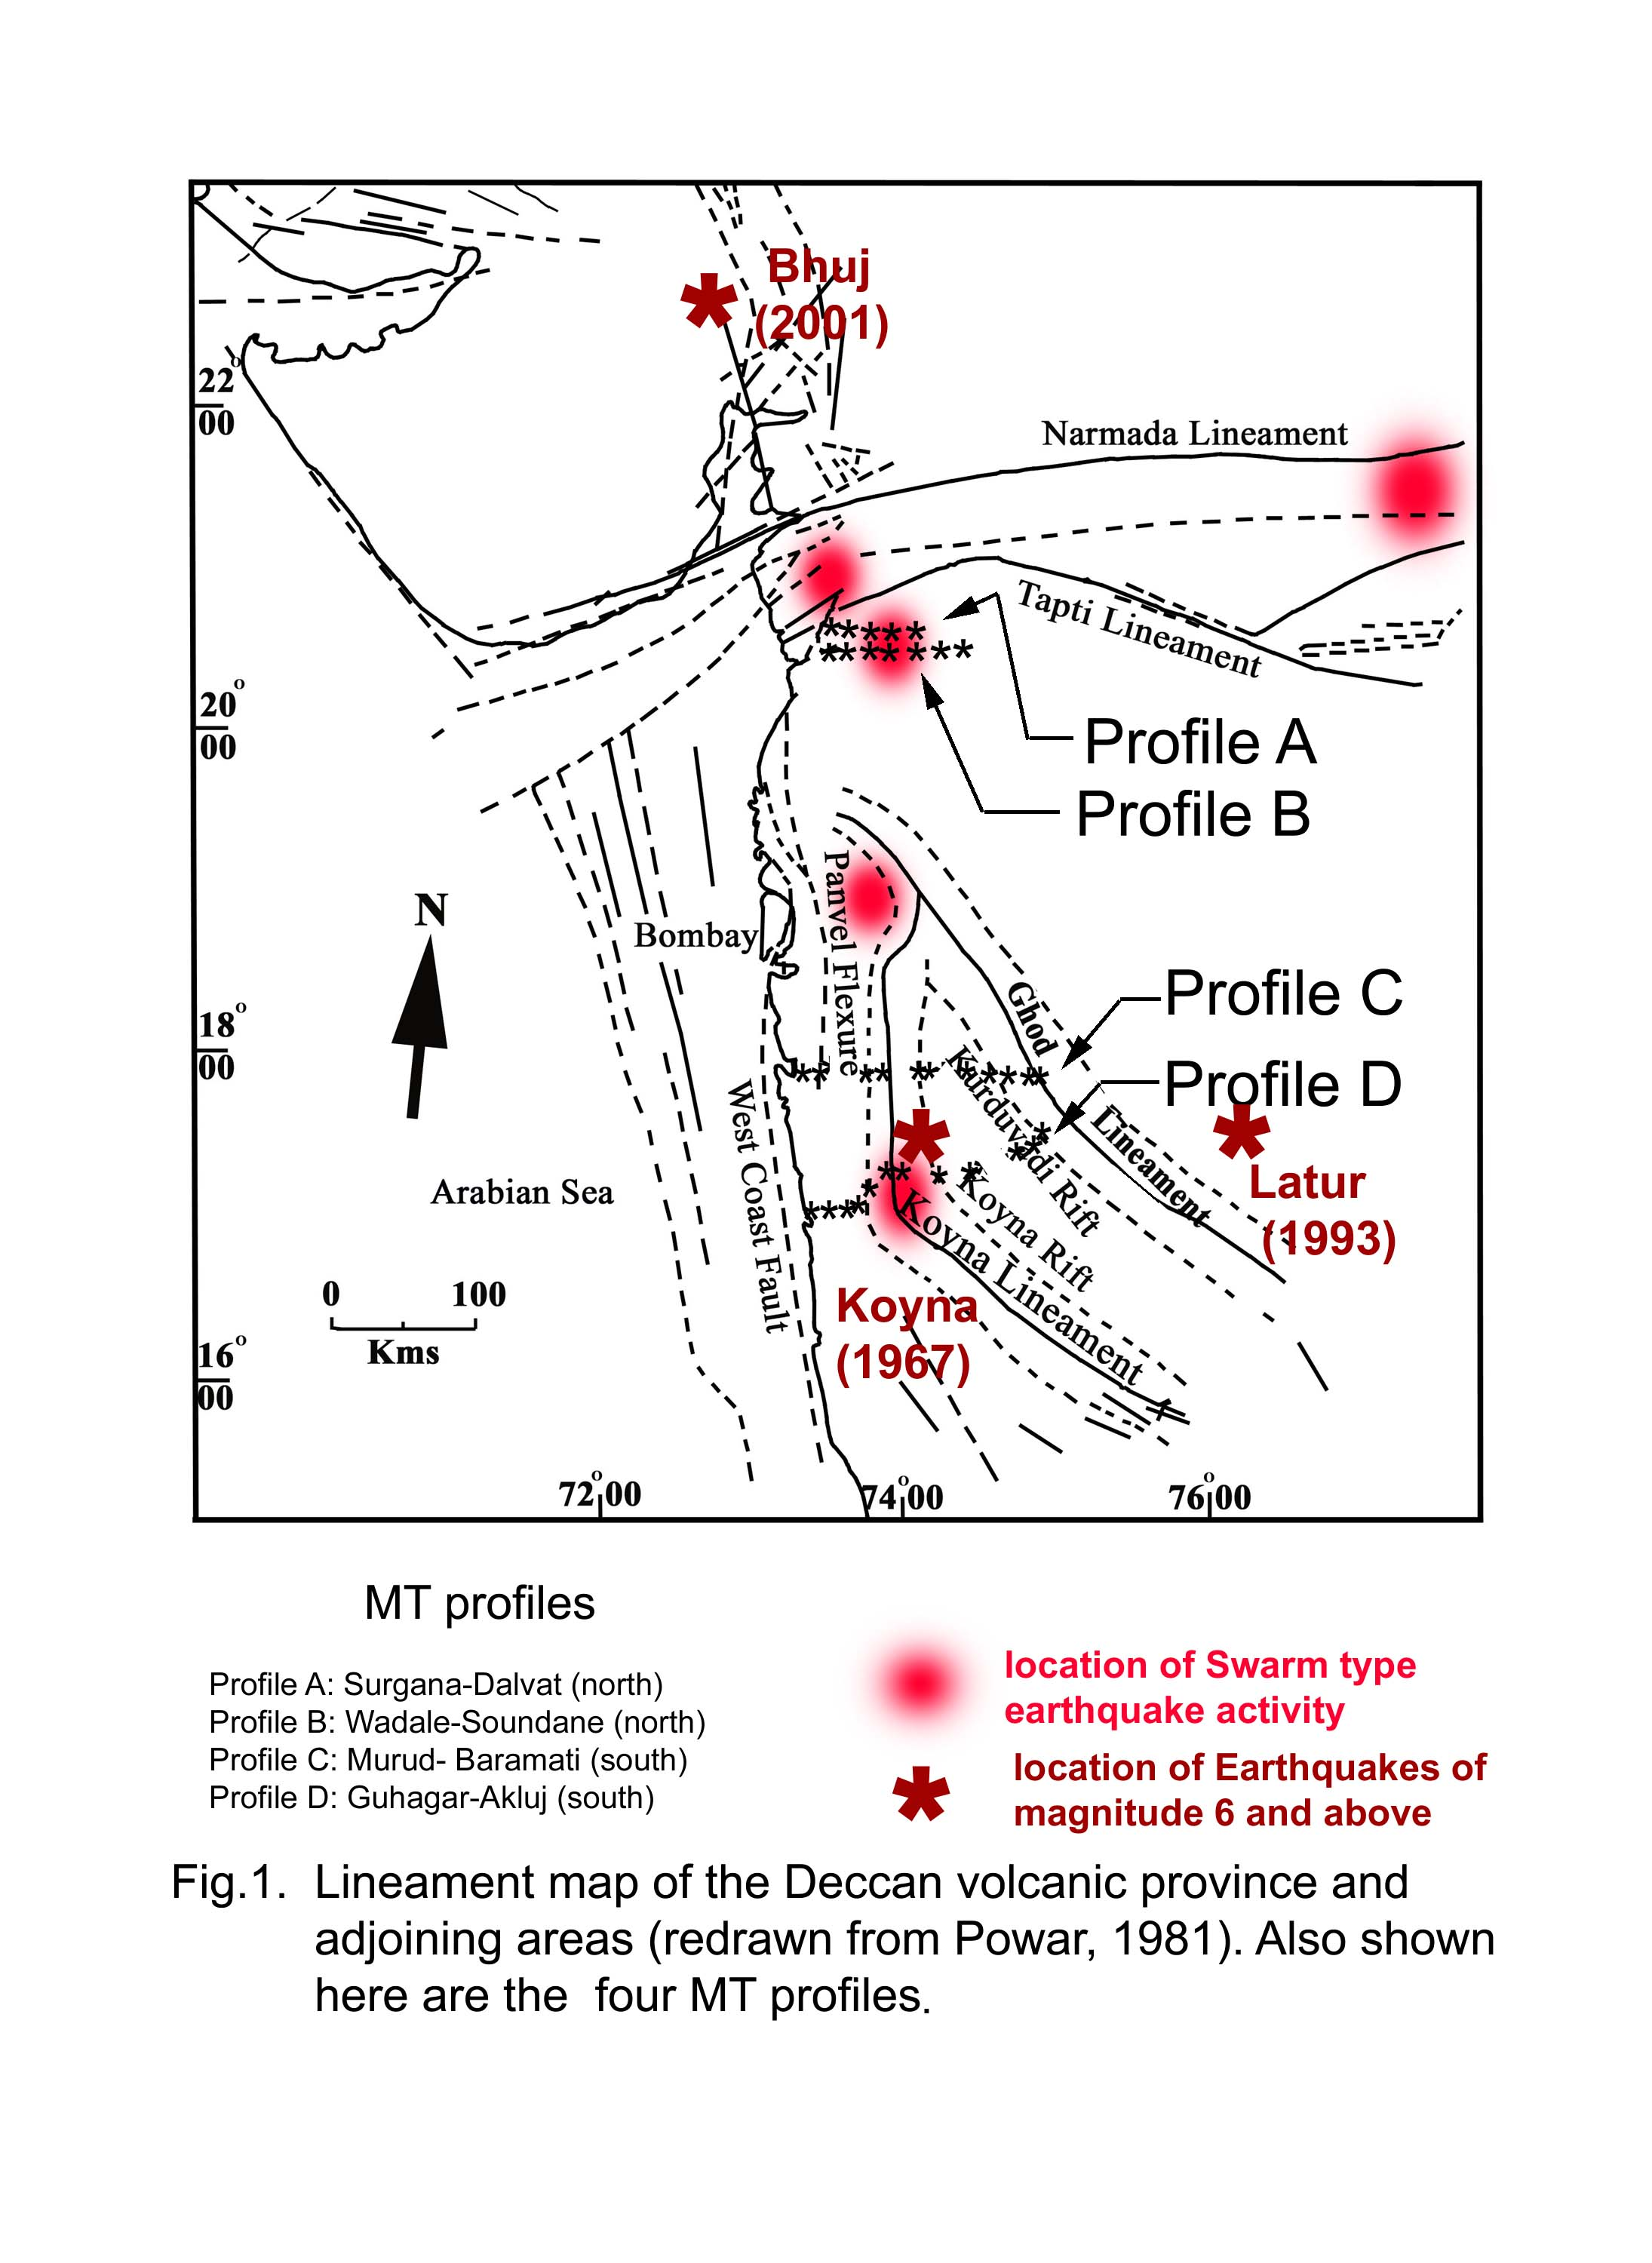
The Deccan volcanism was active at the Cretaceous-Tertiary boundary and at present up to about 29 basaltic flows have been documented in different parts of the Deccan volcanics (Wadia, 1975). Earlier workers believed that the eruption of Deccan volcanism was active from 110 Ma to about 30 Ma. However from the argon isochron age determination of the rock samples in different parts of the western DVP, Duncan and Pyle (1988) have observed that the entire episode of Deccan volcanism was a rapid process and may have lasted for only about one million years, near the Cretaceous Tertiary boundary. The basaltic flows show a gentle dip of less than 1o to the east where as in the close vicinity of the west coast, dips of about 4o are observed. There are no indications of any cone and crater type volcanism and hence the entire Deccan volcanism is believed to be due to the eruption of the magma through the fissures, located on the western and northern margins of the DVP. Being low viscosity fluids, the magma could flow long distances of more than 500 km to the east and south. As mentioned earlier, the tectonic history of the DVP dates back to the Precambrian, when the entire south Indian shield which underlies the Deccan volcanics was undergoing the tectonic and intrusive activity. Subsequent thermo-mechanical fluxes relating to the outburst of the Reunion hot spot and emplacement of the Deccan basalts on to the crust may also have contributed to the vertical movements of the crustal blocks. Recent earthquakes as well as the sporadic earthquake swarms in this region are indicative of the reactivation of the different faults. In order to explain this recent seismicty, Widdowson and Mitchell, 1999) proposed the possible vertical movements of the crustal blocks due to the removal of large quantities of the supra-crustal mass by erosion of the Deccan basalts. The tectonic map of the DVP is shown in figure 1. (Redrawn from Powar, 1981) along with the profiles covered by the magnetotelluric studies reported here. Some of the major lineaments of relevance to the present work are the NS trending Panvel flexure (Auden, 1949) and the Koyna and Kurduvadi lineaments (Krishnabrahmam and Negi, 1973).
The Bouguer gravity map of the DVP (after Kailasam et al., 1972) is shown in figure 2, along with the MT profiles. A prominent NS trending gravity high with steep gradients is located along the western margin near Mumbai. This has been attributed by Takin (1966) to the secondary magma chamber created during the Deccan volcanism. Several other gravity highs and lows observed in this figure are attributed to the geological formations located beneath the volcanics (Qureshy, 1981). The regional trends are predominantly NS near the west coast where as, those to the east show a preference for a NW-SE alignment and show a reasonable correspondence with those observed over the exposed parts of the granite greenstone belts of Dharwar. Rift valleys along Koyna and Kurduvadi were proposed on the basis of the regional gravity lows in the DVP by Krishnabrahmam and Negi, 1973). However the deep seismic as well as magnetotelluric studies have not delineated any rifts associated with the gravity lows (Kaila, et al., 1981a and b, Gokarn et. al, 1992).
The deep seismic sounding studies have been reported over two EW profiles, the first between Guhagarh and Chorochi and the second to the north, between Kelsi and Loni (Kaila et al., 1981a and b). The thickness of the Deccan volcanics is about 1.5 km along the western Margin of the Indian continent and decreases to about 0.6 km to the eastern part of the DSS profiles, with two prominent anticlinal features, one along the Panvel flexure and the other beneath the western ghats. These anticlines are separated by the escarpment of the western ghat mountain range. The crustal thickness over both these profiles is reported to be decreasing from a value of about 40 km beneath the western Ghats decreasing to about 30 km at the west coast.
Entire DVP has been experiencing sporadic seismic activity over the past several decades. The Koyna (1967) and Latur (1993) earthquakes of magnitude in excess of 6 Richter, are the major manifestations of the seismic activity. Several parts have experienced swarm type of sesmicity, which include the Koyna and adjoining areas, where more than 100,000 small earthquakes have been recorded over a period of three decades. From the data on about 400 seismic events recorded in this region, Rai et al. (2000) have identified three closely spaced clusters of seismic epicenters located along the western ghat escarpment zone. The P and S-wave velocity imaging using the seismic tomography indicate higher seismic velocities by about 4% in the seismogenic zone as compared with those in the adjoining regions at depths ranging from 3 to 75 km.
In order to delineate the geoelectric structure in the western DVP in the deeper crust, magnetotelluric studies were conducted over different EW oriented profiles over different parts of the west coast. Results obtained over four EW trending profiles in the western part of the DVP are discussed here. For the convenience of the discussion, the profiles are designated as profile-A (8 stations between Surgana and Dalvat), profile-B (13 stations between Wadale and Soundane), profile-C (16 stations between Murud and Baramati) and the profile-D (17 stations between Guhagar and Akluj).
Data collection and analysis
Four component magnetotelluric data were collected at 54 stations in all located over four profiles, A, B, C and D described earlier, in the frequency range 320-0.0005 Hz using the V-5 MT system procured from M/s Phoenix Geophysics, Canada. Two horizontal components of the magnetic field variations were measured by using the induction coils where as, the lead – lead chloride electrodes placed about 80-100 m apart along the magnetic NS and EW directions were used for measuring the electric field. A combination of fast Fourier transforms and cascade decimation technique (Wight and Bostick, 1980) was used for obtaining the auto and cross power spectra required for computing the frequency variation of the apparent resistivity and phase of impedance.
Regional strike direction
The impedance tensors at the all the stations were decomposed using the tensor decomposition procedure (Groom and Bailey, 1989). The unconstrained decomposition at individual frequencies indicated that the shear had a stable value at all frequencies at most of the stations. The shear was then constrained to its median value and the decomposition procedure was repeated with unconstrained twist and strike angles. This resulted in a marked improvement in the stability of the twist and the strike angles. The twist was varied in the vicinity of its median value to further decrease the frequency dependence of the observed strike angles. At some of the stations the strike, shear as well as the twist were rather unstable. In such cases the shear was fixed at different values at the intervals of 5 degrees and the value leading to stable strike and twist was identified. This procedure was then repeated with the twist and shear together, till a stable strike direction was obtained, which was accepted as the strike angle corresponding to the station under consideration.
Static shifts and two dimensional modeling:
The static shifts in the apparent resistivities result from the presence of resistivity inhomogenieties in the shallow surface. Due to the random distribution of such inhomogenieties it is not possible in general to either detect or estimate the static shifts using the theoretical treatment. Normally some empirical considerations are used for correcting the static shifts, depending upon the nature of the problem at hand. One of the methods is the key layer or the key parameter approach where in, the available information from other geophysical studies such as the borehole resistivity logs or the seismic studies, etc, is used to suitably correct the static shift in the apparent resistivity curves. Another method is based on the assumption that the deep resistivity contrasts lead to smooth variations in the spatial dependence of the apparent resistivities. Thus these are filtered to remove the short spatial wavelengths and the apparent resistivities in the TE mode at low frequency end are shifted so as to correspond to the smoothed values. The TM mode values are then tied to the respective TE mode curves at the high frequency end.
The thickness of the Deccan basalts is known in several places of the DVP and may be a candidate for the key layer for correcting the static shifts. This information was however not used for the static correction for two reasons. Firstly, the Deccan basaltic layer forms a conductive layer over the highly resistive crust. The bottom of the conductive layers is not a well constrained parameter in the MT responses and thus does not provide any effective constraints. Secondly, the pre-Trappean topography shows several undulations, which have been subsequently filled by the subsequent basaltic flows, leading to strong spatial variations in the thickness of the basaltic layer.
In view of the foregoing discussion, we decided to obtain the geoelectric structure using the GB decomposed apparent resistivities and impedance phases in the TE and TM modes. In order to accommodate the possibility of the static shifts, the errors on the input values of the apparent resistivities were increased by a factor of 10 before inverting the data, so as to decrease their weight in the inversion process. It seems reasonable to assume that by decreasing the weight of the apparent resistivities the phases of impedance will have a stronger influence on the resistivity structure. Since the phase does not contain any information on the true resistivities, the weak constraints imposed by the down-weighed apparent resistivities should be sufficient for constraining the true resistivity values. A uniform half space with a resistivity of 100 Ω-m was used as the starting model for the 2-D inversion scheme (Rodi and Mackie, 2001).
As mentioned earlier MT studies were conducted over four EW trending profiles over the western part of the DVP. The foregoing analysis procedure was adopted uniformly to obtain the geoelectric section over all the profiles and hence only the profile specific details will be mentioned in the discussion to follow.
Geoelectric structure over the Southern profiles, C and D
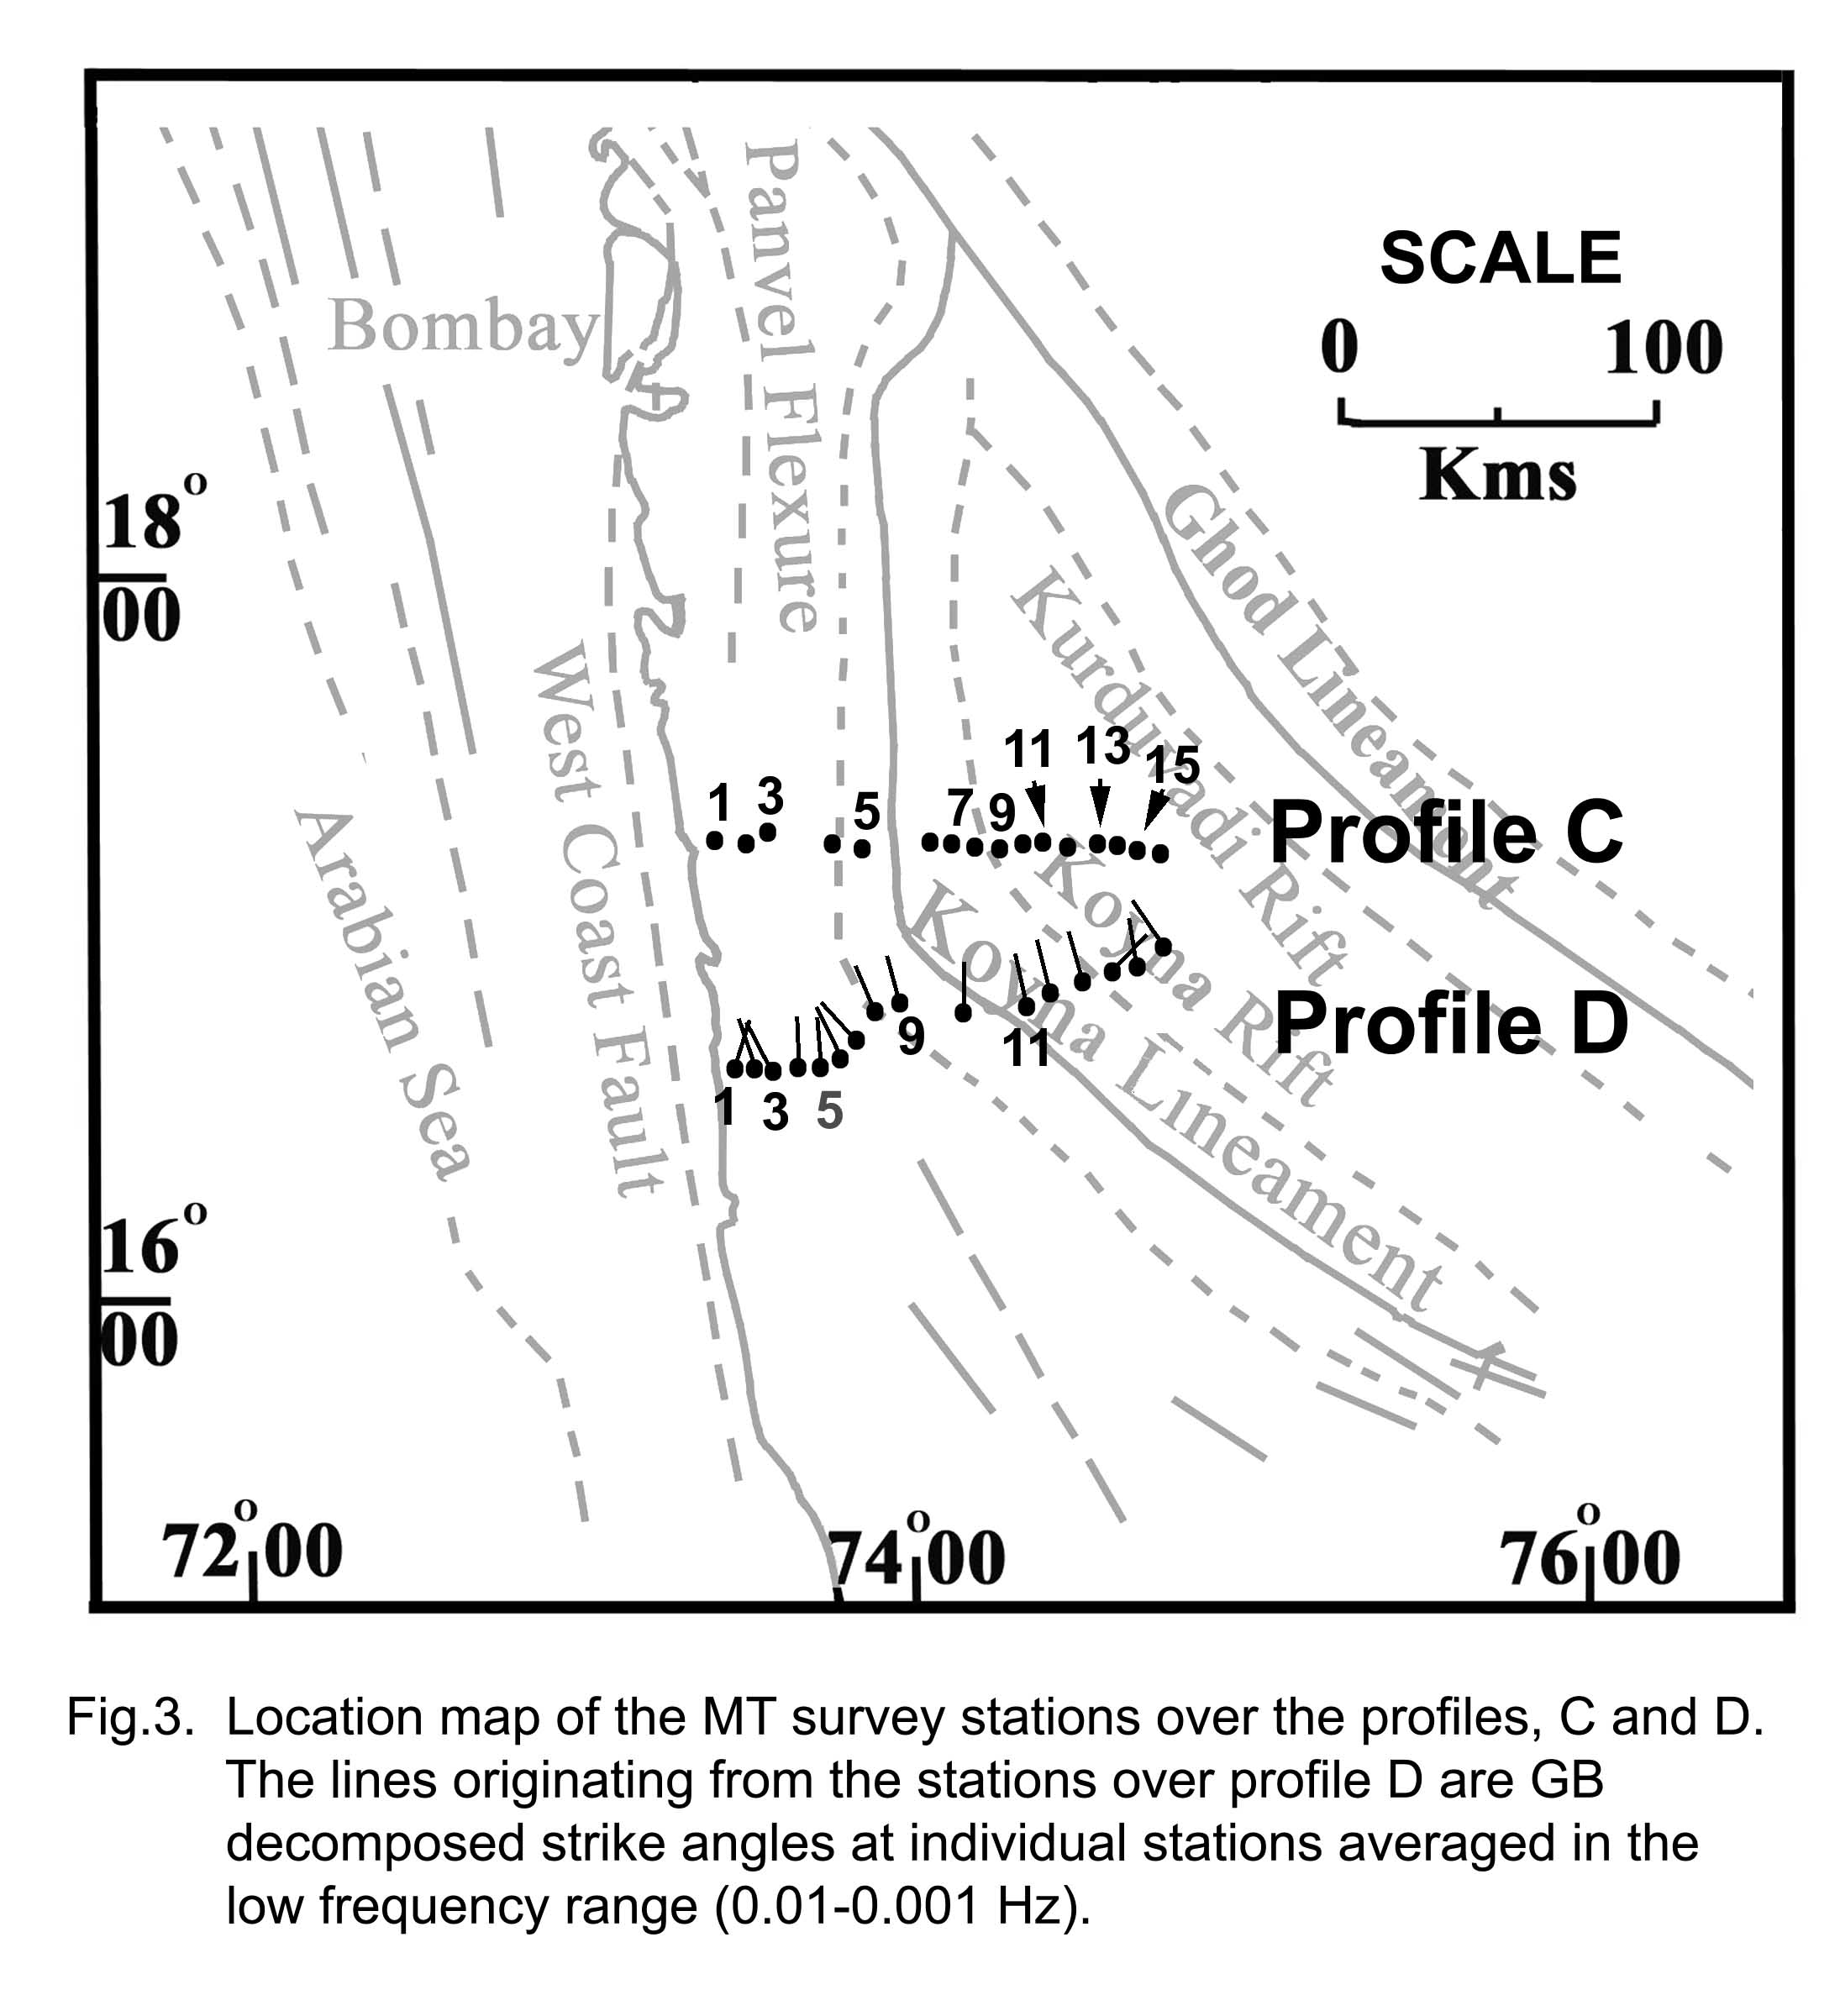
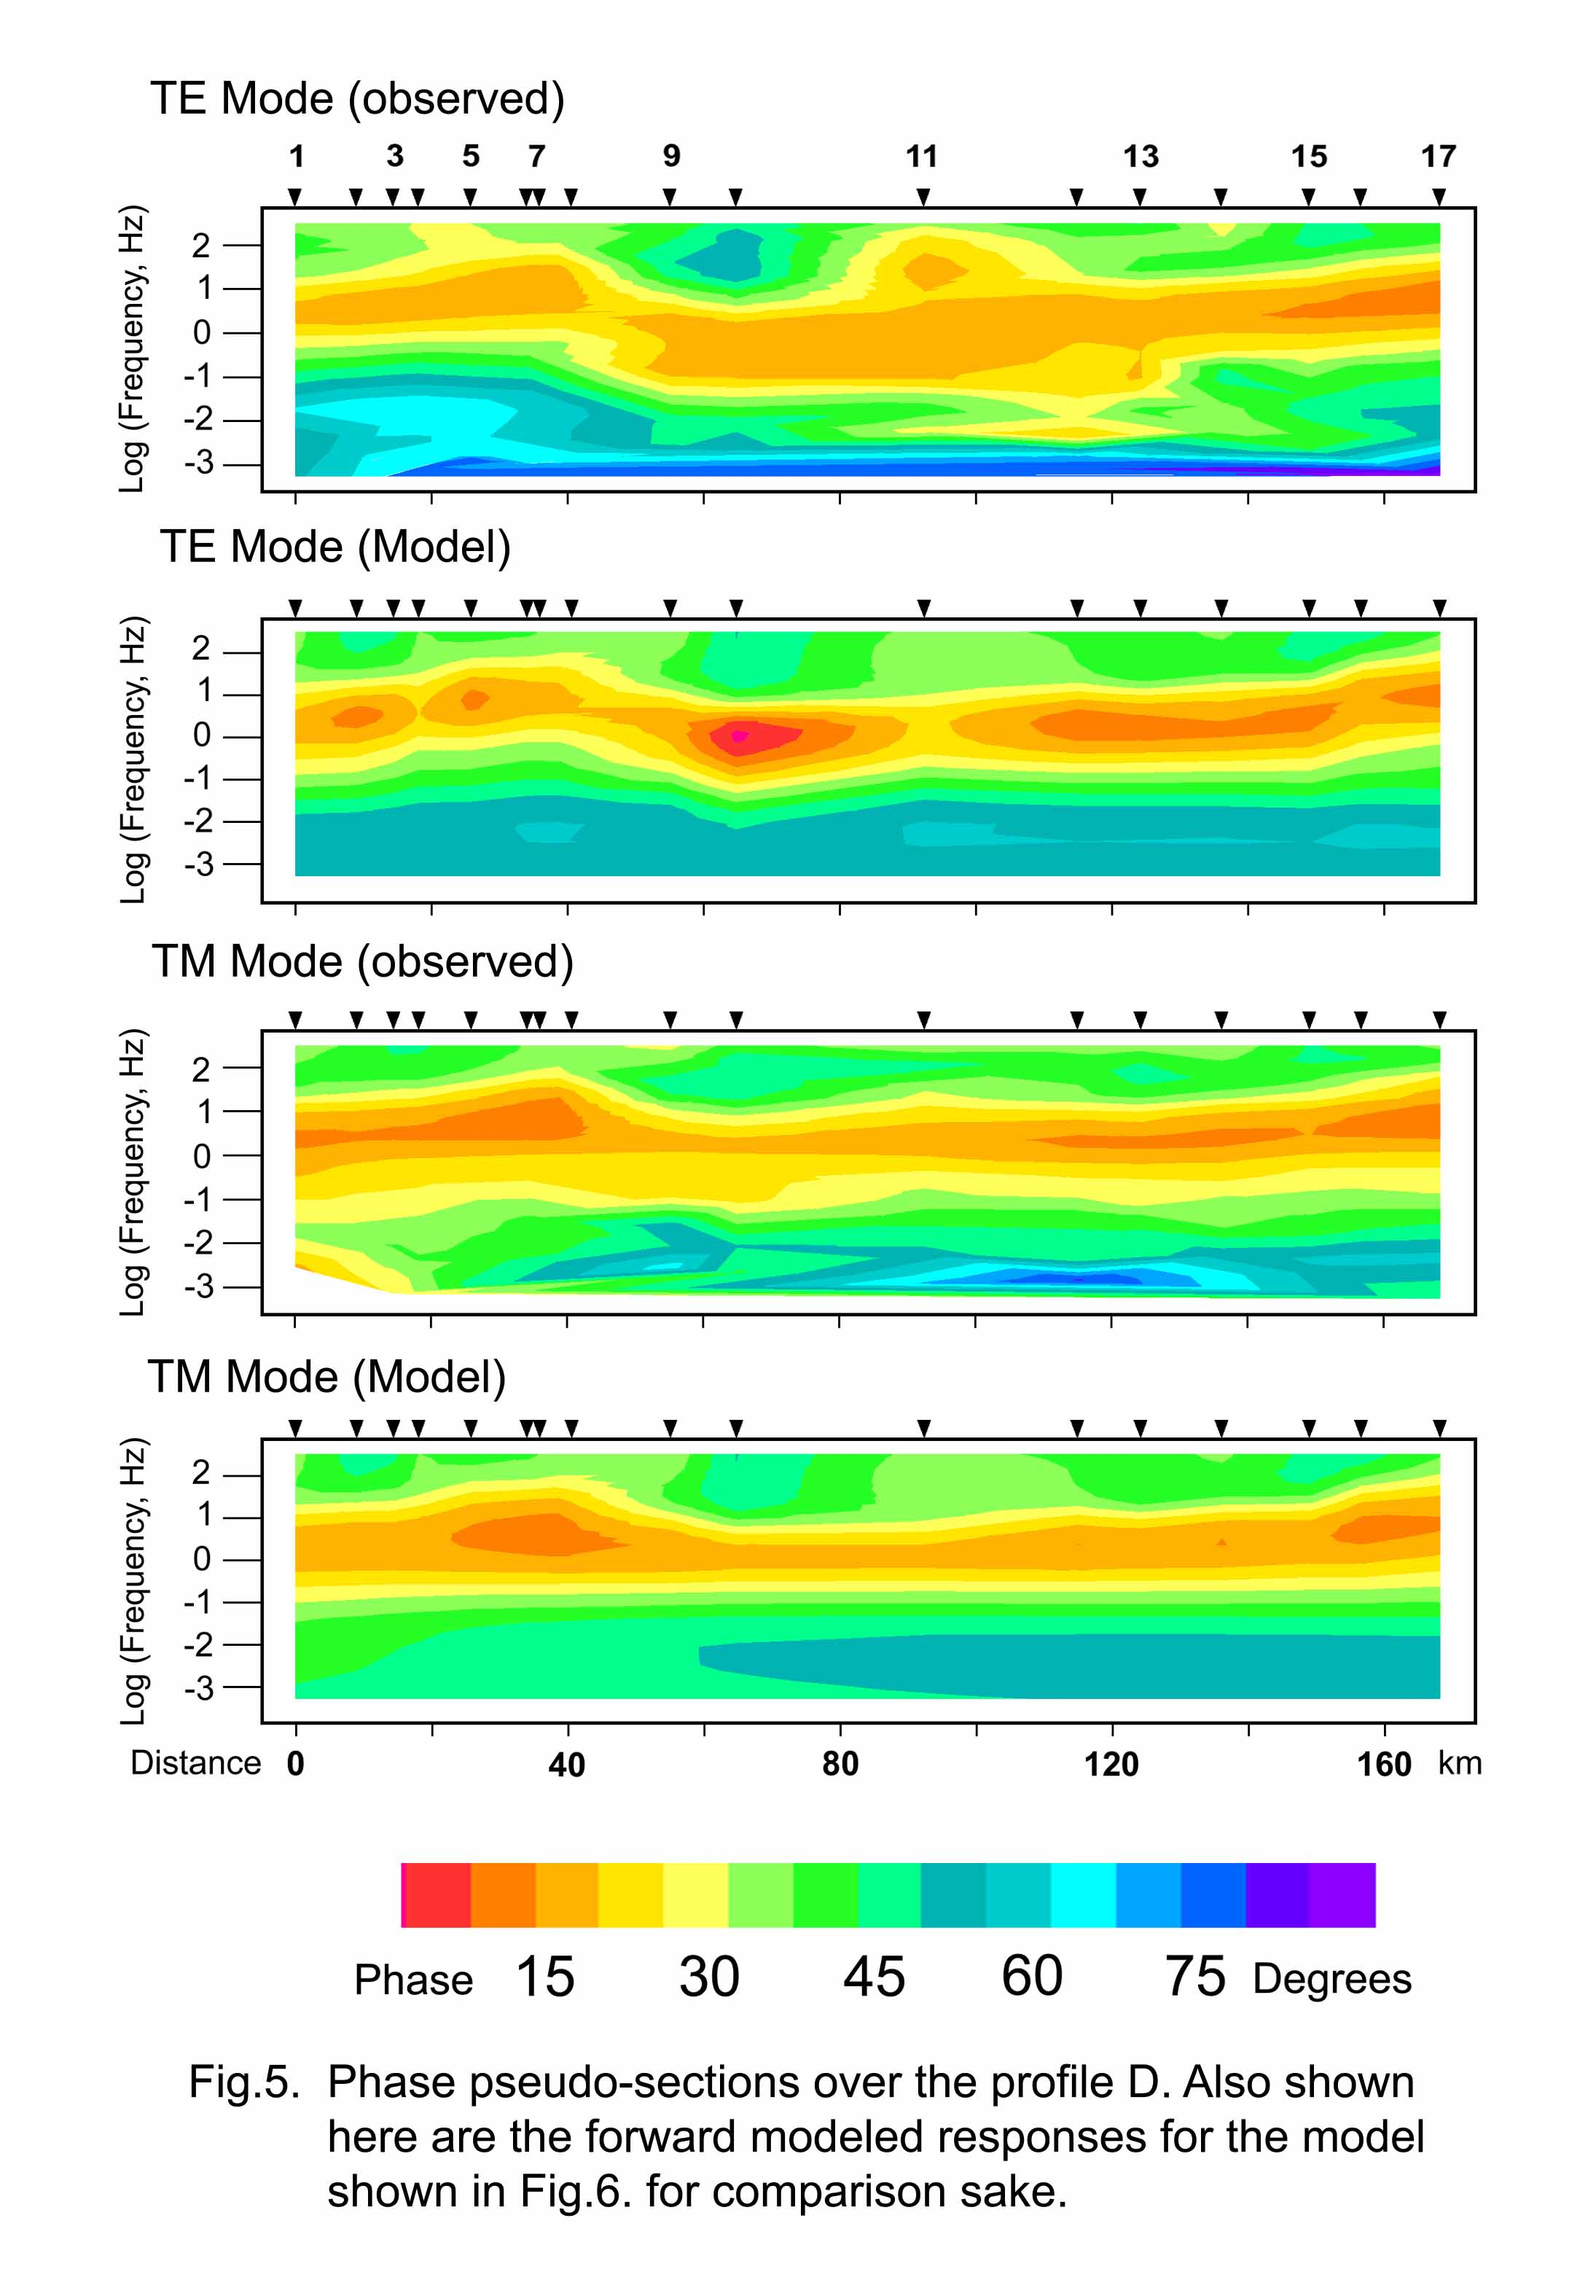
The location map of the MT stations over the profiles C and D is shown in figure 3, along with the major tectonic elements in the southern DVP. Here the lines originating from the solid circles marking the station positions over the profile D are the GB decomposed strike angles averaged at low frequencies (0.01-0.001 Hz.) at individual stations. These strike angles show an alignment with the N20oW direction. The major geological tectonic features such as the Panvel fluxure and the western ghats show an approximately NS orientation. In view of this fact, this direction was chosen to be the regional strike angle and the response functions rotated along this direction were assumed to be the TE mode values and those perpendicular to this, the TM mode values. The apparent resistivity and phase pseudo-sections in the TE and TM mode observed over the profile-D are shown in figures 4 and 5 respectively. The corresponding pseudo-sections obtained by forward modeling the geoelectric section are also shown here. The geoelectric cross section was obtained by inverting a uniform half space. Here the tau parameter was set at 5 and the resultant RMS misfit after 45 iterations was 2.5. The shallow and deep sections of the geoelectric structure are shown in figure 6. The deep section has a vertical exaggeration of 1.
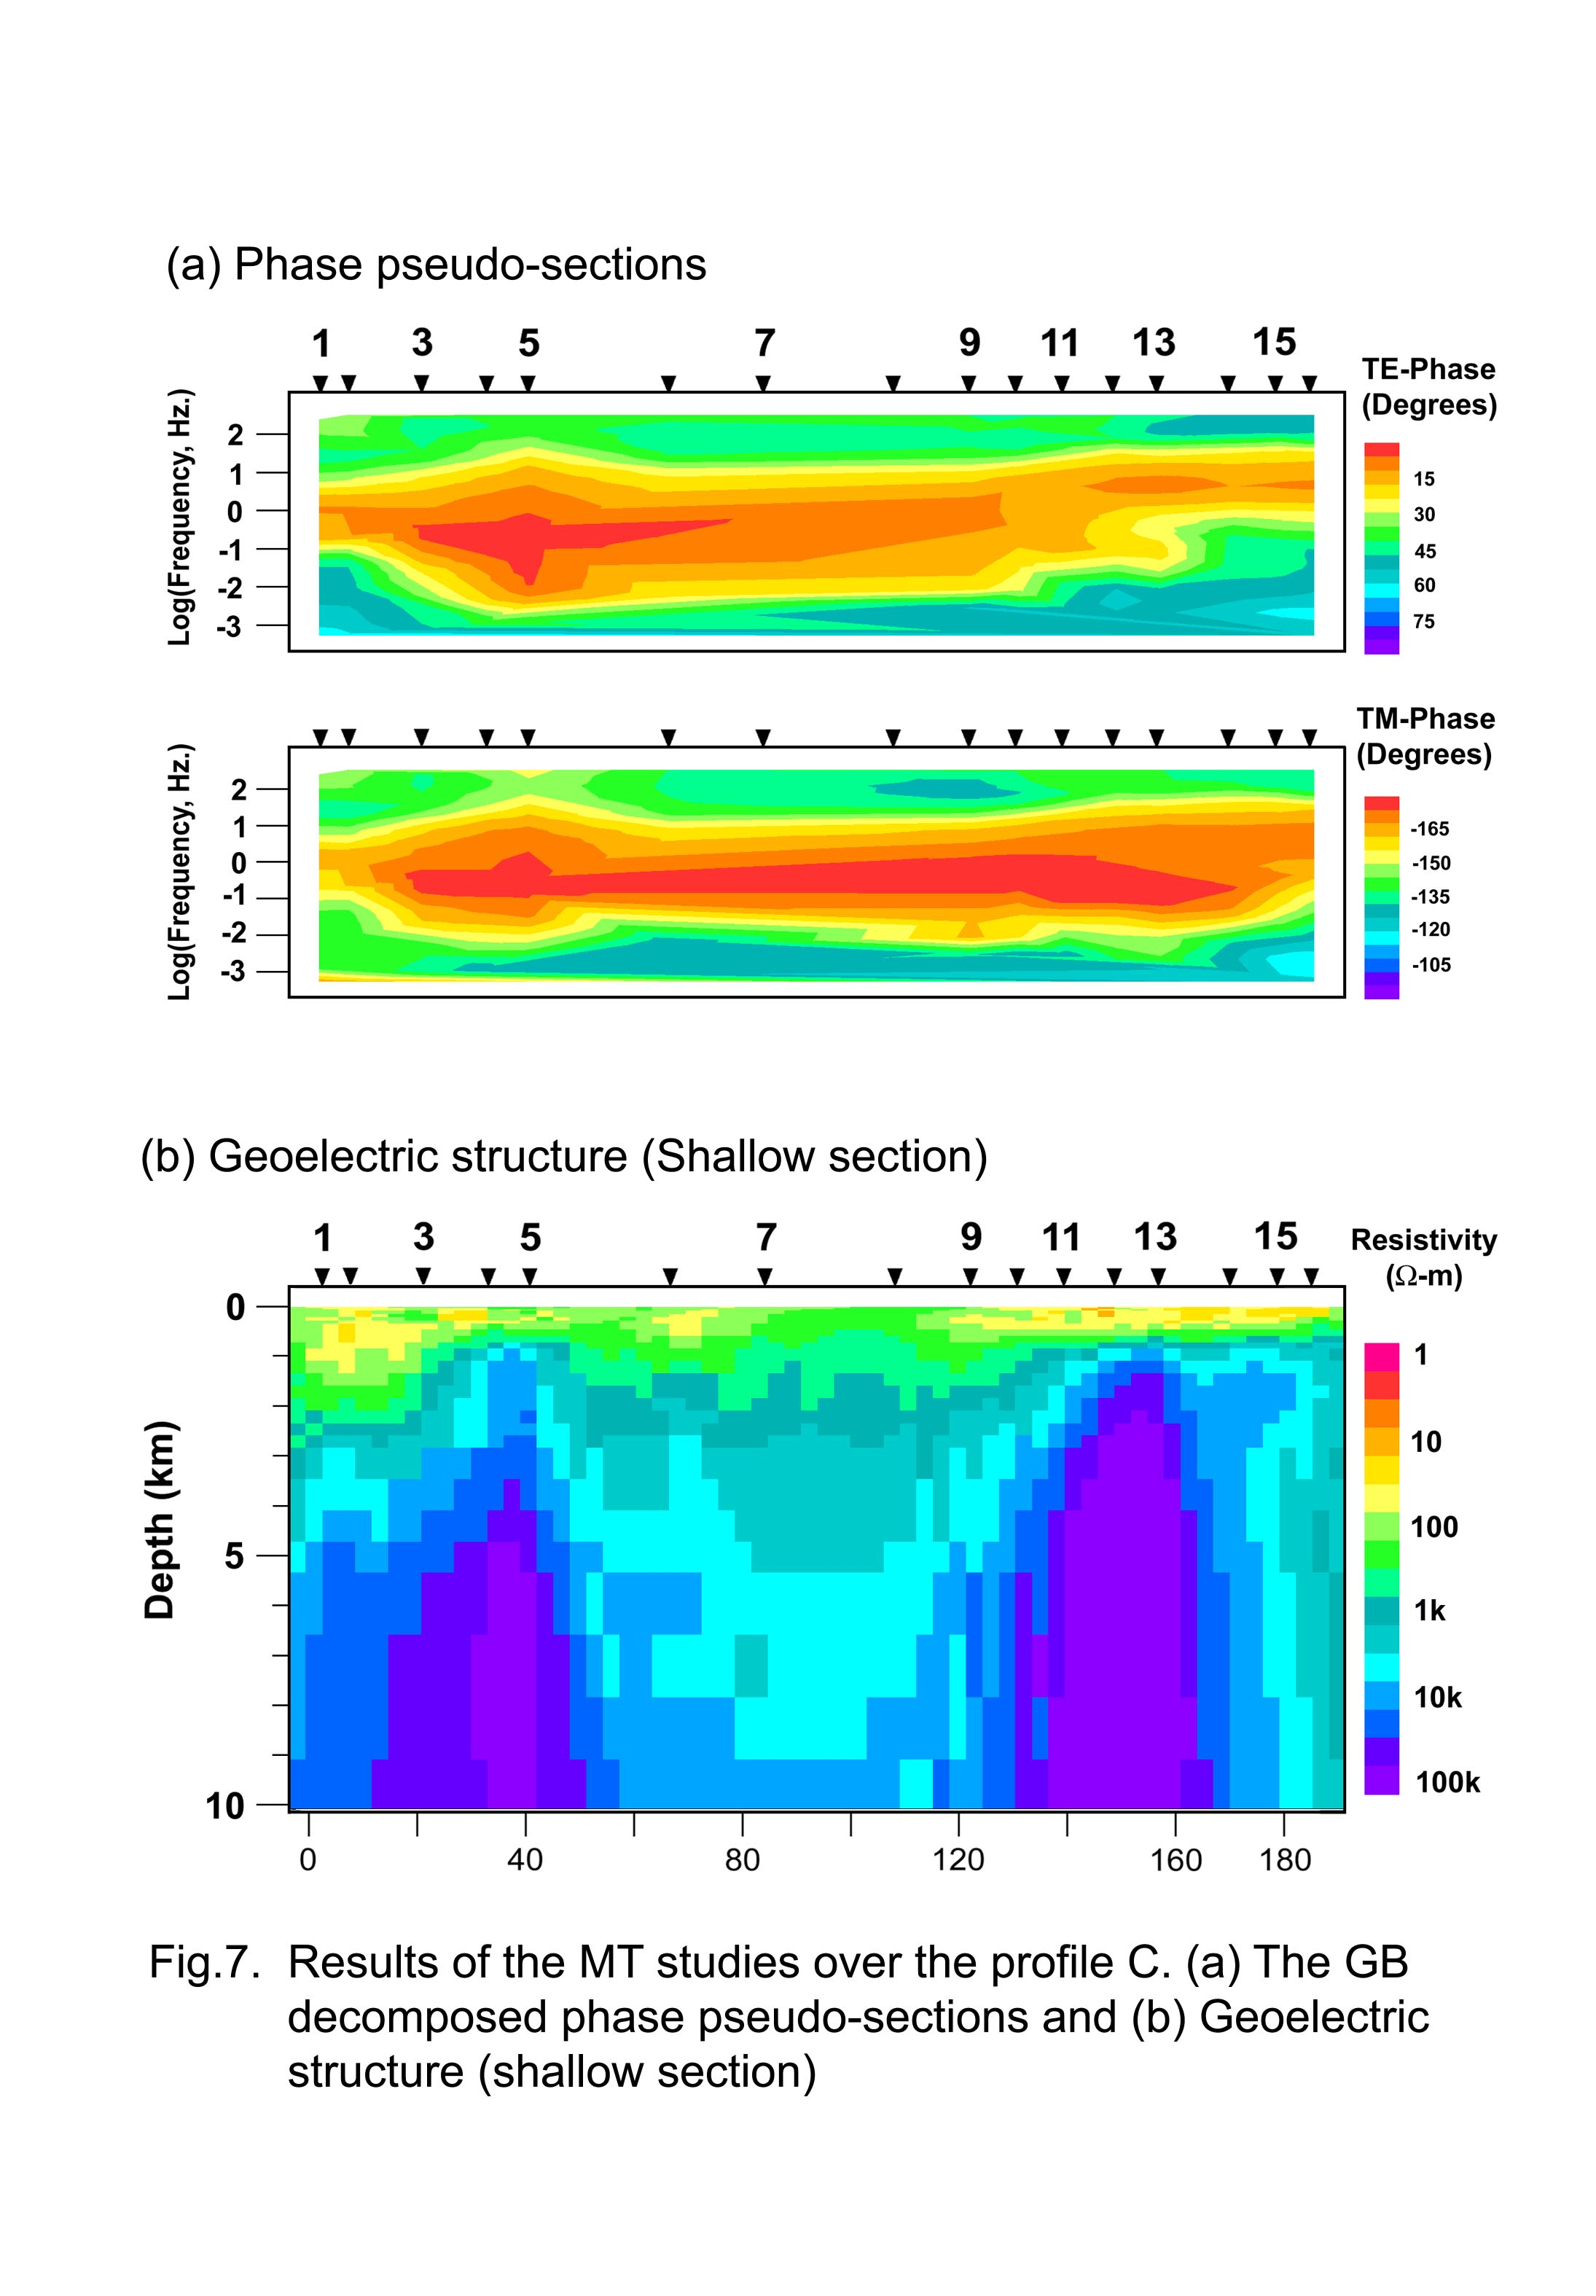
The data over the profile C were analysed using similar procedure and the two dimensional inversion of Rodi and Mackie (2001) performed with a tau factor of 5 and after 45 iterations, an RMS misfit of 5.1 was observed. The GB decomposed phase pseudo-sections over the profile C are shown in figure 7 (a). The shallow section of the geoelectric structure is shown in figure 7 (b). The phase pseudo-sections show a very low (near zero) phase over the central part of the profile between stations 3 and 7 in the mid-frequency range of 20-0.005 Hz. This trend although less prominent, continues to the east up to the station, 13 to the east. These stations are located in the close proximity of approximately 20-50 km from the outskirts of the city of Pune, which is a well spread, industrialised city. Strong cultural noise, including the heavy vehicular traffic as well as the ground noise due to the power distribution system, may be expected, leading to the contamination of the magnetic as well as the electric field data. Thus even the remote reference data analysis may not be adequate for the noise removal. In view of these difficulties, only the shallow section could be obtained with sufficient degree of confidence in this region.
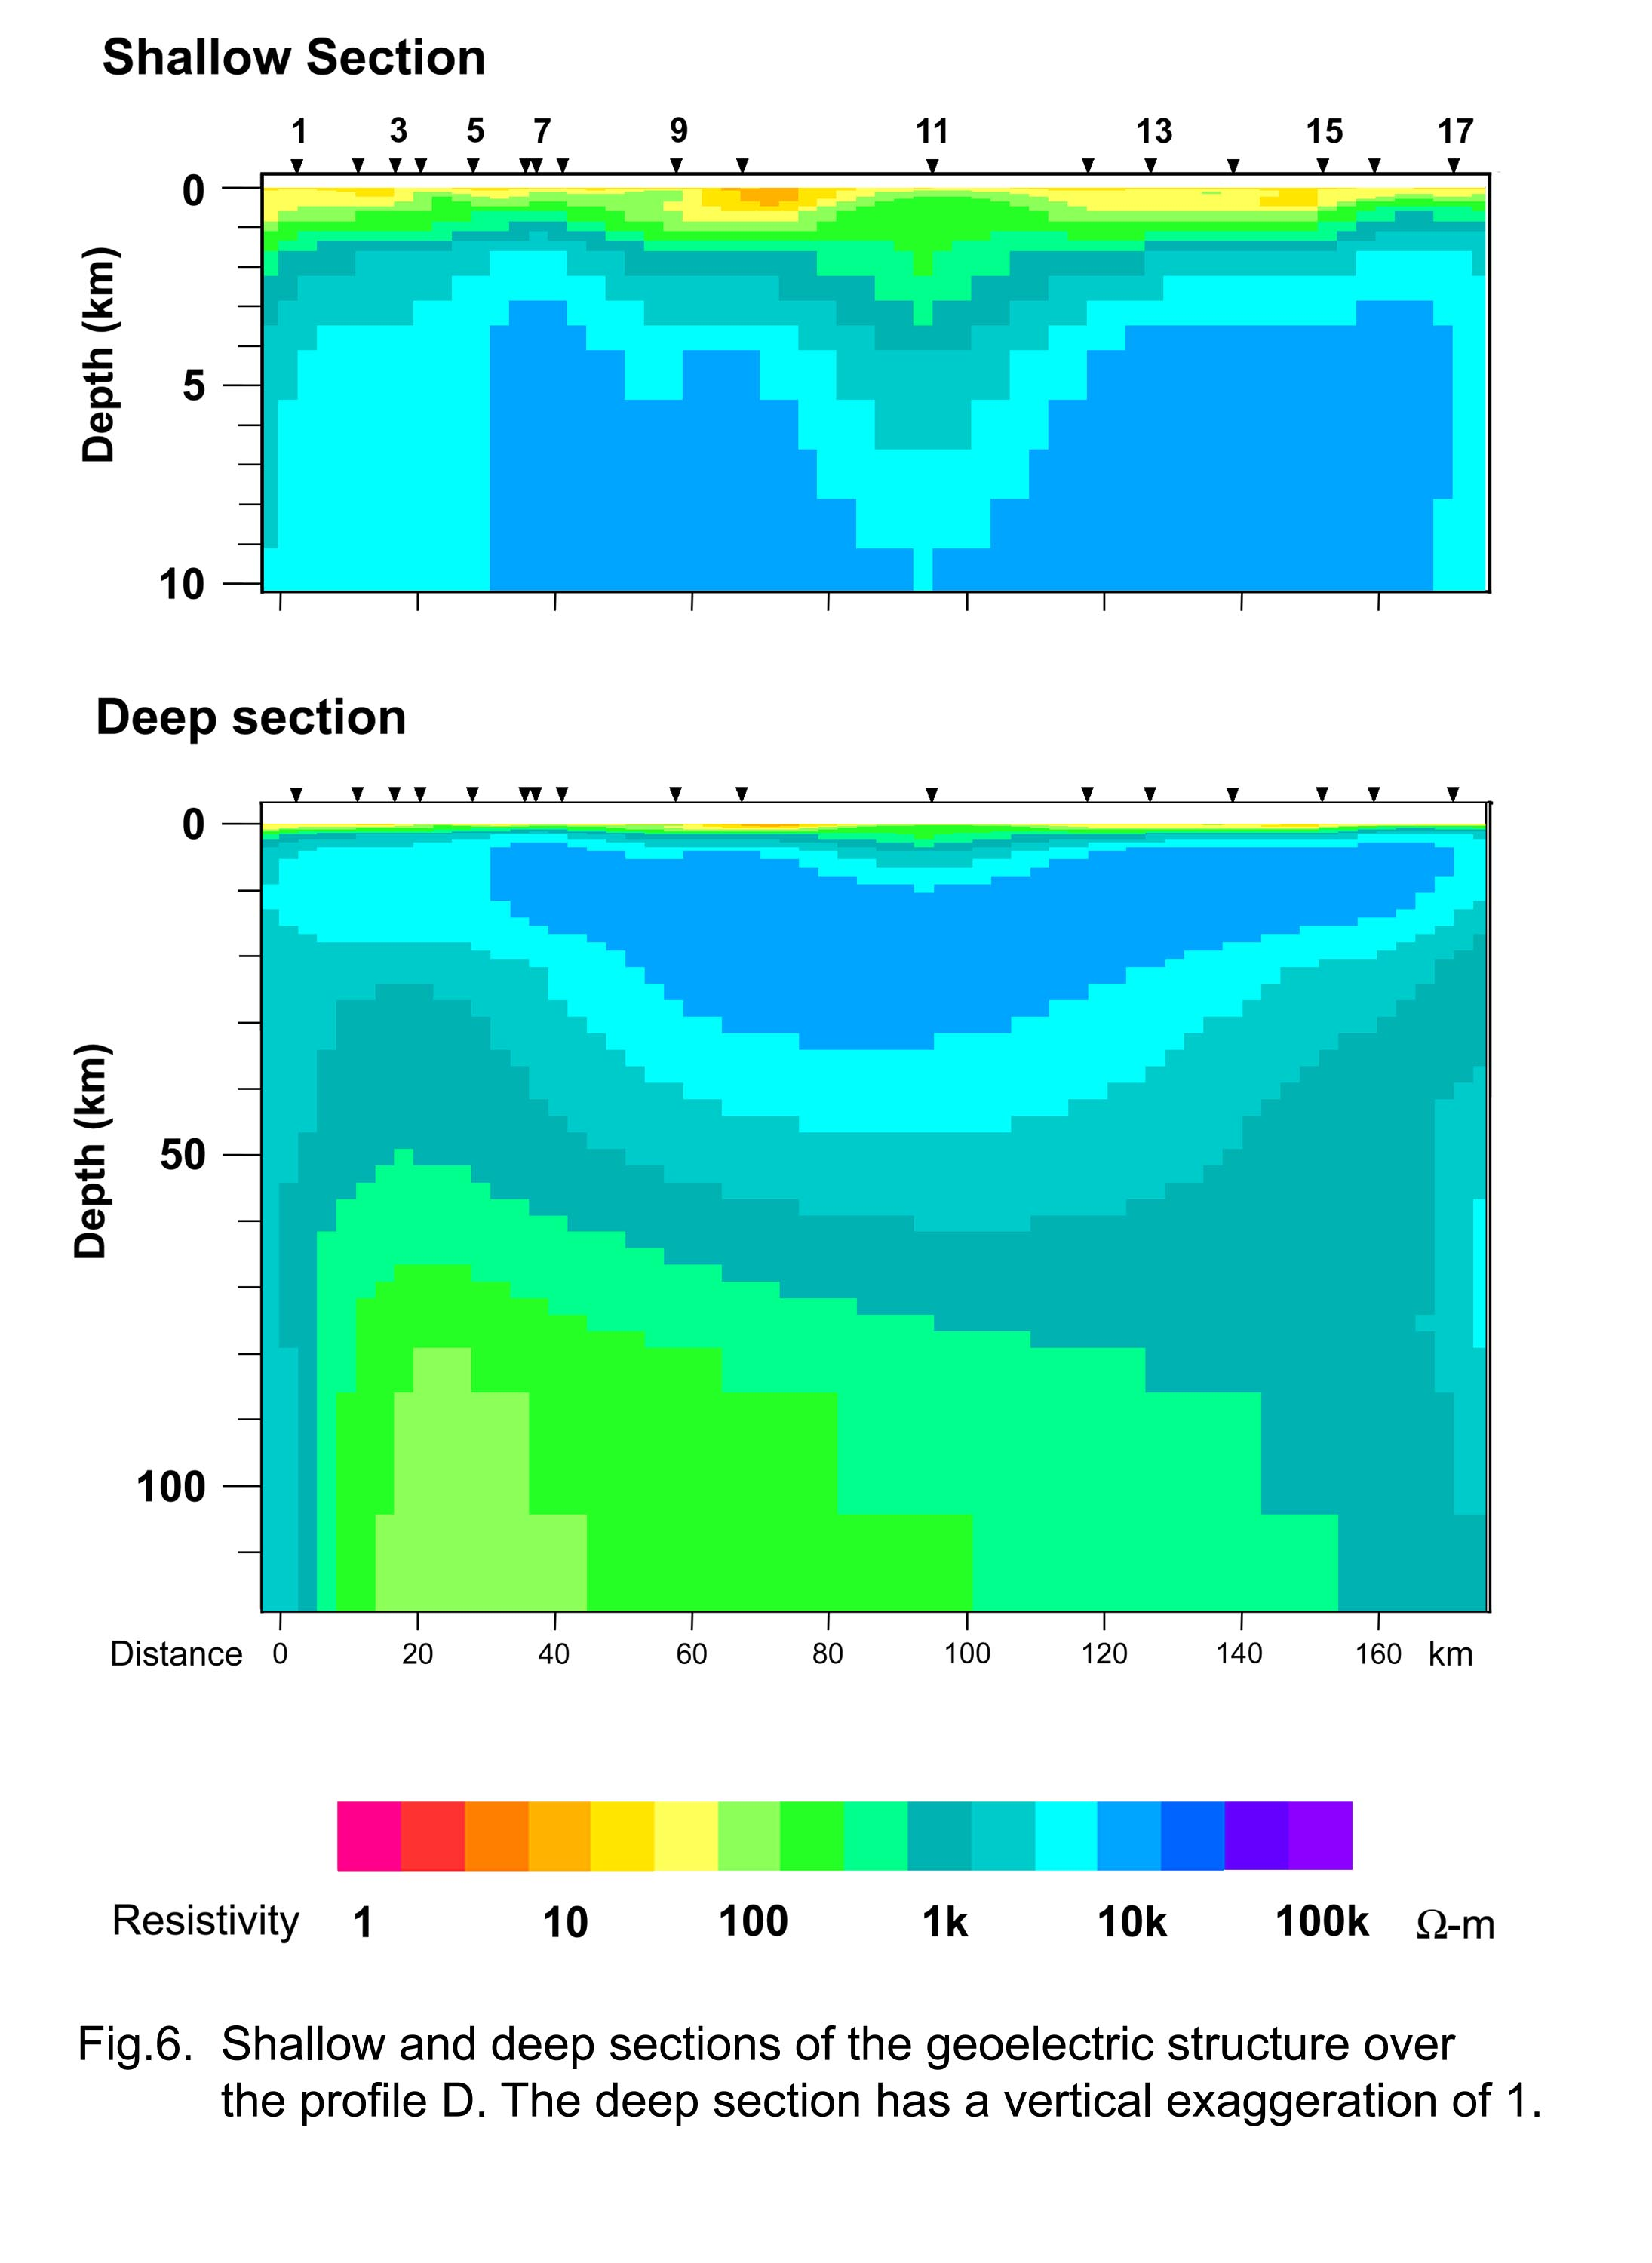
The shallow section over the profile D (Figure 6) shows a top layer with resistivity in the range of 50-200 Ω-m and thickness varying between 1 and 3 km. This layer predominantly comprises of the Deccan basalts. The broad syncline beneath the station 11 corresponds to the western ghat escarpment with the Panvel flexure delineated to the west between stations 5 and 9 on profile D to the west. The thickness of the Deccan traps observed here are higher than the values of 0.6 - 1.5 km observed from the DSS studies, although the spatial variation of the pre-Trappean crust shows a good correspondence with the DSS observations. This difference may be due to the possible pre-Trappean sediments deposited prior to the Deccan volcanics, which could not be distinguished from the overlying Deccan basalts. It may also be noted here that the bottom of the conductive layers is not well constrained in the MT studies. The shallow geoelectric structure over the profile C (Figure 7b) shows similar variations in the trappean thickness and the topography of the pre-Trappean crust. Entire crust beneath the Deccan basalts has a high resistivity of more than 1000 Ω-m. There is an indication of the lower resistivities in the lower crustal depths over the eastern part of the profile D. This is in agreement with our earlier studies in the eastern DVP (Gokarn et al.,1992), where a deep crustal conductor is observed at depths of 12-18 km.
The synclinal feature observed in the pre-Trappean crust beneath the stations 3 and 9 (profile D, Figure 6) and stations 3 and 5 (profile C, Figure 7b) correspond to the Panvel flexure and the syncline to the east is located beneath the western ghat mountains. It is evident from the observed thinning of the volcanics beneath the Panvel flexure that this may have formed either during or prior to the Deccan volcanism. The emplacement of the basalts and the post trappean weathering and erosional effects however, may have contributed to the vertical tectonic block movements along this feature during the subsequent times.
The lithospheric mantle at depths greater than 50 km is highly anisotropic, with resistivities varying in the range of about 100 Ω-m beneath stations 3 and 8 to greater than 1000 Ω-m on the eastern part of the profile. The high conductivity on the western part is a well delineated feature on the responses, as is evident from the high phases observed at low frequencies (< 10 Hz) in the TE mode in figure 5. As mentioned earlier due to the suspected contamination of the MT data in the mid-frequency range over the profile C, the deeper structure could not be deciphered to acceptable degree of confidence. The TE-phase pseudo-sections (Figure 7.a) indicate a high impedance phase of more than 45 degrees at low frequencies (< 0.03 Hz) beneath the stations 1 and 3 on the western part of the profile C, indicative of a high conductivity at the deep levels, presumably corresponding to the lithospheric mantle. This observation permits us to propose that the conductive feature over the profile D may be located beneath the stations 1 and 3 over the profile C and seems to be trending along the NW-SE.
Geoelectric structure in the northern DVP (Profiles A and B)
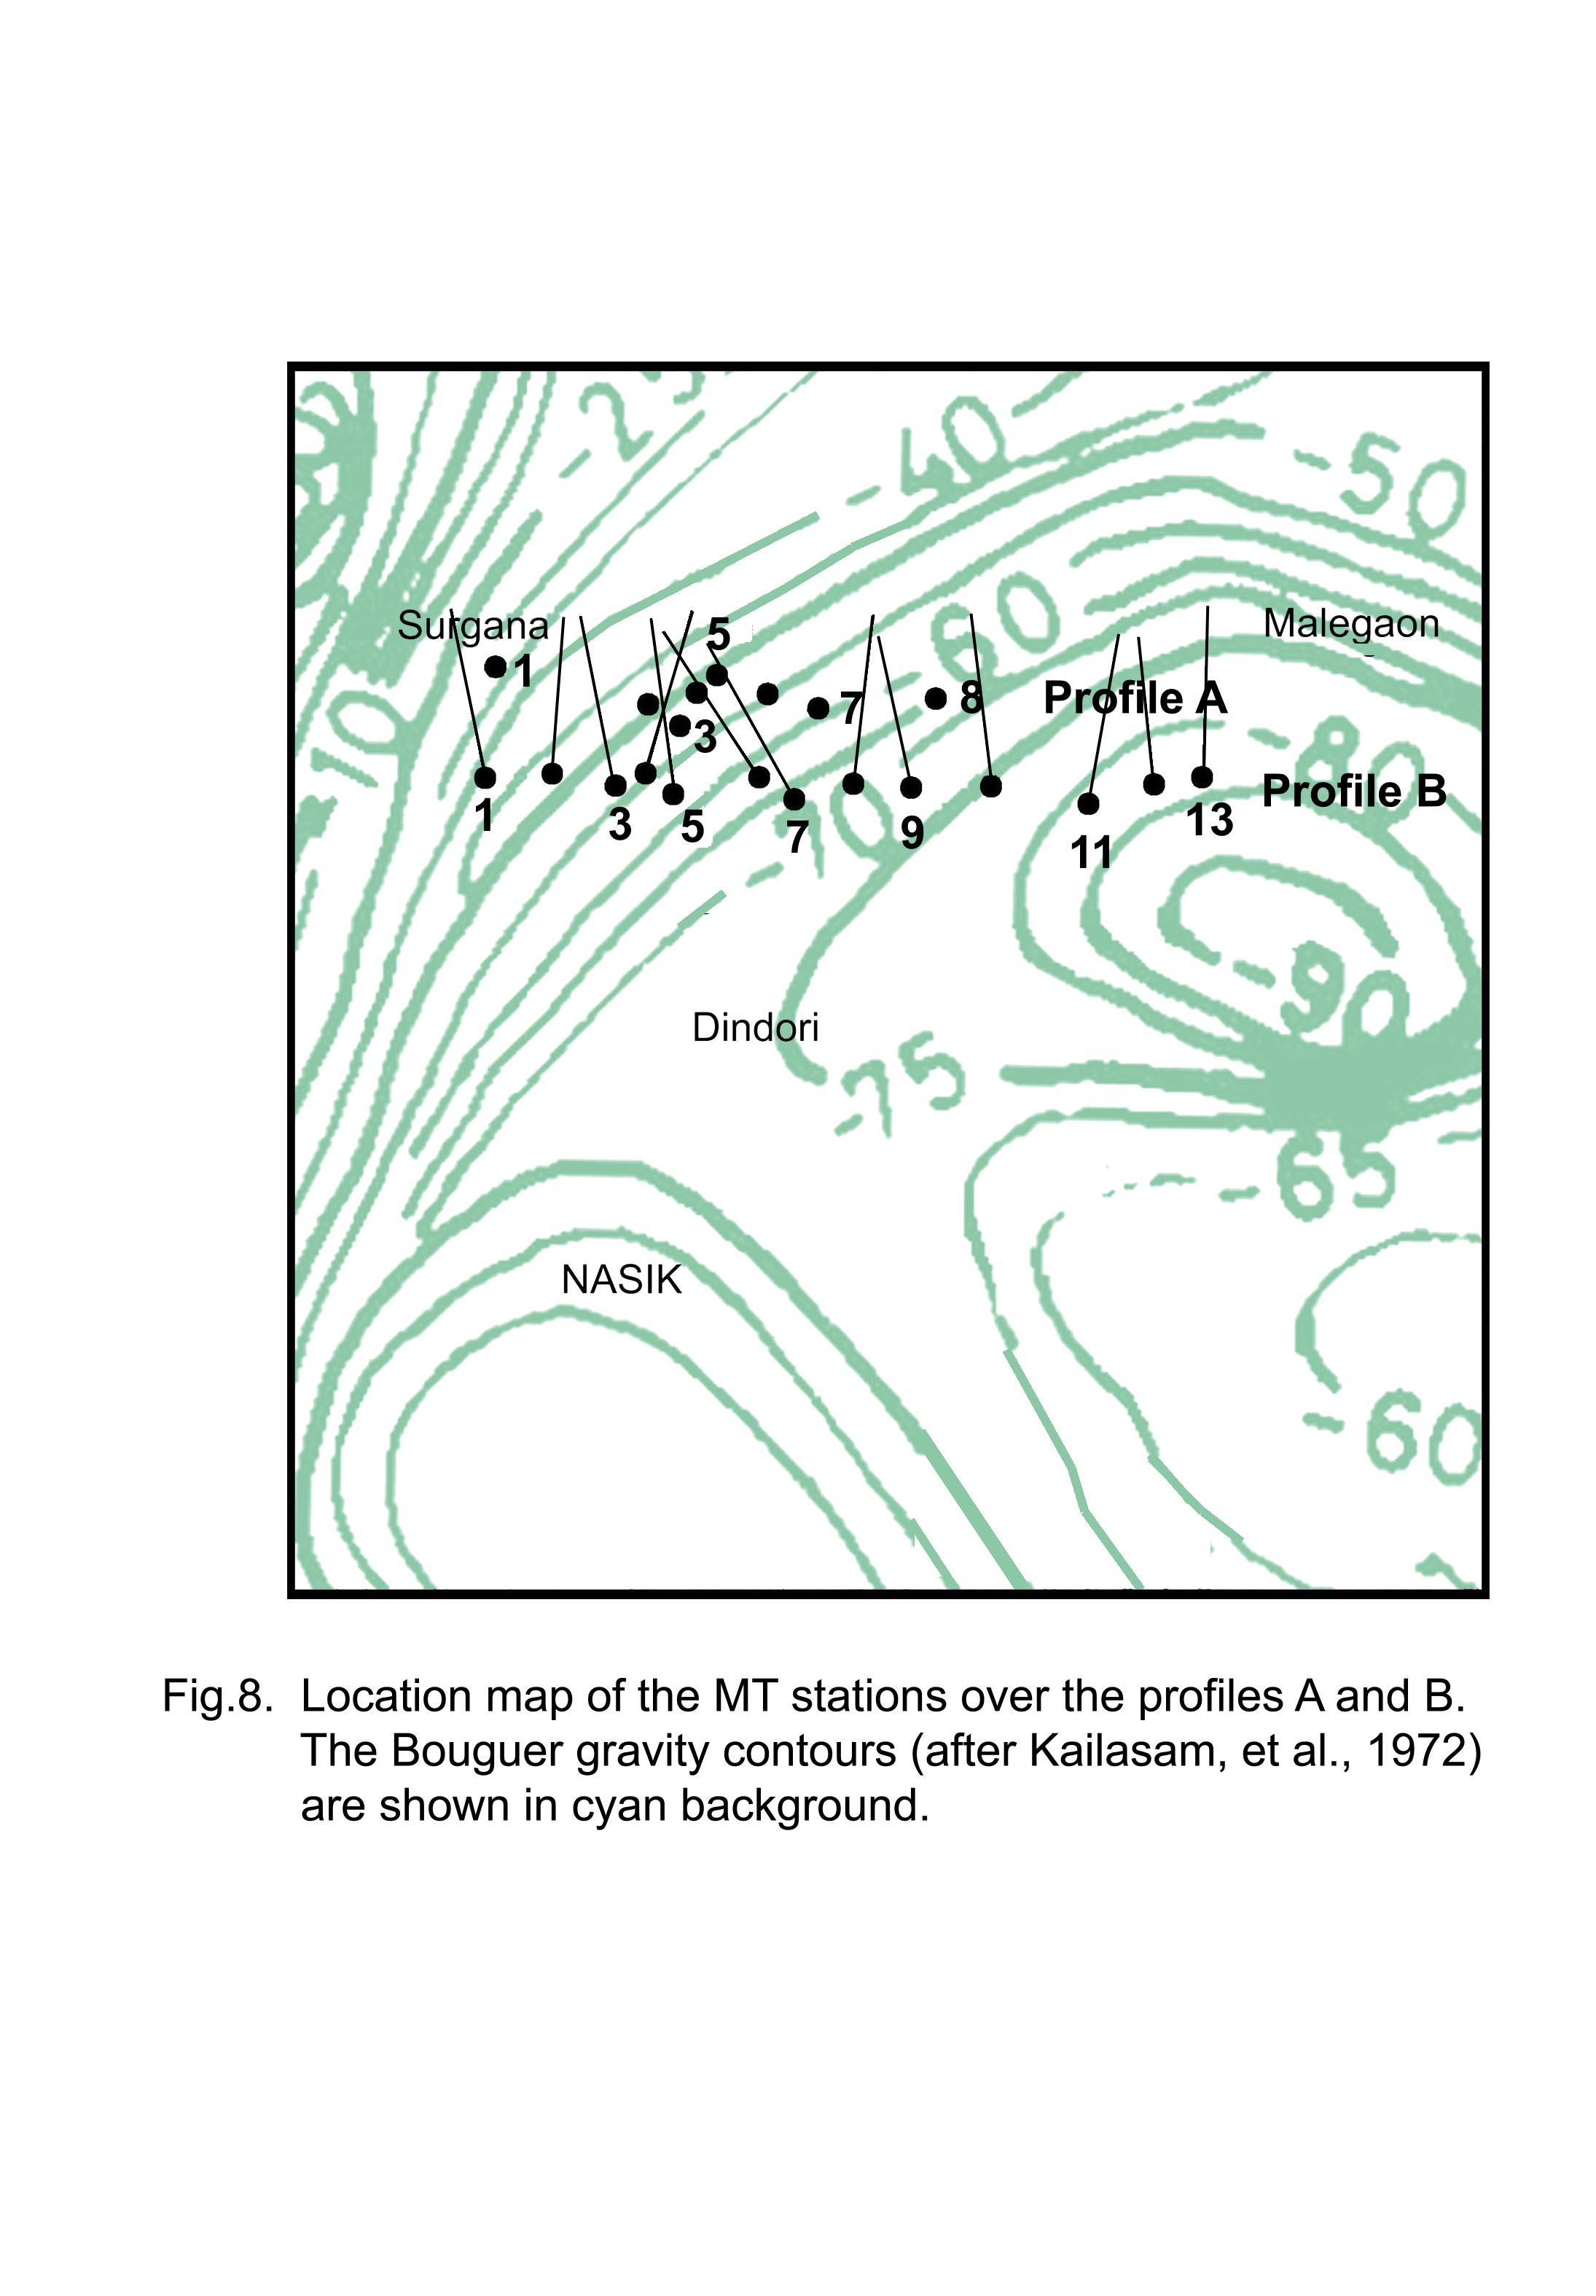
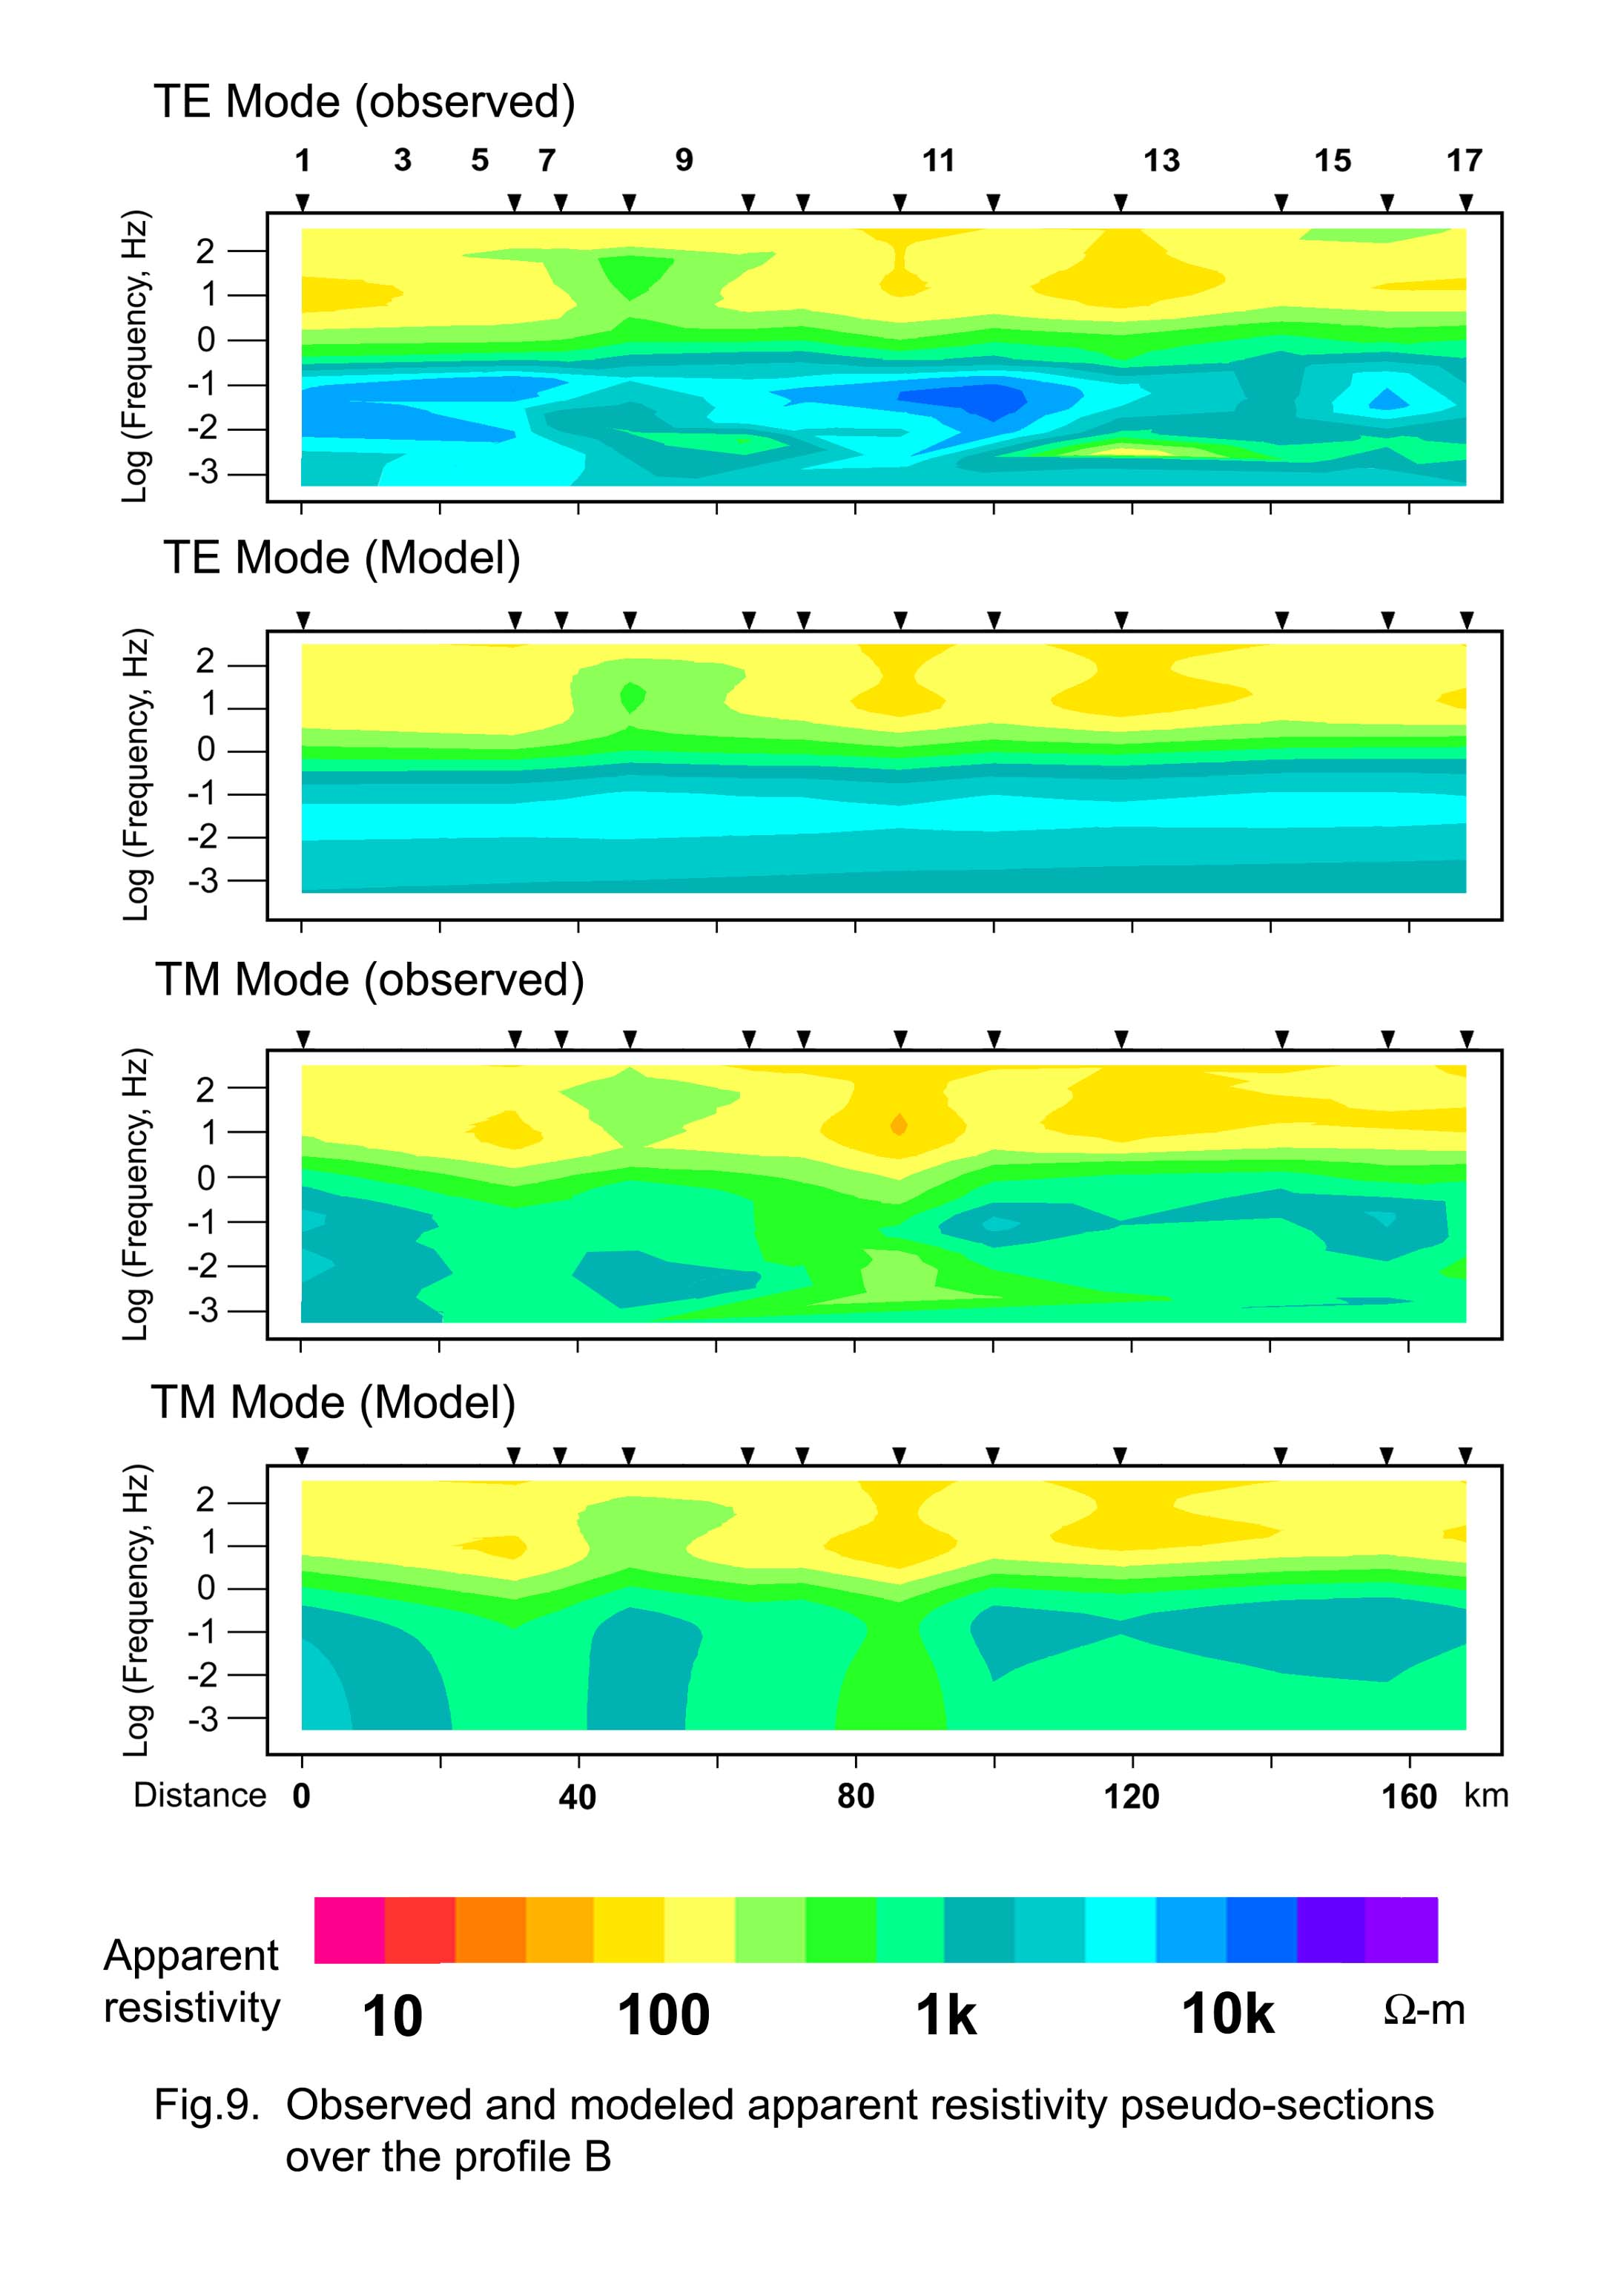
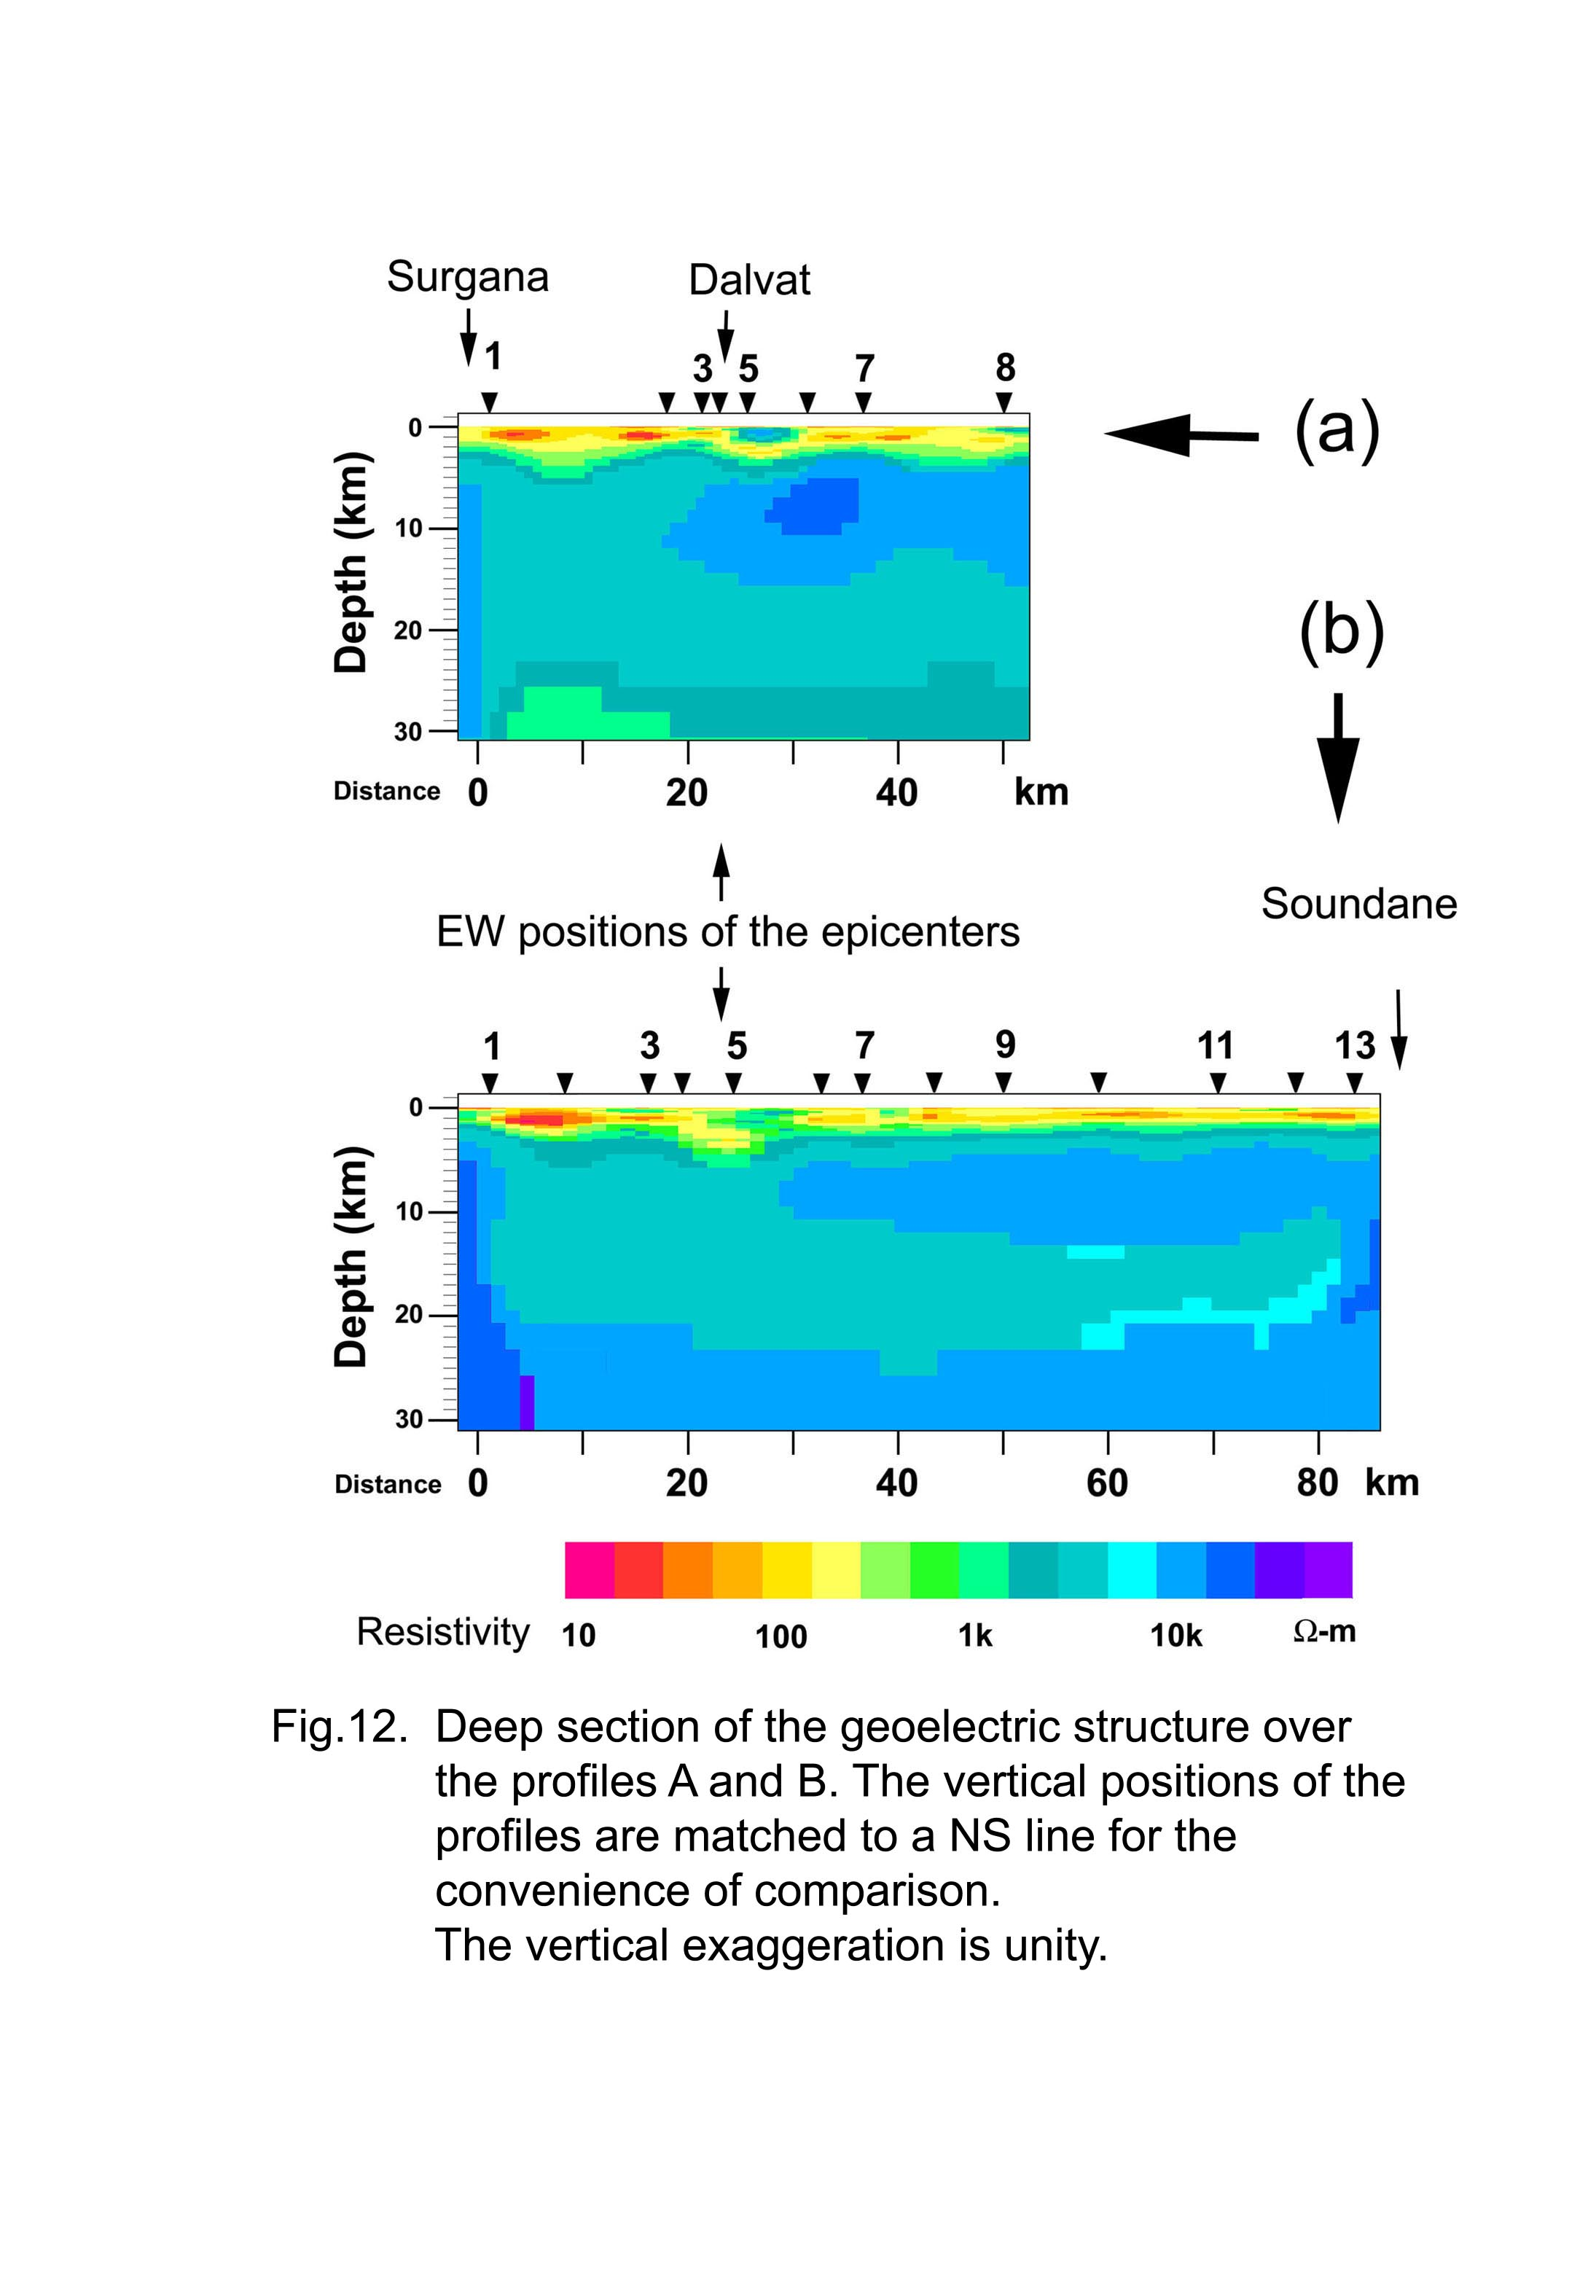
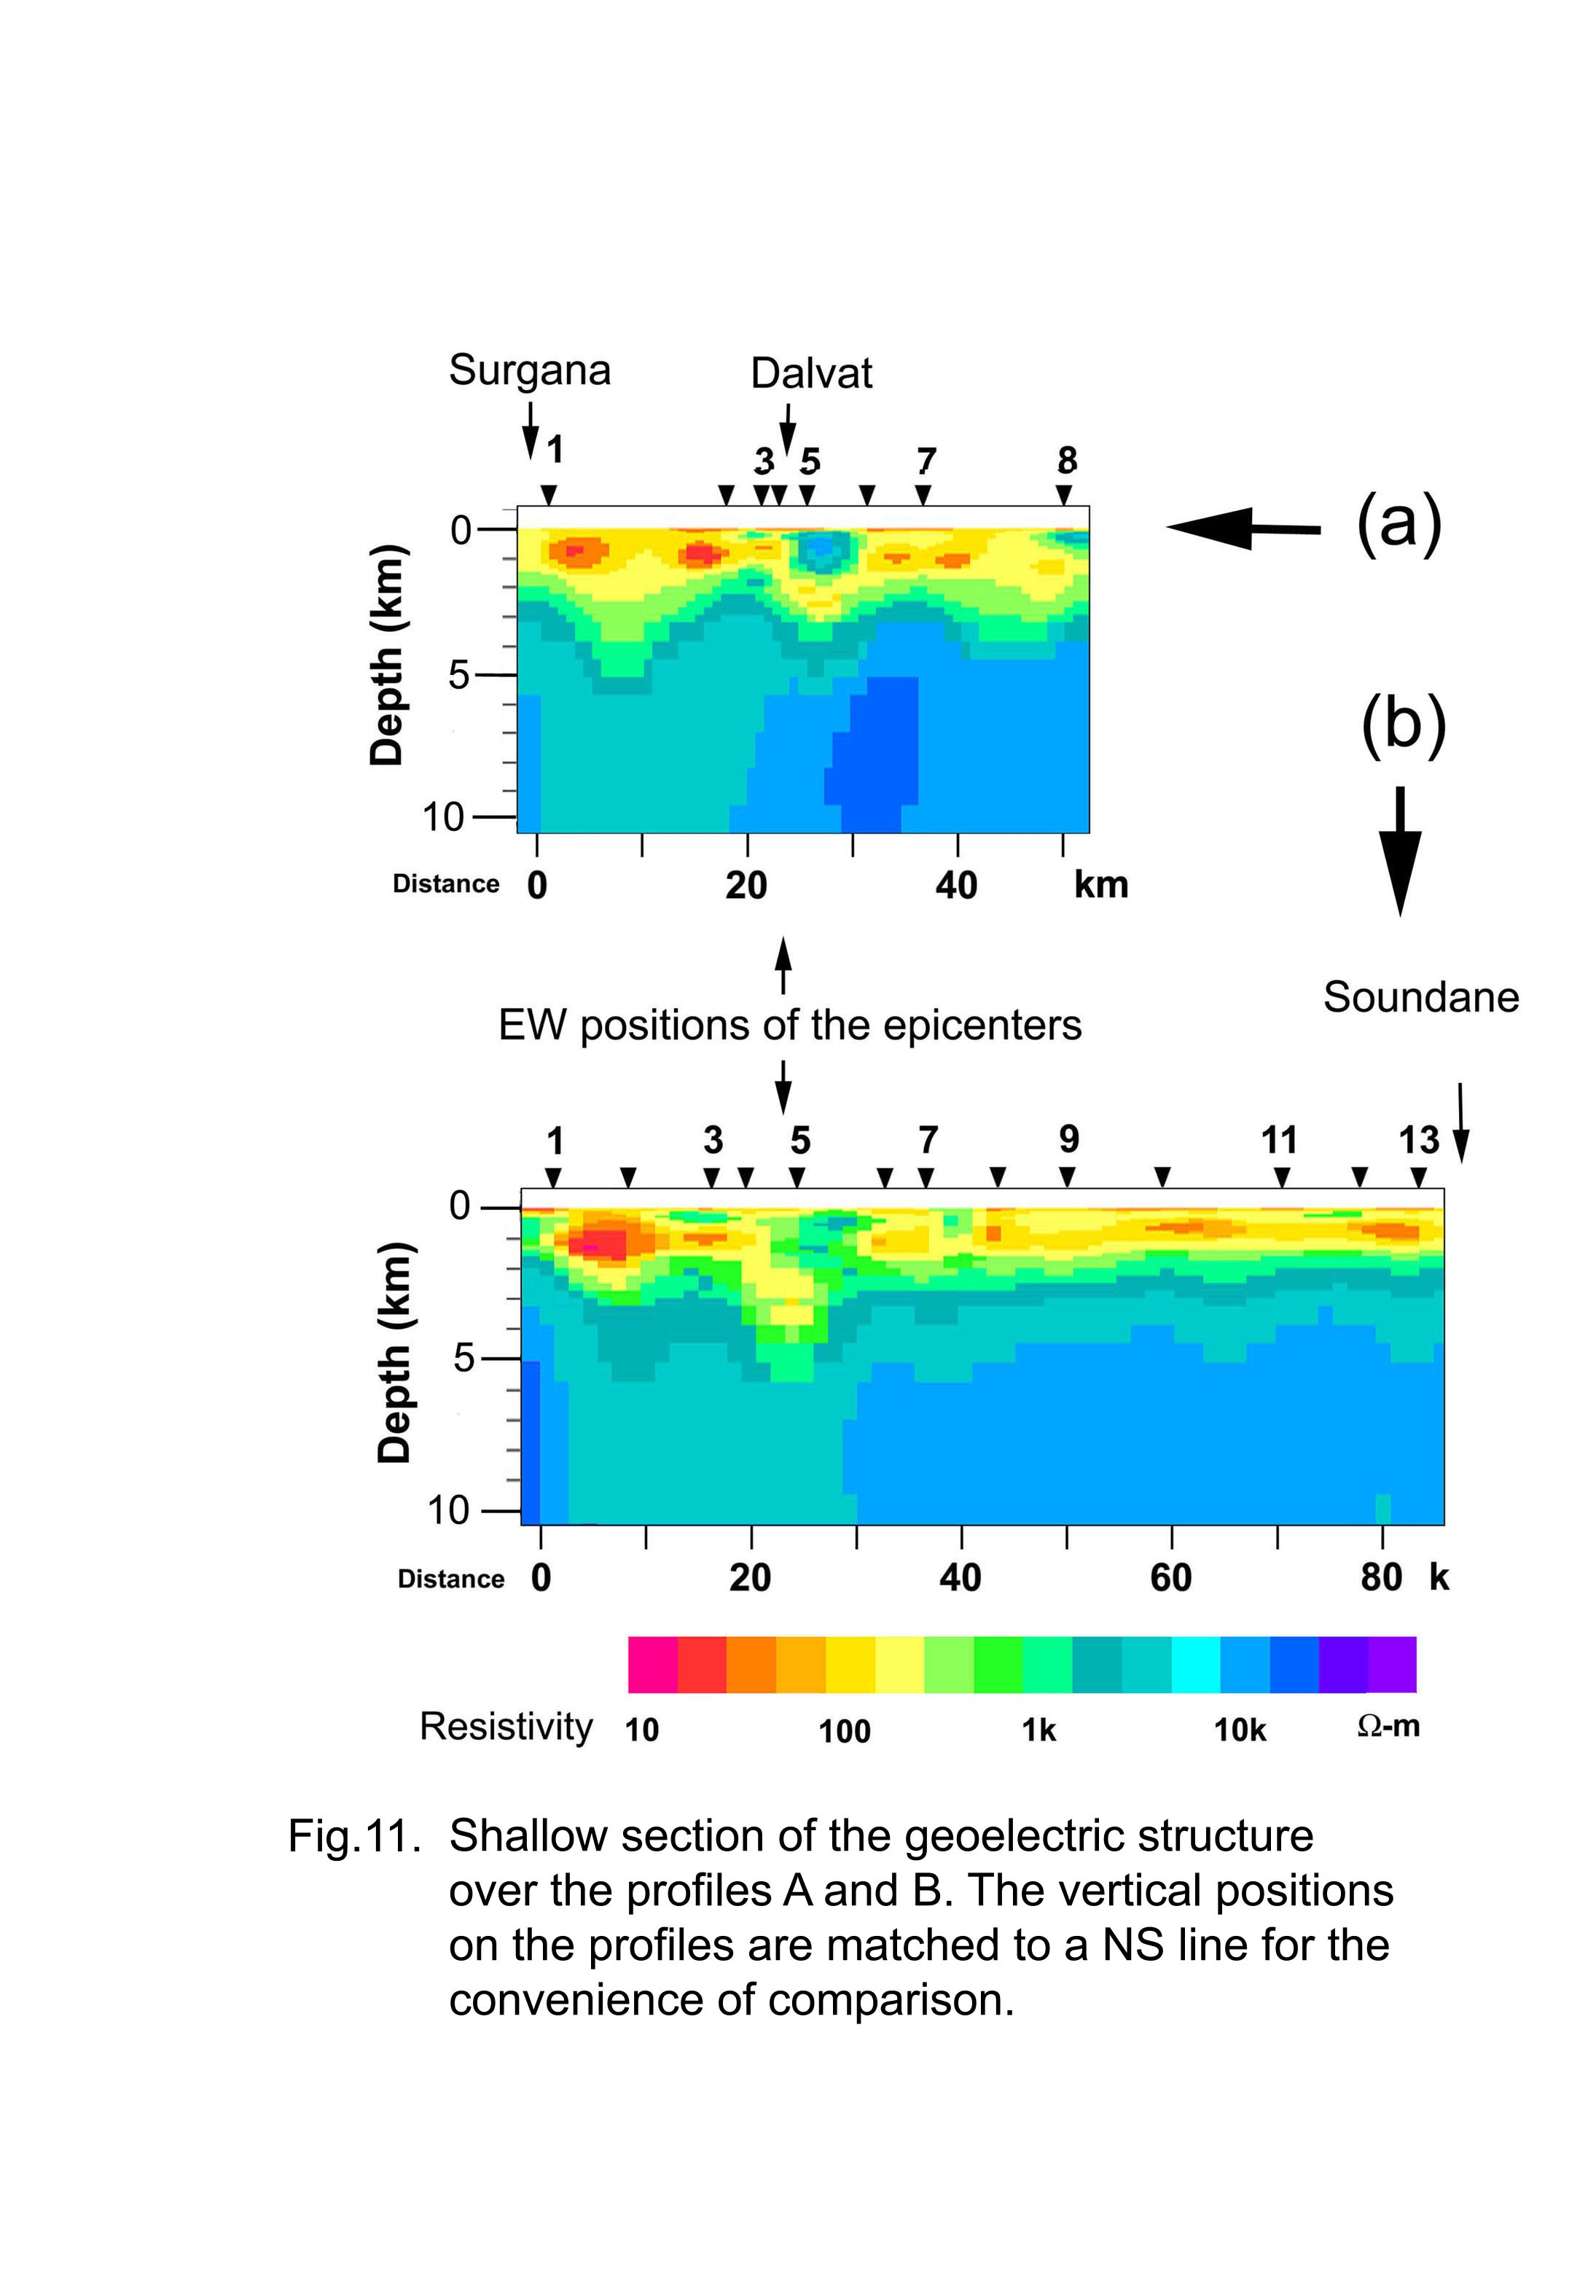
The profiles A and B are located about 100 km north of Nasik. The GB decomposed strike angles obtained using the procedure described earlier are shown in figure 8, which show the regional strike angle approximately along the NS direction. The apparent resistivity and phase pseudo-sections over the profile-B are shown in figures 9 and 10 respectively. Also shown here are the forward modeled responses of the geoelectric structure shown in figure 12. The geoelectric structure was obtained using the two dimensional inversion scheme of Rodi and Mackie (2001) as described earlier. Here the tau factor was set at 5 and after 40 iterations the RMS misfit of 3.1 was observed. The shallow and deep cross sections of the geoelectric structure are shown in figures 11 and 12, respectively. The station positions along the NS are matched to the vertical line on the figures for the convenience of comparison. The deep sections shown in figure 12 have a vertical exaggeration of unity. The shallow and deep geoelectric sections observed along the profile-A, about 30 km north of the profile-A are also shown here.
The top layer is about 2.5 km thick, with resistivities in the range, of 10-200 Ω-m and corresponds to the Deccan volcanics. About 200-400 m thick sedimentary sequences of Bagh group are known to underlie the Deccan traps in this region (Deshpande, 1998), which are exposed to the north and have resistivity values of about 20 Ω-m in the exposed region. Perhaps these could not be delineated from the overlying Deccan volcanics and thus the thickness reported here may be the total thickness of the Deccan basalts and Bagh beds beneath. The thickness of this layer shows rather strong variations to the west of station 7 and are suggestive of the undulating pre-Trappean topography, which has been to a large extent flattened by the Deccan volcanism. These undulations are subdued to the east.
An east dipping thrust zone is observed beneath the stations 4 and 6 on the profile-B, where in the upper crustal block to the east seems to be upthrusting against the western block. The high resistivity (10000 Ω-m) upper crustal block is delineated to the east of this thrust zone underlain by a lower resistivity layer with a linear conductance of about 10 Siemens, corresponding to the deep crustal conductor. The crustal configuration to the west of this thrust zone is strikingly different, with the relatively low resistivity observed extending up to the depth of about 20 km corresponding to the upper crust, indicating that the thrust zone has its roots in the deep crust. The strong undulations observed in the pre-Trappean basement in the western part of the profile also provide sufficient evidence of the more intense tectonic activity here relative to the eastern part, where the pre-Trappean topographic relief is almost non-existent. A shallow high resistive body is delineated over the profile A, contained within the Deccan basaltic layer. This seems to be the northward extension of the thrust zone delineated over the profile B. Probably the descending part of the thrust to the east could not be clearly delineated here. Normally the thin resistive layers of this type are not well constrained in the electromagnetic studies and hence may not be clearly seen in the geoelectric sections. In view of the deep roots associated with the thrust over the profile-B, this feature observed in the profile A, is assumed to be the northward extension of this thrust. Several minor earthquakes with magnitudes of up to 3.0 on the Richter scale with focal depths of 200 – 500 meters have been recorded as a part of this project (Mohan, 2002). Most of the epicenters are clustered in a small rectangular block of 5 * 2 km with some indication of spread in the NS direction, along the lip of the hanging wall of the thrust observed here.
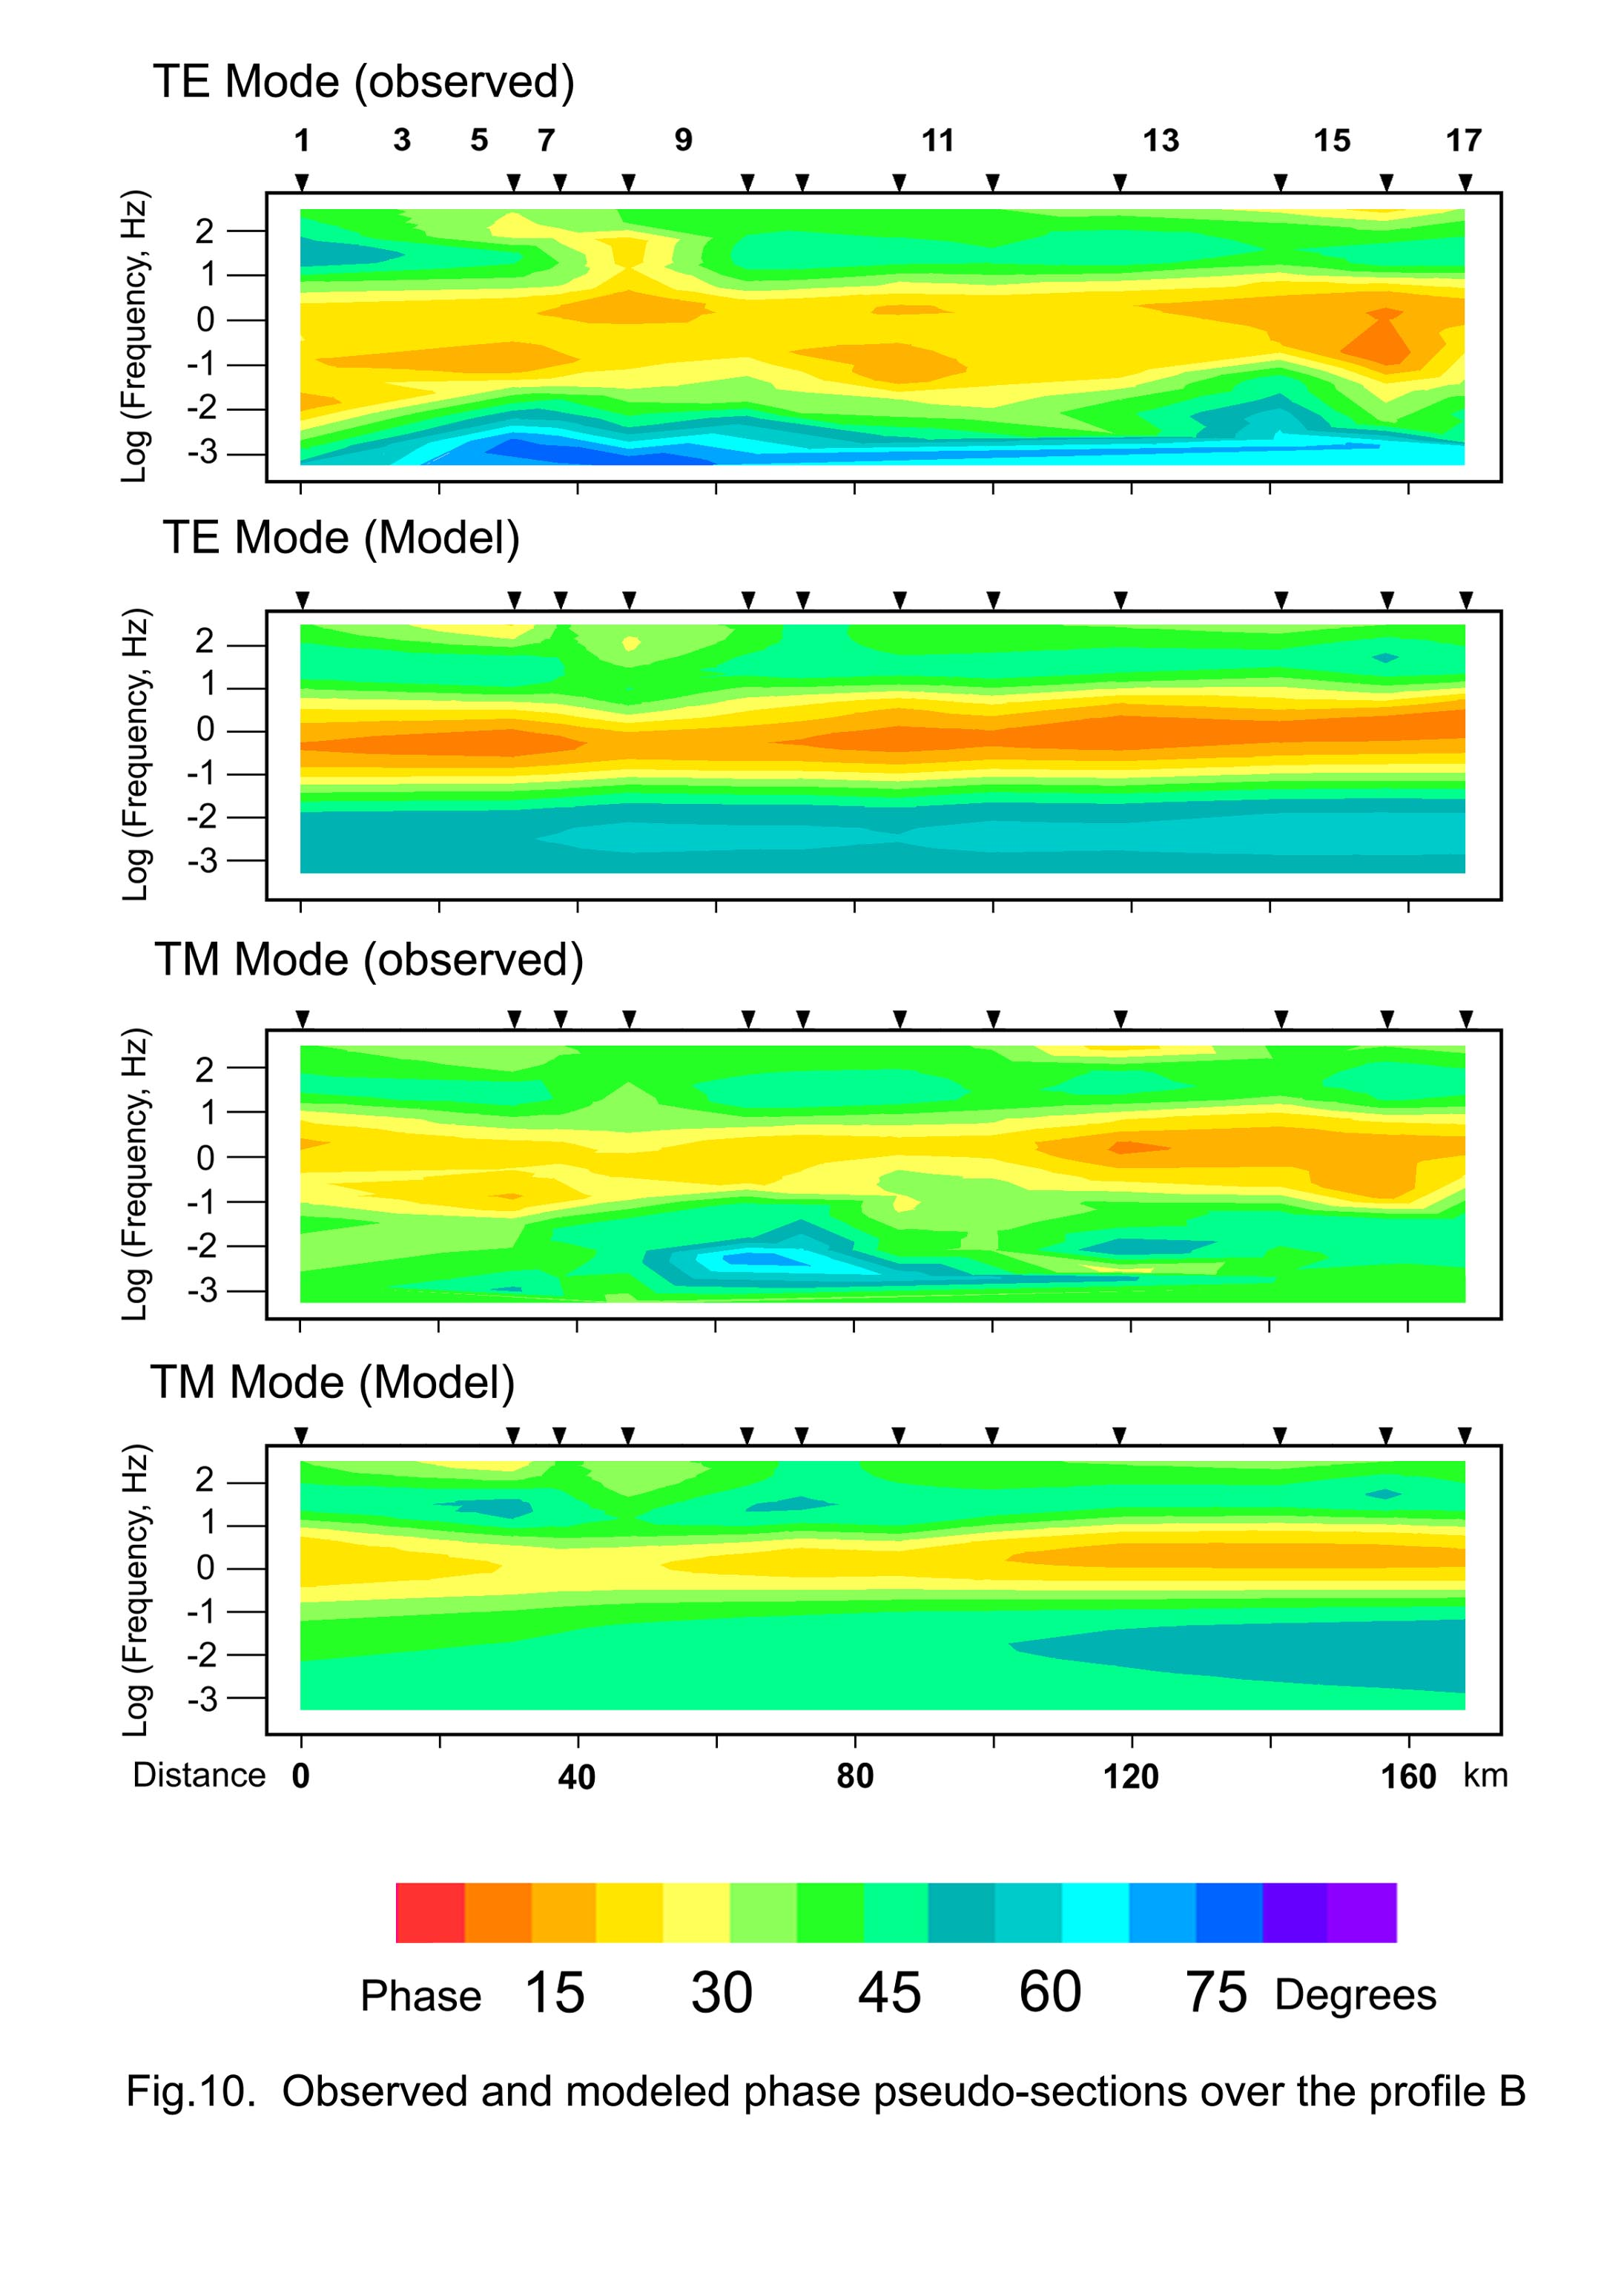
As discussed earlier, a low resistivity was observed in the depth range beyond 60 km in the lithospheric mantle of southern DVP. This feature is absent in the northern DVP. The TE-phase pseudo-sections (Figure 10) however indicate a high phase at low frequencies (<0.01 Hz). Attempts to model this phase showed a low resistivity at depth of about 150 km. Our studies in the other parts of the DVP (Gokarn et al., 1992) as well as the granite greenstone terrain of Dharwar to the south of the present study area (Gokarn et al., 2002) have shown similar low resistivity layers at depth of 120-180 km.
Discussion
Perhaps the most striking observation emerging from these studies is the high conductivity observed at depths beyond 60 km corresponding to the lithospheric mantle of the western DVP over the profile D. Although the noise considerations did not permit the clear delineation of the high conductivity beneath the profile C, the TE-phase pseudo-section (Figure 7a) shows high phase at low frequencies, with the 45o contour at frequencies of about 0.1 Hz. This observation seems to suggest that the high conductivity feature in the upper mantle may be present at the stations 1-3 on the profile C also. It seems that the high conductivity feature in the lithospheric mantle may be taking a westward course in the off-shore region further north of the profiles C and D. There were no indications of the high conductivity feature in the lithospheric mantle over the profiles A and B in northern DVP. The responses over these profiles do suggest a high conductivity at greater depths of about 150 km, which may be the regional feature observed in the MT studies in several other parts of DVP (Gokarn et al., 1992) and adjoining regions (Gokarn et al., 2002). A liquid phase normally present at the lithosphere asthenosphere boundary (LAB) leads to the high conductivity of about 30 – 100 Ω-m and it is conjectured that the regional high conductivity at depth of 150 km may correspond to the LAB in the peninsular India. The thickness of the lithosphere observed here is in good agreement with the value of 160-180 km obtained from the thermal studies (Artemieva, I. M. and Mooney, W. D., 2001). The Indian lithosphere seems to be rather thin, about 150 km as compared to the global average of about 250 km. The Indian continent has moved from Antarctica at phenomenal speeds of more than 16 cm/year over prolonged time periods of about 20 Ma prior to its collision with the Eurasia (Besse and Courtillot, 1988). In the course of this movement, the Indian plate has passed over several hot spots such as the Reunion, Marion etc, especially during their out burst phases. The frictional forces due to the fast movement as well as the interactions with the hot spots may have resulted in decreased thickness of the Indian lithosphere.
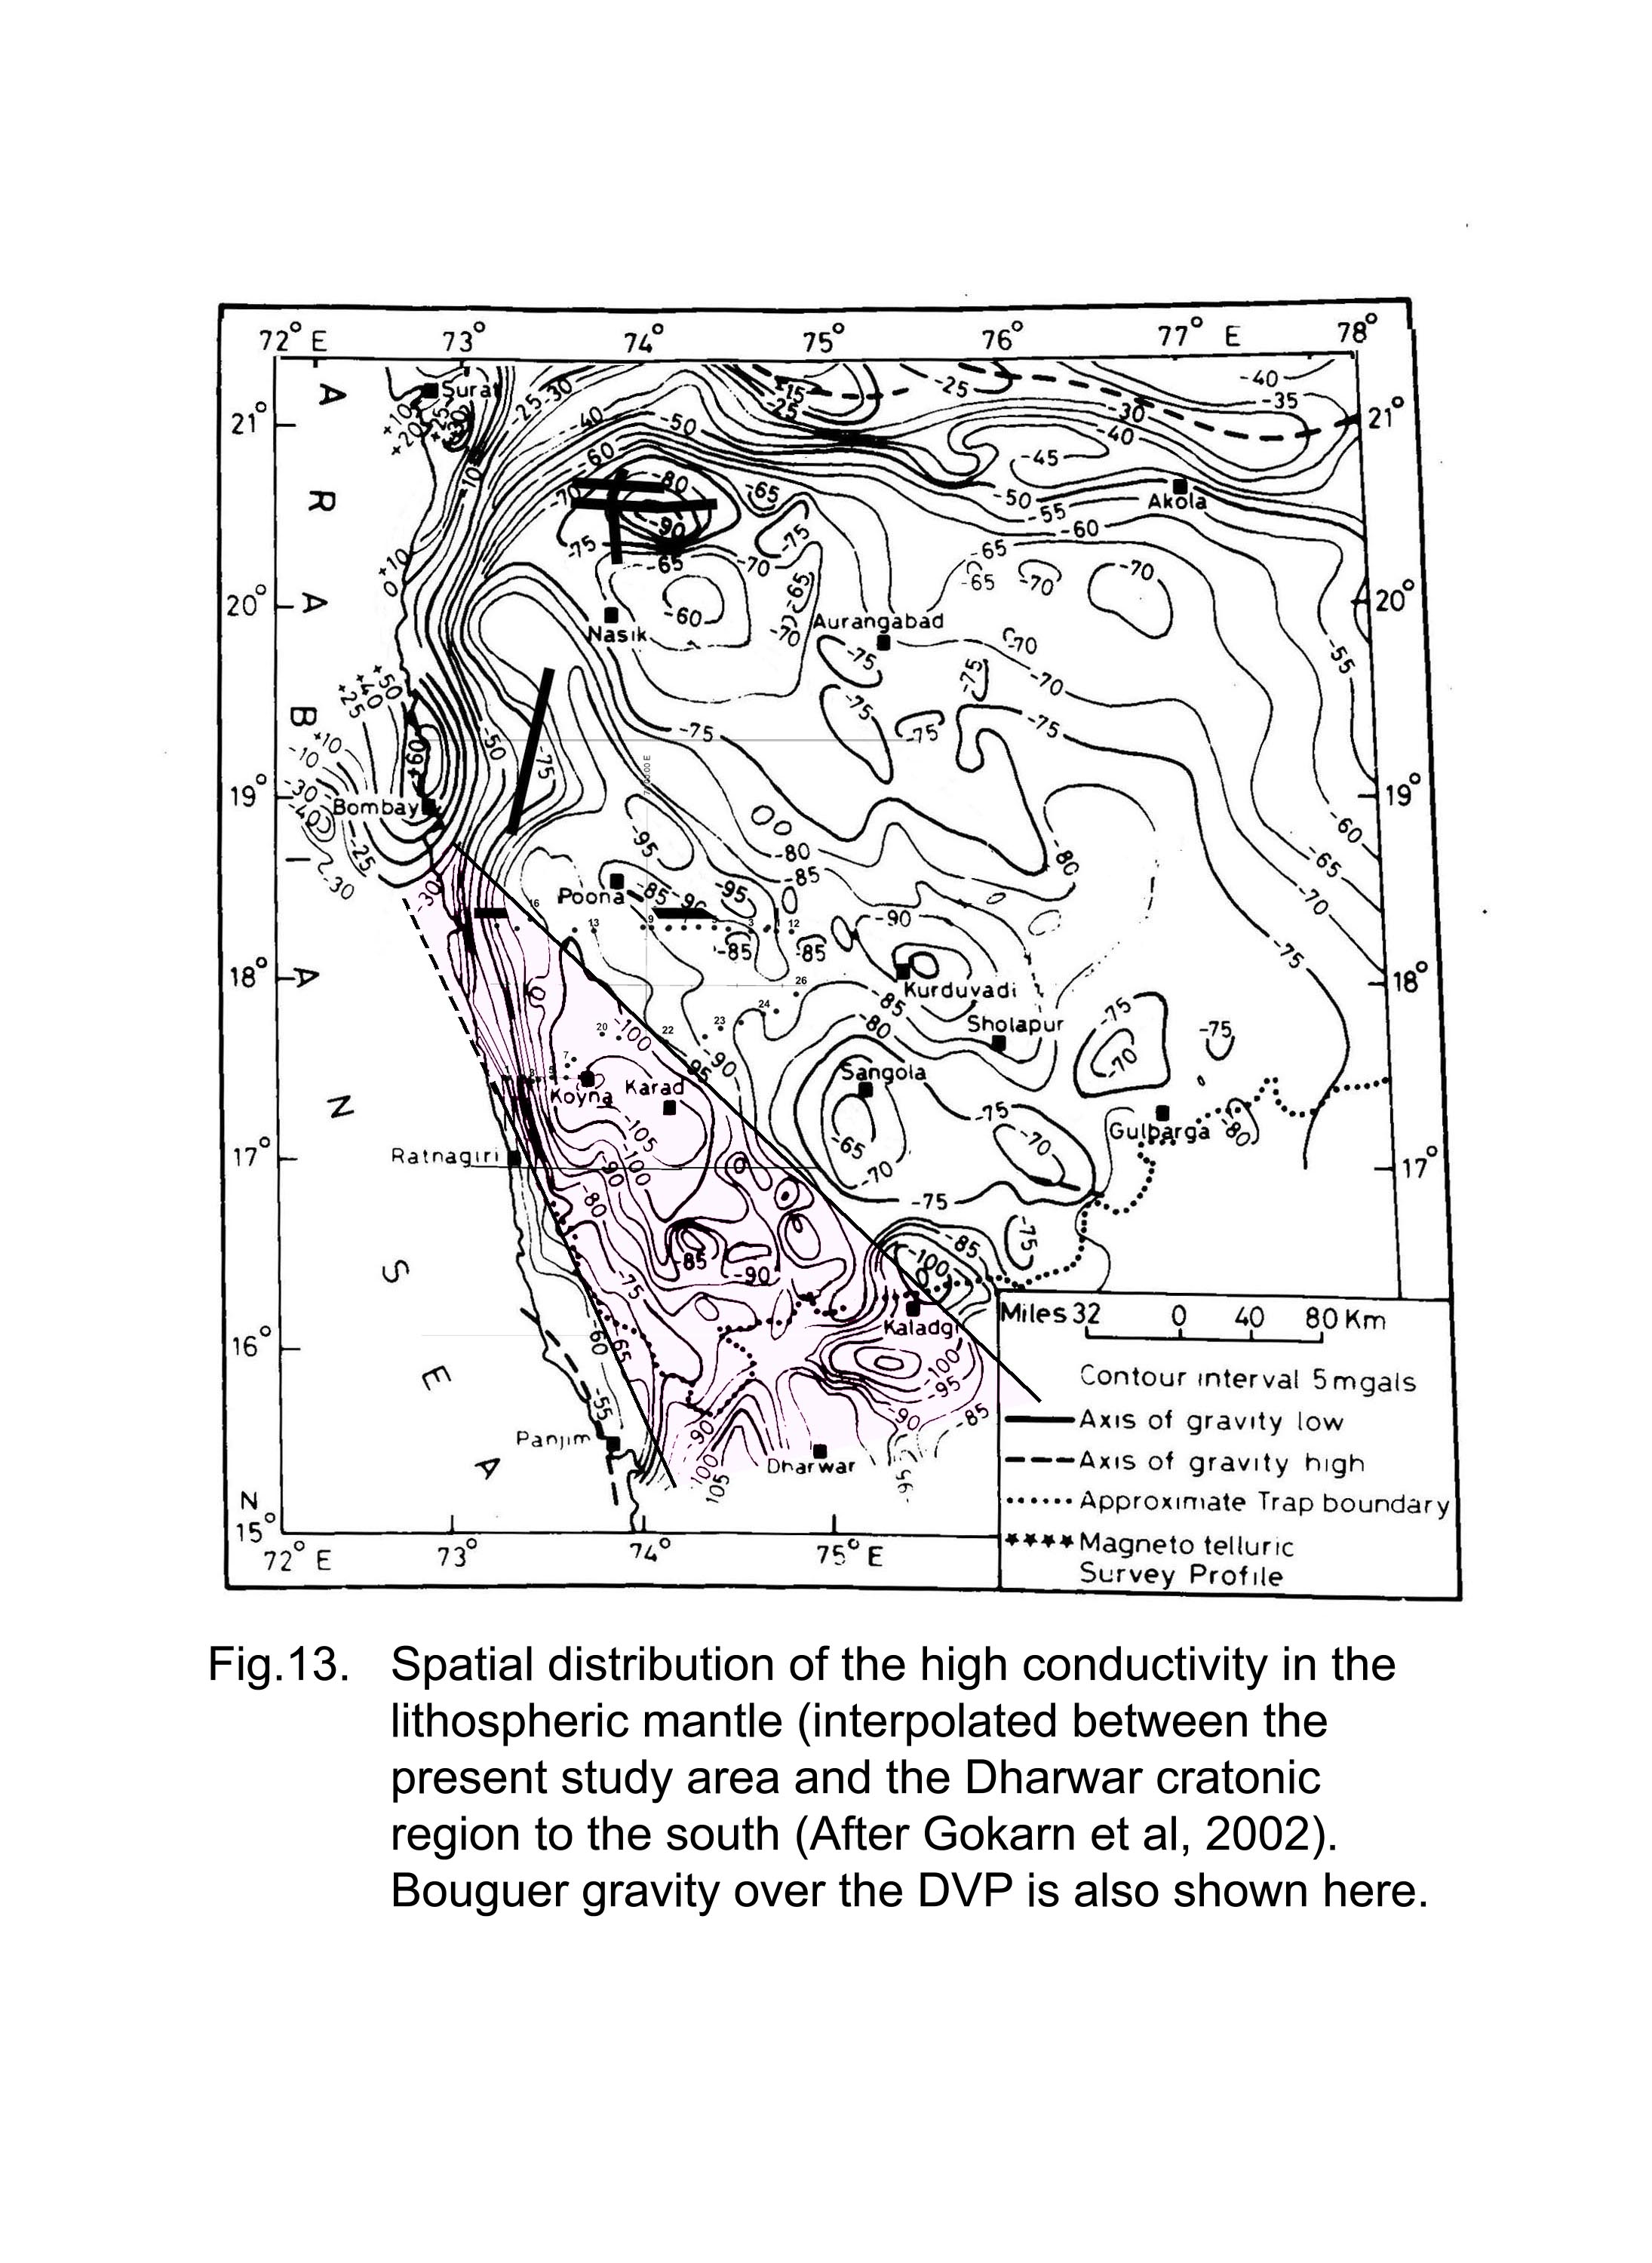
Our earlier MT studies in the granite-greenstone belts of Dharwar (Gokarn et al., 2002) have shown a similar high conductivity in the lithospheric mantle of the west Dharwar block. This seems to be the southward continuation of the high conductivity observed over the profiles C and D. Under this assumption, the possible spatial distribution of the high conductivity in the lithospheric mantle over the present study region as well as the Dharwar craton further south is shown in figure 13. The NW-SE extension of the high conductivity is evident here. The seismic tomographic studies in the Koyna region (Rai et al., 2000) indicate lateral variations in the p-velocities at these depths. The p-velocities beneath the Koyna region (location corresponding to the stations 8 and 10 on the profile D of the present study area) are higher by about 4% than those observed to the east and west of this region. However the location of the seismic stations does not permit the exact estimation of this direction. Based on these observations, the high mantle conductivity may be associated with the path of the Reunion hot spot, over which this part of the Indian continent passed during its post-outburst stage (Raval, . The entire Deccan volcanic episode is attributed to the out-burst of this hot spot, which occurred around 65 Ma.
The exact tectonic activities leading to the Panvel flexure are not immediately apparent here. The crustal sagging and perhaps a failed rift caused by the uplift of the crustal block resulting from the hot spot activity may explain the observed flexure in the deep crust, at least over the southern DVP. The same explanation may not be adequate in the northern part, where the high lithospheric conductivity seems to shift westwards, as against the NS alignment of the Panvel flexure extending up to the north of Mumbai (Figure 1, and Powar, 1981). Thus the flexuring seems to be the result of a complex combination of several tectonic and intrusive episodes, active at different times. Based on the evidence from several geological studies including geochemical and paleomagnetic studies, Mahadevan and Subbarao (1999) have proposed that the coastal plains to the west of the western Ghats may be a belt of active rifts. The best developed part of this rift system is observed in the Cambay-Kutch area to the north of the study area and extends southwards but its identity in the Bombay offshore region seems to be obscured by the subsequent faulting (Biswas, 1988). Our studies suggest that the rift system may have moved eastward in to the continental region and may have degenerated in to the “failed rift” beneath the profiles C and D.
The conductive Bagh beds which were deposited during 110 Ma (Deshpande, 1998), seem to be subducting along the thrust zone observed over the profiles A and B and at present the thrust is covered by the subsequent basaltic flows. This viewed along with the Trappean cover over the thrust dated at 65 Ma, seem to define a time window of 65Ma-110 Ma for the compressional tectonic activity leading to the formation of this thrust. The passage of the Indian peninsula over the Reunion hot spot and the thermo-mechanical fluxes associated with its out burst may have triggered the extensional tectonics immediately above the head of the hot spot and the compressional regime in the immediate vicinity.
Conclusions
The magnetotelluric studies in the western part of the DVP show indications of extensional tectonics in the south and compressional tectonics to the north, both at similar longitudes (73-74o E). The Bagh beds subducting beneath the thrust zone and the Deccan basaltic cover on the top adequately constrain the age of the compressional tectonic activity in the northern DVP to the time window of 110-65 Ma. The observed thinning of the basaltic cover over the Panvel flexure and the thickening in the western Ghat escarpment area to the east in the southern DVP suggest that the flexuring may have occurred either prior to or during the eruption of the Deccan volcanics, although the vertical block movements may still persist due to the loading of the Deccan magma as well as the erosional unloading.
Acknowledgements:
The authors are grateful to the Government of Maharashtra (GOM) for funding this project. Special thanks to Dr. A. V. Sapre, Senior Scientific Officer, Science and Technology cell, GOM for his keen interest and encouragement during the course of this work. The authors are grateful to Prof. B. P. Singh (Retd) Director of our institute and Prof. K.B. Powar (Retd) Vice Chancellor, Shivaji, University, Kolhapur for several useful discussions and encouragement.
References
- Artemieva, I. M. and Mooney, W. D. 2001. Thermal thickness and evolution of Precambrian lithosphere: A global study. Journal of Geophysical Research, 106(B8), 16387-16414.
- Auden, J.B., 1949. Dykes in western India - A discussion of their relationship with Deccan traps. Trans. Nat. Inst. Sci. India 3, 123-157.
- Besse, J. and Courtillot, V., 1988. Paleogeographic maps of the continents bordering the Indian ocean since the early Jurassic. Journal of Geophysical Research 93(B10) 11791-11808.
- Biswas S.K. 1988 Structure of western continental margin of India and related igneous activity. Deccan Flood Basalts, ed. Subbarao K.V., Geological Society of India Memoir No: 10, pp.371-390.
- Deshpande, G. G., 1998, Geology of Maharashtra, Geological Society of India. Publication, pp.116-7.
- Duncan, R.A. and Pyle, D. G., 1988, Rapid eruption of the Deccan flood basalts, Western India, in Deccan Flood Basalts, Ed. Subbarao, K.V. Geological Society of India Memoir no. 10, pp.110.
- Gokarn, S.G., Rao, C.K., Singh, B.P. and Nayak, P.N. 1992. Magnetotelluric studies over the Kurduvadi gravity feature. Physics of Earth and Planetary Interior72, 58-67.
- Gokarn, S.G., Rao, C.K. and Gupta, G., 2002 Magnetotelluric studies over the Archaen south Indian shield: Path of the Reunion hot spot traced? (communicated to Geophysical Journal International).
- Groom, R. W. and R. C. Bailey, Decomposition of the magnetotelluric impedance tensor in the presence of local three dimensional galvanic distortions, Journal of Geophysical Research, 94, 1913-1925, 1989.
- Kaila, K.L., Reddy, P.R. Dixit, M.M. and Lazarenko, M.A., 1981a. Deep crustal structure at Koyna, Maharashtra, indicated by deep seismic soundings. Journal of .Geological Society of India, 22, 1-16.
- Kaila, K.L., Murty, P.R.K., Rao, V.K. and Kharetchko, G.E. 1981b. Crustal structure from the deep seismic soundings along the Koyna II (Kelsi-Loni) profiles in the Deccan trap area, India, Tectonophysics, 73, 365-384.
- Kailasam, L. N., Murthy, B.G. and Chayanulu, A.Y.S.R., 1972 Regional gravity studies of the Deccan trap areas of peninsular India. Current Science, 42, pp.403-407.
- Krishnabrahmam, N. and Negi, J.G. 1973 Rift valleys beneath Deccan Traps (India). Geophysical Research Bulletin, 2, 207-237.
- Mohan,G., 2002. Seismological studies, Project completion report, on the Integrated geological, seismological and co-seismic investigations in Jawhar - Murbad. Dist. Thane and Dalvat region, Dist. Nasik, Maharashtra. submitted to the Government. of Maharashtra, India. pp. 33-110
- Powar K.B., 1981, Lineament fabric and dyke pattern in the western part of the Deccan volcanic province, in “Deccan Volcanism and related Basalt provinces in the other parts of the world”, Ed. Subbarao, K.V. and Sukeshwala, R.N. Geological Society of India Memoir. No.3, 45-57.
- Qureshy, M. N., 1981, Gravity anomalies, isostacy and crust-mantle relations in the Deccan trap and contiguous regions. in Deccan Volcanism, ed. Subba Rao, K.V. and Sukeshwala, R.N., Geological Society of India Memoir, 3, 184-197.
- Rai, S.S., Singh, S.K., Rajgopal Sharma, P.V.S.S., Srinagesh, D., Reddy, K.N.S., Prakasam, K.S. and Satyanarayana, Y., 2000. Preliminary results of seismic tomography Digital array in Koyna region, in Research Highlights in Earth System Science, Ed. Verma, O.P. and Mahadevan, T.M., Indian Geological Congress, Roorkee, India.
- Rodi, W. & R. L. Mackie, 2001. Nonlinear conjugate gradients algorithm for 2D magnetotelluric inversions, Geophysics, v. 66, p. 174-187, 2001.
- Takin , M. 1966, An interpretation of positive gravity anomaly over Bombay on the west coast of India. Geophys. Journal of Royal Astronomical Society 11, 139-175.
- Wadia, D.N., 1975. Geology of India. publ: Tata McGraw Hill Publishers, New Delhi, India, p.276
- Widdowson, M. and Mitchell, C., 1999. Large scale stratigraphical, structural and geomorphological constraints for earthquakes in the southern Deccan traps, India: The case for denudationally driven seismicity, Deccan Volcanic Province, Ed. Subbarao, K.V., Geological Society of India Memoir No 43(1), pp. 425-452.
- Wight, D.E. and F.X. Bostick, Cascade decimation – A technique for real time estimation of power spectra, Proc. IEEE International Conference on Accoustic, Speech Signal Processing, Denver, Colorado, April, 9-11, pp. 626-629, 1980.
Figures
- Figure 1
- Lineament map of the western Deccan volcanic province and adjoining region (After Powar, 1981). Also shown here are the MT profiles.
- Figure 2
- Bouguer gravity map of the Deccan Volcanic province and adjoining regions (Kailasam et al.,1972). The thick solid and dashed lines are the regional gravity low and high trends respectively.
- Figure 3
- Location map of the MT survey stations over the profiles, C and D. The lines originating from the stations over profile D are GB decomposed strike angles at individual stations averaged in the low frequency range (0.01-0.001 Hz)
- Figure 4
- Apparent resistivity pseudo-sections over the profile D. Also shown here are the forward modeled responses for the model shown in figure 6. for comparison sake.
- Figure 5
- Phase pseudo-sections over the profile D. Also shown here are the forward modeled responses for the model shown in figure 6 for comparison sake.
- Figure 6
- Shallow and Deep sections of the Geoelectric structure over the profile D profiles. The deep section has a vertical exaggeration of 1.
- Figure 7
- Results of the MT interpretation over the profile C. (a) The GB decomposed phase pseudo-sections and (b) Geoelectric structure (Shallow section).
- Figure 8
- Location map of the MT stations over the profiles A and B. The Bouguer gravity contours in the region (after Kailasam, et al., 1972) are shown in cyan background.
- Figure 9
- Observed (GB decomposed) and modeled apparent resistivity pseudo-sections over the profile B.
- Figure 10
- Observed and modeled phase pseudo-sections over the profile B.
- Figure 11
- Shallow section of the geoelectric structure over the profiles A and B. The vertical positions of the profiles are matched to a NS line for the convenience of comparison.
- Figure 12
- Deep section of the geoelectric structure over the profiles A and B. The vertical positions of the profiles are matched to a NS line for the convenience of comparison. The vertical exaggeration is unity.
- Figure 13
- Spatial distribution of the high conductivity in the lithospheric mantle (interpolated between the present study area and the Dharwar cratonic region to the south (After Gokarn et al., 2002). Bouguer gravity over the DVP is also shown here.