Banjeree, P. and Satyaprakash, W. 2003. Crustal Configuration across the north-western Himalaya as inferred from gravity and GPS aided geoid undulation studies. Journal of the Virtual Explorer 12, 93-106.
Crustal Configuration across the north-western Himalaya as inferred from gravity and GPS aided geoid undulation studies.
Abstract
The tectonics of the North-western Himalaya is poorly constrained due to lack of relevant geophysical data. We carried out gravity measurements over more than 500 new locations, mostly along the north-south running Kiratpur-Manali-Leh-Panamik highway, at nearly 1-3 km station interval, aided by leveling and GPS positioning. The data have been used to generate a new refined Bouguer gravity anomaly map of the NW Himalaya. A broad positive Bouguer gravity anomaly has been found to be associated with the Indus Tsangpo suture zone and Ladak granitic batholith. GPS aided geoid undulation measurements as well as Bouguer gravity anomalies indicate the presence of a low density slab at nearly 20 km depth, further north of the suture zone, in the southern Tibetan plateau. A 4m drop in geoid anomaly associated with steep Bouguer anomaly suggest that the India-Asia crustal interface lies further north of geologically located Indus Tsangpo suture zone. Post-collisional thrusting could have dislocated the surface rocks further south to its present position. A mid-Himalayan crustal up warping parallel to the central axis, and just north of the Main Central Thrust, is found to be modulated over the steep, north dipping, thickening Indian crust. Post collisional compression could have produced this folding of crustal-level density interfaces, with the Central crystalline rocks as its surface manifestation.
Introduction
Difference of opinions exists regarding the exact nature of the Himalayan and Tibetan crustal configuration as an aftermath of the India-Tibet plate collision (Matte et al., 1997; Molnar & Tapponnier, 1975). It is believed that nearly 2500 km of the Indian plate have been consumed since the beginning of the continental convergence process (Patriot and Achachu, 1984; Dewey et al., 1989). The normal Indian plate thickens to almost double of its size when it reaches the southern border of the Tibetan plateau. However, the exact mechanism of this thickening process is not known. There are a number of tectonic evolution models trying to explain the present day crustal structure of the Himalayas. These include, (a) very flat under thrusting of the Indian plate beneath Tibet (Powel & Conaghan, 1973; Barazangi & Ni, 1982), lately modified by Willett & Beaumont (1994), (b) deep angled northward subduction of Indian lithosphere (Allegre et al., 1984; Coward & Butler 1985, Mathanon, 1985, Coward et al., 1988,), (c) plane indentation of the plastic Asian plate by rigid Indian plate resulting in lateral extrusion manifest in large strike-slip faults (Tapponnier & Molnar, 1976), and its variations (Dewey & Burke, 1973; Vilotte et al., 1982; England & Houseman, 1988), and (d) the injection of the Indian crust into weak Tibetan lower crust model by Zhao & Morgan, *For communication. Fax: +91-135-625212, Email: parameshb@hotmail.com 1985. Jin et al., (1994) have suggested from gravity and topography data that the Tibetan sub-surface density interfaces are folded under compression, along a line parallel to the collision arc. The tectonics of the series of seismically active, parallel, Himalayan megalineaments are yet to be properly understood. Inspite of the presence of considerable amount of geological information, lack of basic geophysical data remains a major handicap for developing a relevant lithospheric configuration model.
Gravity anomalies, being sensitive to the sub-surface mass distribution, have been used to extract useful information regarding the Himalayan crustal configuration (Qureshy 1969, 1971; Kono, 1974; Qureshy et al., 1974; Warsi & Molnar, 1977; Lyon Caen & Molnar, 1985; Verma, 1985). Kono (1974) carried out gravity measurements in Nepal Himalayas, from Kathmandu to Mt. Everest. Before the present work, only surface gravity measurements in the NW part of the Himalaya were carried out by Das et al., (1979) along five transects with 10-30 km station spacing. The details of the field measurement and data reduction methodology, particularly regarding the gravity station elevation and terrain corrections, adopted by them is not known. In the sharply undulating Himalayan terrain, these two factors affect the accuracy of gravity measurements, and remain one of the main reasons behind sparse gravity coverage. This sparse gravity dataset was used by several workers (Verma & Subrahmanyam, 1984;Quereshy & Midha, 1986; Verma & Prasad, 1988) to suggest different crustal models.
We carried out gravity and GPS-aided geoid undulation measurements, along the 1000 km long Kiratpur-Manali-Leh-Panamik (KLP) transect (Figure 1). This transect offers unique opportunity to cover the entire cross-section of the Himalaya, starting from the southern foothill plains of Punjab, reaching up to the southern foothill of the Karakorum, cutting across the Main Boundary Thrust (MBT), Main Central Thrust (MCT), Indus Tsangpo Suture Zone (ITSZ), and Shyok Suture Zone (SSZ). We used leveling and Global Positioning System (GPS) for measurements to determine elevations and positions of the gravity stations spaced at 1-3 km distances (Banerjee & Satyaprakash, 1999). We have applied terrain correction using a DEM based technique, specially developed and suitable for the sharply undulating topography of the Himalayas (Banerjee, 1998). Geoid undulations measured along a 200 km line crossing the Indus Tsangpo suture zone in the Ladak Himalaya show the presence of a low density zone in the southern part of the Tibetan plate, possibly indicating the presence of India-Asia tectonic transition zone (Banerjee et al., 1999). This is at least 30-40 km north of what is presently known as the ITSZ from surface geological mapping. The expected positive Bouguer gravity anomaly caused by the presence of the higher density basic and ultra basic rocks along the suture zone, are also spread over a much broader area, extending towards the north, covering the ‘Ladak granitic massif’. A broad isostatic gravity high in the central Himalaya indicates the upwarping of Moho along the central axis of the Himalayas, possibly manifesting post-collisional compressional shortening of the India plate.
Gravity and GPS Data Acquisition:
Our gravity transect runs along the Kiratpur-Manali-Leh-Panamik road. This nearly 1000 km (by road) long stretch is the only motorable road reaching up to the southern foothills of the Karakorum, and covers all important tectonic features including the Main Boundary Thrust (MBT), Main Central Thrust (MCT), Indus Tsangpo Suture Zone (ITSZ) and Shyok Suture Zone (SSZ). The elevation varies from 300m at Kiratpur, in the southern plains of the Himalayan foothill, up to 5400m on top of the Khardungla Pass, in Ladak at the northern part of the KLP transect. Khardungla Pass is the highest motorable road in the world. The KLP transect crosses four major passes having heights of more than 5000m. The Manali-Leh section of the transect is the most difficult part of the KLP transect, with almost no habitation, sharply undulating terrains, mostly barren desert, and rough weather. With four high mountain-passes remaining closed for the major part of the year, this section is accessible only during July-Sept.
We carried out three types of measurements along this transect i.e., gravity, leveling and GPS. For the southern part of the KLP transect, along the Kiratpur-Manali section, gravity stations were solely positioned using leveling measurements. For the northern part, along Rumtse-Leh-Panamik section, both leveling and GPS measurements were carried out, while in the central and most difficult part of the transect, between Keylang and Rumtse, only GPS measurements were carried out for gravity station positoning.
Leveling measurements in the southern most tip of the KLP transect, between Kiratpur and Mandi, were carried out by the Survey of India (SOI). The rest of the leveling measurements, between Mandi & Keylang, were carried out by us using Sokkia Total Station (an EDM-electronic theodolite combination) instrument. The typical surveying technique was by leapfrog method, using two single lens prisms. All the leveling benchmarks (BMs) were tied to the existing SOI first and second order benchmarks, on both ends. In the section north of Leh, (Leh-Panamik), no existing SOI benchmarks exist. We installed our own benchmarks, and the measurements were repeated three times over two years’ period.
Main objective of using GPS for positioning was to eliminate time-consuming and cumbersome leveling work for height measurements of the gravity stations. As GPS does not provide orthometric height directly, a transformation is required to convert GPS measured spheroidal heights into orthometric heights by using geoid undulation model.
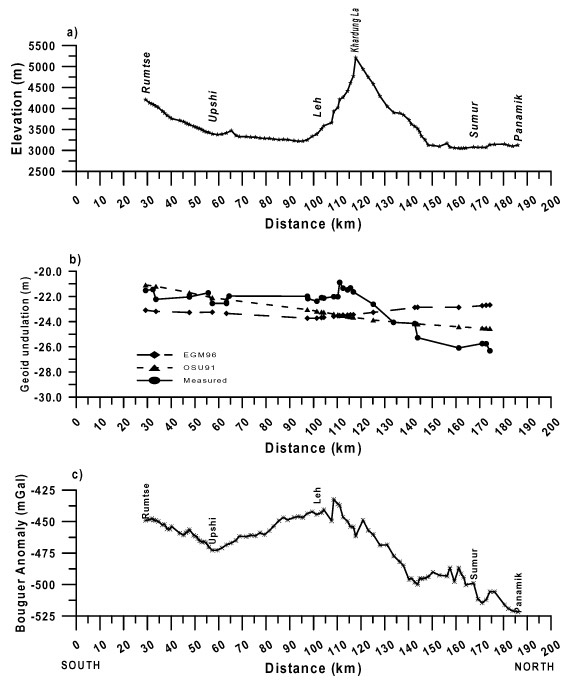
We measured geoid undulation in the Rumtse-Leh-Panamik section by using GPS measurements of leveling benchmarks (Banerjee & Satyaprakash, 1999). The difference of the GPS derived spheroidal height and the leveling derived orthometric height gives the geoid undulation at that point. A total of 28 such measurements were carried out over this 200 km stretch, where a total 68 gravity stations were established. Geoid being a gravity equi-potential surface, is more influenced by the deeper mass inhomogeneities, compared to the gravity anomalies, which is its vertical gradient. The Rumtse-Leh- Panamik section crosses over two very important tectonic lineaments, the Indus-Tsangpo Suture Zone (ITSZ) and the Shyok Suture Zone (SSZ), crossing over the India-Tibet plate boundary. Also, this section contains very sharp undulation in topography, starting from 3400 m at Leh, reaching up to 5400 m on top of the Khardungla pass, within 15 km horizontal distance. We wanted to see the effect of topography, as well as that of tectonics on the geoid undulations, and how reliably GPS can be used for gravity station positioning in remote and rough terrain (Banerjee & Satyaprakash, 1999). We also calculated the geoid over the same points using global gravity data of OSU91 and EGM96 available from NIMA (Rapp, 1997). It was found that a height accuracy of nearly 1 m could be achieved in the worst case scenario, where GPS is used and the geoid model is computed from the existing global gravity model.
Gravity measurements:
Three gravity meters, Sodin, LaCoste-Romberg (LCR) and Scintrex CG3M, were used over the entire period of the field measurements. The LCR and CG3M were mainly used for establishing gravity base stations at 20-40 km spacing, whereas detailed gravity measurements were carried out using the Sodin (Worden type) instruments. The gravity network was tied with SOI gravity bases. The accuracy of the gravity measurements are within 0.1mGal, which is the maximum closure error we found between different SOI gravity bases, to which our network was tied. All the 550 gravity measurement points are marked and documented, and at least 40% of these can be re-occupied, and almost all the base stations can be reoccupied.
GPS measurements:
We used two Trimble 4000SSE dual frequency receivers, in ‘fast-static’ mode, where one receiver operated as ‘static’ base station and the other roving receiver occupied the measurement points, within 20 km range, for 8-20 minutes each. The data was post-processed using Bernese 3.2 software. All the gravity stations except those along the Kiratpur-Keylang section were positioned using the GPS. Base stations were established at nearly 40 km spacing, with at least 2-3 days continuous occupation. The base station at Leh was occupied for 5 continuous days. While processing, these base stations were tied with IISC, Bangalore IGS station. The accuracy of relative positioning obtained from fast-static measurements was of mm level for positions, and within 1 cm for height. However, processing failed for several stations, as ambiguities could not be resolved in a few cases, where data occupations were too short for reliable estimation of ambiguity-free positions.
Leveling measurements:
One Sokkia Set 2C total station was used for leveling surveys for the entire length of the KLP transect, except the Keylang-Rumtse section. We used SOI 1st and 2nd order benchmarks available every 10-20 km for the southern part of the KLP transect. We carried out measurements from one BM to the next BM, without any loop closure. As the
BM-BM matching was within 1-3cm, even for the longest lines, our accuracy requirements were fulfilled. Along the Rumtse-Leh-Panamik (geoid) section, we carried out loop closure, and repeated measurements thrice. We applied on-line temperaturepressure correction to the EDM & theodolite measurements. The overall accuracy of the leveling measurements is within 10 cm.
Data Processing and Interpretation
Gravity data reduction:
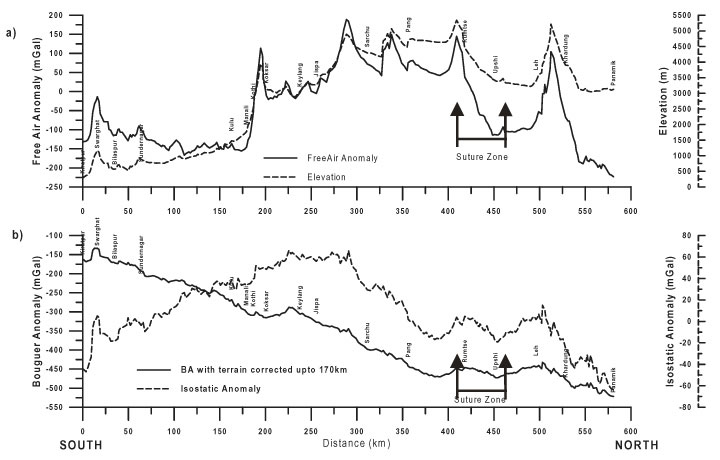
Terrain correction was applied to the raw field data, after applying regular drift correction and free-air correction. As the accuracy of the Himalayan gravity data is limited mainly by the proper application of the terrain correction, we used a DEM based algorithm (Banerjee, 1998). Three different sets of digital terrain data were used for the terrain correction for the range of 35 m to 170 km from the measurement point. We manually digitized elevation data at 30//x30// gird spacing from SOI 1:50,000 and 1:25,000 topographic map generating a database of more than 50,000 records. As this technique does not separately compute Bouguer corrections, we used the digital terrainmodel for calculating total correction effect of the topographic mass and in the process, terrain corrected Bouguer anomaly (BA) was obtained. Figure 2a shows the elevation and Free air anomaly (FAA) along the KLP transect. Figure 2b shows the terrain corrected BA along the Kiratpur-Leh-Panamik transect. Due to complex nature of the Himalayan geology, we have used a uniform density of 2.67 gm/cm3 for the entire correction process. We take note that this can produce pseudo-anomalies in the region where the elevation is 3 km or more, but the pseudo anomaly will not have any significant effect on the final Bouguer anomaly.
Airy Isostatic anomaly over the entire region was computed from the refined Bouguer gravity anomaly and ETOPO-5 5/x5/ grided topographic data sing AIRYROOT set of programs (Simpson et al., 1983). We used the Fast Fourier Transform (FFT) algorithm of Parker (1972) to calculate the gravitational attraction of a layer of mass enclosed between two surfaces defined by the gridded elevations. The increased speed achieved using FFT algorithm facilitates the isostatic correction of large regional data sets, and generates an isostatic regional field equal to the attraction of the compensating masses as a natural by-product. It requires density of topography (r), depth to the bottom of the root (T) and density contrast between the root and surrounding material (Dr) as input to calculate root (d) by the equation,
d = T+e(r/Dr)
where e is the station elevation. We used a grid of topographic elevation / bathymetric depths in a projected co-ordinate system. The result of this computation is a grid of values in mGal, which represents the attraction of the root system out to 166.7 km from each grid point. For the region beyond 166.7 km, results from the published map of Karki et al., (1961) have been used. The map of Karki et al. (1961) utilises a sea level compensation depth of 30 km and a Dr =0.6 gm/cm3 between crust and mantle. However, in the present study T=35 km and Dr=0.4 gm/cm3 have been used, which is more appropriate for the Himalayan region. This may produce errors in the root attraction values of up to 9 mGal for broad regions at 3000 m elevation (Simpson et al., 1983). As this is very large wavelength in nature, does not change the shape of the root appreciably, and can be safely ignored.
The result of the airy anomaly computation is the total attraction at sea level of the crustal root system. Because of the average high elevation of the measurement points, we need to ‘upward continue’ each individual computation point, from mean sea level to the actual gravity station heights. This is done by upward continuing the sea level grid by standard flat earth procedures (Hildenbrand, 1983) to two different flat surfaces at different elevations. The majority of the high elevation gravity stations lies between these two surfaces. Effects for individual stations were then computed by linear interpolation. Figure 2b shows the isostatic anomaly along the KLP transect.
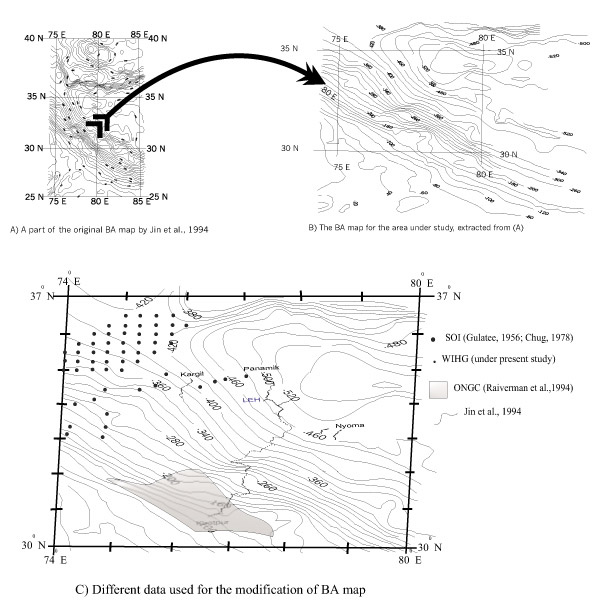
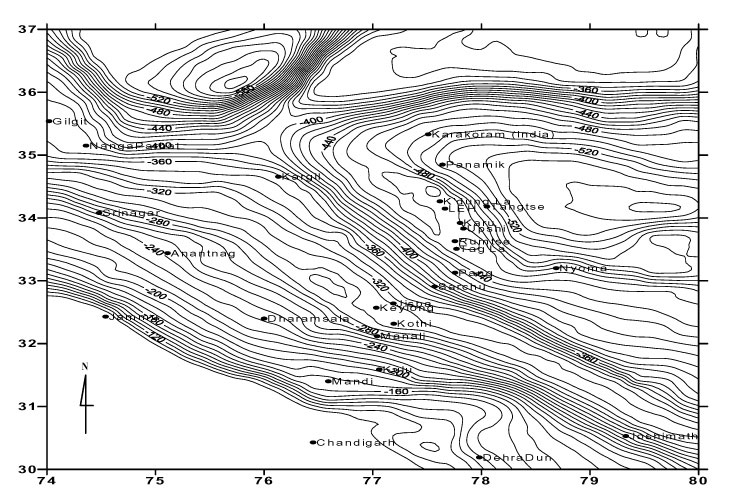
Gravity data over the NW Himalayas were collected by various national and international agencies in the past. Over some part of the study area, gravity data were collected by SOI (Gulatee, 1956; Chug, 1978) and ONGC (Das et al., 1979; Raiverman et al., 1994). Jin et al., (1994) prepared a BA map over the NW Himalayas (Figure 3a), which includes the present study area (Figure 3b). They used a density of 2.67gm/cm3 (McNutt, personal communication) to reduce the data and used the terrain correction algorithm of Sun (1989). We collected gravity data over more than 550 stations and the terrain correction program of Banerjee (1998) was used to reduce the data with a reducing density of 2.67gm/cm3. All these data sets (Figure 3c) were combined to prepare a new Bouguer anomaly map of the region (Figure 3d) bounded by 74�-80� E longitude and 30�-37� N latitude with a 10 mGal contour interval.
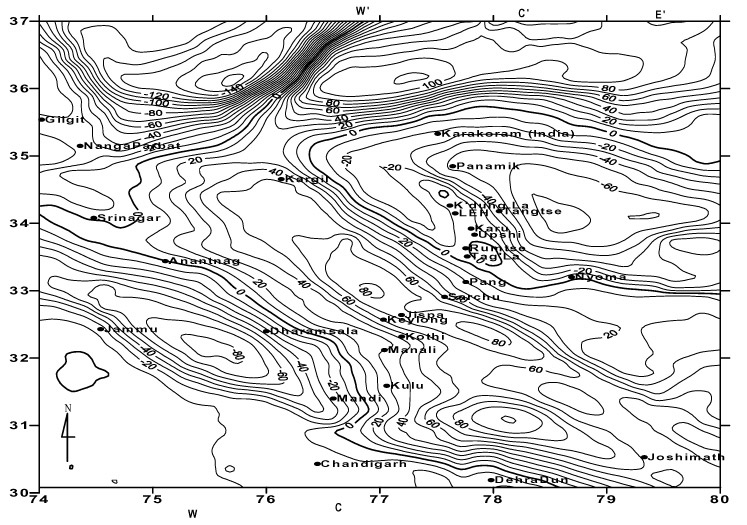
The BA map was digitized at 0.1�x0.1� grid resolution. The elevation for each point was calculated from the 5/x5/ ETOPO-5 global digital elevation data. These two data sets were used to compute the isostatic anomaly (IA) at each point using Airy’s scheme of compensation (Simpson et al., 1983) to produce the IA map for the region (Figure 4).
In our analysis we restricted ourselves only to the KLP transect. However, these maps provide justification for two-dimensional modeling, as the major features are seen to be large, narrow, and elongated parallel to the Himalayan arc.
Geoid computation
The geoid undulation variation was determined over 28 points along the 200 km long Rumtse-Leh-Panamik section. This section passes over the Indus Tsangpo Suture Zone (between Rumtse and Leh), the Khardungla pass and the Shyok Suture zone. As has been discussed (Banerjee et al., 1999), the difference of measured orthometric height from leveling surveys, and spheroidal heights from GPS surveys, give the geoid undulation over the measurement point. We have also computed the same geoid from global gravity models OSU91 and EGM96. The match between the measured and computed geoid is within 1m (Figure 5b). However, a 4m sudden drop in the measured geoid is not present in the computed models. The gravity model derived from our new gravity data does not contain the higher frequency signal.
Discussion of the Data
The Bouguer and isostatic gravity anomalies along the entire transect (Figure 2b) were used to construct a crustal model. We treat the Rumtse-Leh-Panamik section separately from the entire KLP transect. This section covers the important India-Asia collision zone where we have additional geoid undulation anomaly data available. Also, a distinctly different trend in gravity anomaly is observed along this section.
1. Rumtse-Leh-Panamik section:
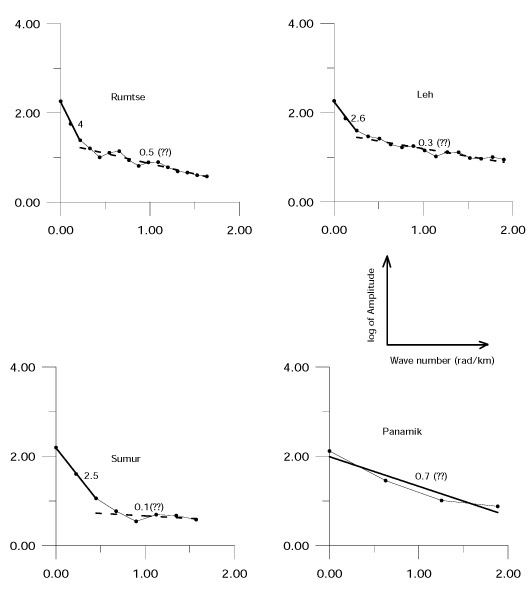
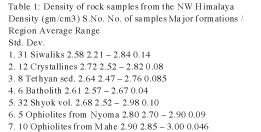
a) The large wavelength Bouguer gravity anomaly present over the entire southern part of the region is indicative of the presence of high density material in the crust. The Rumtse-Upshi part of the KLP section spans the ITSZ. Like along other parts of the ITSZ, there is no ophiolite exposed in this part of the suture zone. However, we do find a 60 km wide gravity high, the source of which must be extending further south of the surface trace of the suture zone. Since there is no DSS/ velocity data available from the region, the average depths for the sources causing these anomalies computed from their amplitude spectra (Figure 6) have been used as initial depth estimates in the forward modeling program of Talwani et al., (1959) and 2.5-D program SAKI (Webring, 1985). The high frequency regions of these spectra correspond to noise in the data, which is nearly white in all the segments of the transect and has been ignored. For modeling the sub-surface bodies causing the gravity anomalies in the Rumtse-Leh-Panamik section, we have assumed a density of 2.85-2.90 gm/cm3, that of ophiolitic rocks found in similar tectonic zones from other parts of ITSZ in Ladak (Table-I, S.No. 6&7).
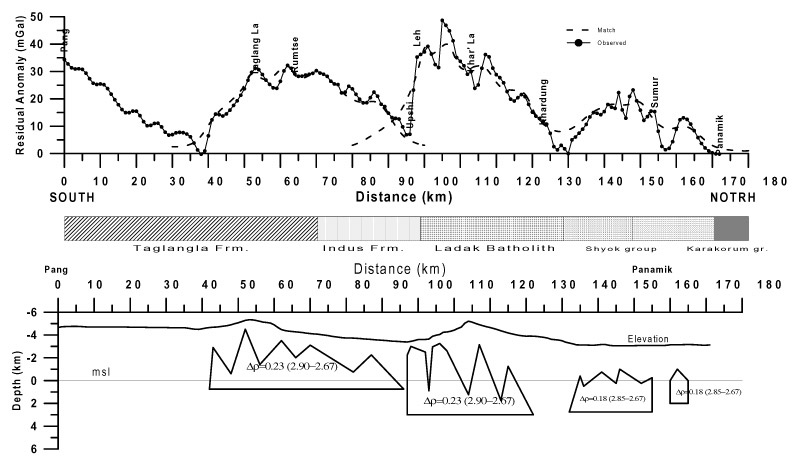
We have introduced a number of shallow sub-surface high density bodies (Figure 7) to explain the residual gravity highs obtained through 2-d forward modeling (Talwani et al., 1959) and 2.5-d forward and inverse modeling programs SAKI (Webring, 1985). While modeling this section, we have assumed that the gravity anomalies are caused by mass inhomogenieties at different depth levels. The shallowest body lies between surface and 6 km depth and the deepest lies between surface and 5 km below mean sea level. An alternate model was also considered, keeping all the bodies below mean sea level. However, this did not significantly change the shape of the bodies but considering 3000m, the average elevation in the region, this model is not geologically viable.
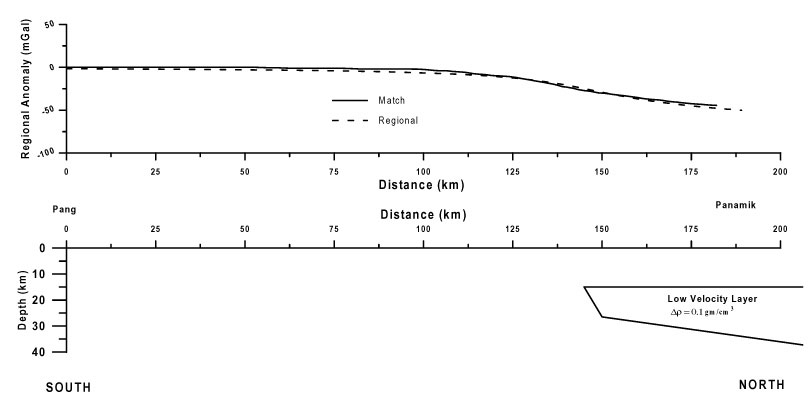
b) The gravity high over the Ladak granitic batholith can not be explained in terms of the surface geological features. The fact that the geoid undulation is almost flat for the entire Rumtse-Leh-Khardungla section, and hence the regional for Bouguer anomaly between Pang-Panamik, leads us to assume that the regional gravity anomaly over this part is being caused by a single deep source. The geoid anomaly is almost smooth along the Rumtse-Khardung La section (Figure 5b), after which it drops down by nearly 4 m over a distance of 40-50 km and is again flat thereafter. This step-like change in the geoid anomaly is significant here as the profile crosses the Indian-Tibetan plate boundary. The fact that the geoid falls by 4 m to the north of the Khardungla peak, and gravity falls sharply by about 40-50 mGal over the same region, have led us to assume that this is the zone of a major lateral discontinuity in the crustal density distribution (Banerjee et al. 1999). The analysis of regional bouguer anomaly (Figure 8) for this section shows the presence of a lowdensity layer at a depth of 15 km with a thickness of almost 15 km, having density contrast of -0.1 gm/cm3. A simple mathematical model has been used to interpret the change in the geoidal anomaly in terms of tectonics, assuming that two different, semi-infinite blocks represent the India and Tibetan plates and are in isostatic equilibrium. The observed geoidal anomaly change is produced by the lateral density contrast (Banerjee et al., 1999) at the same point.
The presence of this layer has also been reported by the INDEPTH studies in Tibet (Nelson et al., 1996; Rodger & Schwartz, 1997). The proposed low velocity/density layer inside the Tibetan plate to the north of the suture zone may be associated with a laterally-pervasive weak zone that mechanically decouples the upper crust from the lower crust (Zhao & Morgan, 1985; Jin et al., 1996). The presence of crustal melting is also plausible given the existence of the huge Ladak granitic batholith north of the river Indus. The composite model of the ISZ is shown as in figure 9.
2. Isostatic anomaly between Kiratpur-Manali-Leh-Panamik:
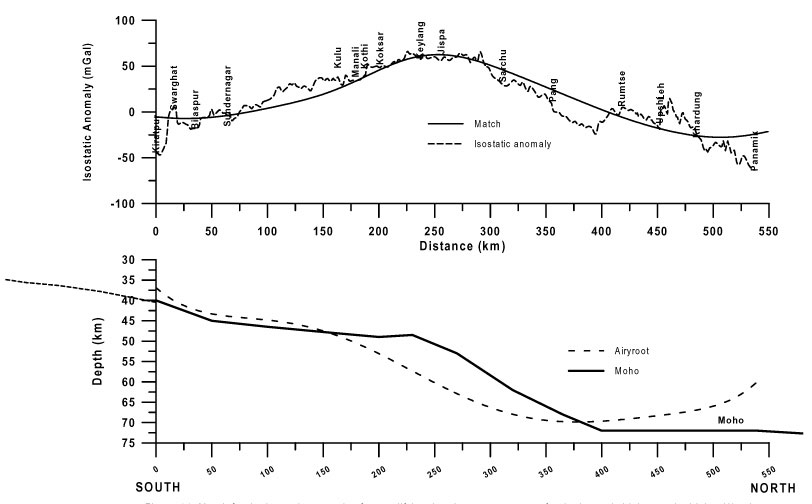
c) The complete Bouguer anomaly along the section (Figure 2b) is associated with the strong gradient down towards north. The gradient is almost uniform, except when it becomes much gentler in the Rumtse-Leh-Panamik section as was discussed above. Isostatic anomaly (Figure 2b) detrends the signal from the gradient caused by the thickening of the crust towards north. While computing the IA anomaly, we extrapolated the gravity transect in the south up to Narmada Son Lineament in central India, where the crustal model is well constrained by a number of deep seismic sounding profiles and gravity studies (Verma & Banerjee, 1992). A large wavelength isostatic gravity high at the central part of the transect indicates that the Himalayan crust is not compensated in the conventional sense of the isostacy. It can be seen that this isostatic high is a prominent feature in the isostatic map (Figure 4), and is elongated for about 400 km, parallel to the collision zone, and has a width of nearly 100 km. The IA for Kiratpur-Manali-Leh transect, its Airyroot (the root calculated from the elevation), surface geology and the elevation is shown in figure 10. The IA shows a 65 mGal high over the higher Himalaya having a wavelength of 400 km. The high is mostly over the sediments and the central crystallines. The Airyroot shows an upwarp between Sundernagar and Koksar, where the profile passes over the Rohtang Pass. To the south of Kulu, Airyroot has a gentle slope, which increases after Kothi / Koksar from where the gradient of elevation starts increasing. This region is underlain by sediments and the rocks of central crystallines. The average density of the rocks in the region is between 2.5-2.8 gm/cm3 (Table-I), with density of majority of rocks lying in the range of 2.5-2.6 gm/cm3. Qureshy & Midha, (1986) previously reported this isostatic high along Delhi - Srinagar - Pamir transect (further west of present transect), and suggested thickening of the basaltic layer within the crust. Kono (1974), from a parallel transect further east in Nepal, interpreted the isostatic high in terms of thinner crust. In the absence of any other supporting evidence, we try to explain the isostatic high in terms of another alternative simple model. Domal upwarping of density interfaces under compression is a possibility, and has been suggested for the Tibetan crust. Jin et al. (1994), from coherence studies between gravity and topography data, suggested development of surface and sub-surface folding of the wavelength of 150 km and 500 km respectively, parallel to collision zone, in the Tibetan plateau. A similar, but larger wavelength lithospheric undulation do exist in the Gangetic basin-Himalayan system, where the former represents a deficiency of mass, the latter represents the excess of mass (Lyon Caen & Peter Molnar, 1985). We have interpreted the Isostatic anomaly in terms of upwarping of Moho, modulated over normal crustal thickening, in the central Himalayas (Figure 11). We believe that the exposure of the Central Crystalline rocks along the central axis of the Himalayas is surface manifestation of this compressional folding.
3. Composite model of the Kiratpur-Manali-Leh-Panamik section:
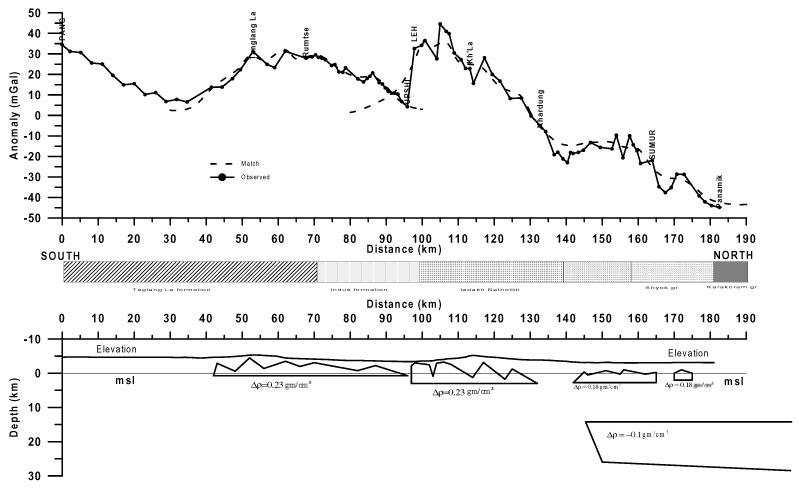
d) Several shallow sub-surface bodies are modulating the BA with a number of smaller wavelength gravity high’s over this regional high. This is also apparent from the figure 2b that the gradient of Bouguer anomaly changes sharply near Pang, and is much more gentler over the Rumtse-Panamik section. It is possible that a single high density body is present with a large lateral extent. It seems logical to assume that the remnant part of the oceanic plate, i.e., an ophiolitic slab, nearly 90 km in lateral extent, remains entrapped in the collision zone. A support for this assumption came recently from another INDEPTH findings. Makovsky et al (1999) reported from the seismic studies in Nepal, the presence of a high density, ophiolitic slab at the suture zone in Nepal Himalaya, dipping at 40N at around 20 km depth, of lateral dimension of ‘at least’ 90 x 80 km. Figure 12 shows the composite model for the entire section, which can explain the observed Bouguer and Isostatic anomalies.
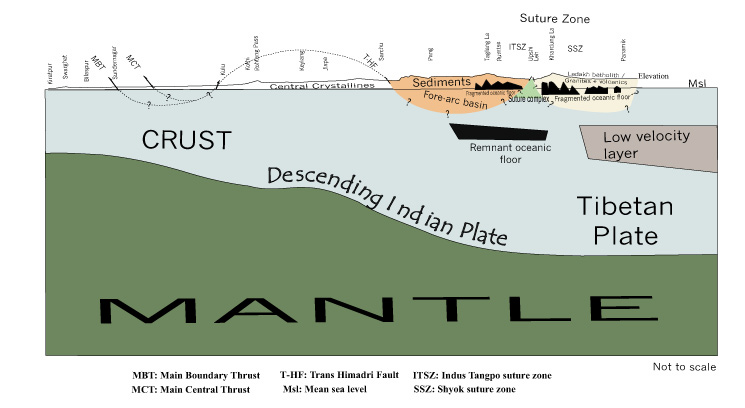
e) Though we have introduced several shallow depth bodies to fully explain the BA, we are not able to answer whether there is any tectonic distinction between the bodies on either side of the Suture zone. One possible explanation could be, that the entire Rumtse-Khardungla subsurface geology actually represents the remnants of the oceanic crust as a post-collisional phenomenon (Figure 12). The Ladak granitic mass, which is believed to be part of the precollisional island arc, was tectonically emplaced over the suture zone as a result of the post-collisional thrusting process. To evolve a composite model for the subsurface under the KLP transect, the results of interpretation of the Bouguer anomaly (BA) interpreted in these shorter segments (Figure 7 & 8) as well as the result of analysis of the isostatic anomaly (Figure 11) have been used to construct an initial model. Introduction of a 5 km thick ophiolitic slab at a depth of 15 km and extending to a length of 80-90 km under Tso Morari crystallines to under Indus sediments having a density of 2.55 gm/cm3 overlying the remnant oceanic floor explains the isostatic anomaly satisfactorily. Geological and geophysical evidences in favour of the presence of a lithotectonic unit viz., ophiolitic complex at mid-crustal depth in the southern Tibet have been put forward by Makovsky et al. (1999) from INDEPTH studies. Following the results of INDEPTH, the basin postulated to explain the isostatic anomaly forms a part of the fore-arc basin underlain by transitional crust in the south and remnant oceanic floor and ophiolitic complex in the north.
f) Another alternative model could be that where as ophiolitic rocks are present to the south of ITSZ, the gravity high over Ladak granite is cause by basic intrusives. This, of course, makes it difficult to explain the presence of the gravity-geoid discontinuity using any simple model.
Conclusion:
Our measurements along this transect provide, for the first time, a reliable and detailed source of gravity anomalies across the NW Himalayas. The important new finding is the presence of a large positive Bouguer gravity anomaly, not only over the Indus-Tsangpo Suture Zone, but also over the Ladak granitic batholith. Whether these two gravity anomalies are actually caused by a single sub-surface body, can not be objectively resolved from the gravity studies alone. A sharp change in the gradient in Bouguer gravity anomalies over the suture zone, can be caused either by the presence of a large sheet of high density mass, or by a sudden change in the dip angle of the Indian crust-mantle interface. Whereas the latter is possible, we based our modeling on the former assumption, not only because it is simpler, but also because we have additional support from geoid undulation data, and the findings from the INDEPTH studies in Nepal. The presence of a low density slab at around 20 km depth, to the north of the Khardungla peak where both a geoid and gravity anomalies shows a sharp gradient, strongly indicates a transition from the Indian continental crust towards Tibetan crust. This has also been supported by the INDEPTH seismic studies in Nepal. The ITSZ rocks as well as the Ladak batholith seem to have been tectonically displaced by at least 20-30 km since collision, from their original locations. The broad, elongated, Isostatic anomaly along the central axis of the Himalayas is only reconfirmation of what previous workers reported from Nepal and western Himalayas. We associate this feature with the exposure of the central crystalline rocks, and believe a compressional large wavelength folding has caused the upwarping of the density interfaces within the Indian crust. Whether this excess mass can be associated with the mass deficiencies along the foreland Gangetic basin as a single ‘crest and trough’ folding, is subject to further studies. Figure 13 shows the interpretive geological cross section along the Kiratpur-Leh-Panamik transect, based on the gravity and geoidal data collected from the NW Himalaya in Ladak.
Acknowledgements:
Funds for the present work came from the Department of Science & Technology, New Delhi and WIHG jointly. We are thankful to the Director, WIHG for giving permission to publish this work. We thank Prof. Roland Burgman of University of California, Berkley for his critical review. Thanks are also due to Mr. C.P.Dabral forhelping in fieldwork.
References
- Allegre C.J., Courtillot, V., Tapponier, P. et al., 1984. Structure and evolution of the Himalayan Tibet orogenic belt. Nature, 145: 17-22.
- Banerjee Paramesh and Satyaprakash., 1999. Using Global Positioning System (GPS) for orthometric height determination for gravity surveys in Ladak. Current Science, 76 (2): 243-246.
- Banerjee Paramesh, Foulger, G.R., Satyaprakash, and Dabral, C.P., 1999. Geoid undulation modeling and interpretation at Ladakh, NW Himalaya using GPS and leveling data. Journal of Geodesy, 73: 79-86.
- Banerjee Paramesh, 1998. Gravity measurements and terrain corrections using a digital terrain model in the NW Himalaya. Computers & Geosciences, 24 (10): 1009-1020.
- Barazangi, M. and Ni, J.F., 1982. Velocities and propagation characteristics of Pnand Sn beneath the Himalayan rc and Tibetan plateau: possible evidence for underthrusting of India continental lithosphere beneath Tibet. Geology, 10: 179-185.
- Coward, M.P. and Butler, R.W.H., 1985. Thrust tectonics and the structure of the Pakistan Himalaya. Geology, 13: 417-420.
- Coward, M.P., Kidd, W.S.F., Pan Yun, Schackleton, F.R.S. and Zhang Hu, 1988. The structure of the 1985 Tibet geotraverse, Lhasa to Golmud. Phil. Trans. R. Soc. A, 327: 307-36.
- Das, D., Mehra, G., Rao, K.G.C., Roy, A.L., and Narayana, M.S., 1979. Bouguer, free air and magnetic anomalies over northwestern Himalayas, Himalayan Geology Seminar, Section III, Oil and Natural Gas Resources, Geol. Surv. India, Misc. Publ. 41: 141-148.
- Dewey, J.F., Cande, S. and Pitman, W.C., 1989. Tectonic evolution of the India/Eurasia collision zone. Eclog. Geol. Helv. 82(3): 717-734. England, P.C. and Houseman,
- G.A., 1988. The mechanics of the Tibetan plateau. Phil. Tran. Roy. Soc. A., 326: 301-320.
- Hildernbrand, T.G., 1983. FFTFIL: A filtering program based on two-dimensional Fourier analysis of geophysical data. USGS Open File report. 83-237.
- Jin, Y., McNutt, M.K. & Zhu, Y.S., 1994. Evidence from gravity and topography data for folding of Tibet. Nature, 371: 669-674.
- Jin, Y., McNutt, M. and Zhu, Y., 1996. Mapping the descent of the Indian and Eurasian plates beneath the Tibetan plateau from gravity anomalies. J Geophys Res 101 (B5): 11275-11290.
- Karki, P., Kivioja, L. and Heiskanen, A., 1961. Topographic isostatic reduction maps for the world for the Hayford zones 18-1, Airy-Heiskanen system, T=30 km. Publications Isostatic Institude of International Assoc. of Geodesy. no.35.
- Kono, M., 1974. Gravity anomalies an east Nepal and their implications to the crustal structure of the Himalayas. Geophy. J. Royal Astr. Soc, 39: 283-300.
- Lyon-Caen, H. & Molnar, P., 1985. Gravity anomalies, flexure of the Indian plate, and structure, support and evolution of the Himalaya and Ganga Basin. Tectonics, 4: 513- 538.
- Makovsky, Y., Klemperer, L. and Ratschbacher, L., 1999. Midcrustal reflector on INDEPTH wide-angle profiles: An ophiolitic slab beneath the India-Asia suture in southern Tibet. Tectonics, 18 (5): 793-808
- Matte, P.H.., Mattaeur, M., Olivet, J.M., and Griot, D.A., 1997. Continental Subductions beneath Tibet and the Himalayan Orogeny: A review. Terra Nove, 9: 264- 270.
- Molnar, P, and Tapponnier, P., 1975. Cenozoic tectonics of Asia: Effects of a continental collision. Science, 189: 419-426.
- Nelson, K.D., Zhao, W. and team, 1996. Partially molten middle crust beneath southern Tibet; synthesis of Project INDEPTH results. Science, 274: 1684-1688.
- Parker, R.L., 1972. The rapid calculation of potential anomalies. Geophys. J. Roy. Astron. Soc., 31: 447-455.
- Patriat, P. and Achache, J., 1984. India-Eurasia collision chronology has implication for crustal shortening and driving mechanism of plates. Nature, 311: 615-621.
- Powell, C.A. and Conaghan, P.J., 1973. Plate tectonics and the Himalayas. Earth Planet. Sci. Lett., 20: 1-20.
- Qureshy, M.N. and Midha, R.K., 1986. Deep crustal signature in India and contiguous regions from satellite and ground geophysical data. In M. Barazangi and C. L.
- Brown (editors.), Reflection Seismology : The Continental crust. Geodynamic Ser., Am. Geophys. Union, New York, USA. pp 77-94.
- Rapp, R.H., 1997. Use of potential coefficient models for geoid undulation determination using a spherical harmonic representation of the height anomaly/geoid undulation difference. Jour. of Geodesy, 71: 282-289.
- Rodgers, J.A. and Schwartz, Y.S., 1997. Low crustal velocities and mantle lithospheric variations in southern Tibet from regional Pnl waveforms. Geophys Res. Lett., 24: 9-12.
- Simpson, R. W., Jachens, R. C. and Blakely, R. J., 1983. AIRYROOT: A Fortran program for calculating the gravitational attraction of an airy isostatic root out to 166.7 Km. USGS Open File Report. 83-883.
- Sun, W., 1989. Bouguer gravity anomaly map of the People’s Republic of China, Chin, Acad. of Geoexplor. Beijing.
- Talwani, M., Wortzel, J. L. and Landisman, M., 1959. Rapid computations for two-dimensional bodies with application to the Meandocino submarine fracture zone. Jour.Geophys.Res., 64: 49-59.
- Tapponnier, P. and Molnar, P., 1976. Slip line field theory and large scale continental tectonics. Nature, 264: 319-324.
- Verma, R.K. and Banerjee, Paramesh., 1992. Nature of continental crust along the Narmada-Son lineament inferred from gravity and deep seismic sounding data. Tectonophysics, 202: 373-397.
- Verma, R.K., 1985. Gravity, Seismicity and tectonics of the Indian Peninsula and the Himalayas. D. Reidel, Hingham, Massechusetts, 213 pp.
- Warsi, W.E.K. and Molnar, P., 1977. Gravity anomalies and plate tectonics in the Himalaya, In: Coll. Intern. CNRS: Himalaya Sciences de la Terre, CNRS, Paris, 268, 463-478.
- Willett, S.D. and Beaumont, C., 1994. Subduction of Asian lithospheric mantle beneath Tibet inferred from models of continental collision. Nature, 369: 642-645.
- Zhao, W. and Morgan, J., 1985. Uplift of Tibetan Plateau. Tectonics, 4: 359-369.
Figures
- Figure 1
- Geological map of the NW Himalaya showing the Kiratpur-Manali-Leh- Panamik transect. (after Fuchs & Linner, 1995)
- Figure 2
- a) Free Air anomaly and topography along the KLP transect b) Complete BA and IA
- Figure 3 a, b, c, d
- a) part of the original map by Jin et al., (1994), b) The BA map for the area under study, extracted from (a), d) New Bouguer anomaly map of NW Himalaya.
- Figure 4
- New Isostatic anomaly map based on the BA map (3.1d)
- Figure 5
- a) Elevation, b) Geoid undulation and c) BA along Rumtse-Panamik profile.
- Figure 6
- Result of Spectral analysis for bodies causing gravity highs along Pang-Panamik section
- Figure 7
- Match for residual anomaly between Pang and Panamik
- Figure 8
- Match for the regional anomaly and shape and depth of the inferred source body.
- Figure 9
- Subsurface structure for the Pang-Panamik section based on the match of Bouguer gravity anomalies.
- Figure 10
- Isostatic anomaly, elevation and Airyroot for the Kiratpur-Manali-Leh-Panamik profile.
- Figure 11
- Match for the isostatic anomaly after modifying the airyroot, to account for the isostatic high over the higher Himalaya.
- Figure 12
- Composite model for the Himalaya, Indus suture zone and Shyok suture zone.
- Figure 13
- Interpretive geological cross section based on gravity and geoidal data from ITSZ.
Tables
- Table I
- Table showing the density of the rock samples collected from the region and measured for density estimation.