Balakrishnan, T.S. 2003. Impact of gravity and other geophysical data on the geology of Indian subcontinent.
Journal of the Virtual Explorer 12, 83-92.
Impact of gravity and other geophysical data on the geology of Indian subcontinent.
Abstract
Geological surveys in the Indian Subcontinent over the last hundred years or so have produced a corresponding map of excellent quality. However due to innate limitations of the methods used, large areas are left blank. These include the areas covered by alluvium, the coastal belts and offshore regions. Since the middle of the 20th century, hydrocarbon and mineral exploration have inducted a great deal of geophysical information which projects surface knowledge into the deeper crust. A fund of scientific knowledge has accumulated which is slowly being absorbed into geology. The present paper gives a brief idea of how the gravity and other geophysical data have contributed to this fund of knowledge. The stress is essentially on crustal structure as it exists today and cuts across the time element. Three important areas have been selected to show the power of the method. The first is the Himalaya-Tibet region and its relation to the Indo Gangetic plains. The second is the Eastern sector illustrating how the Burmese plate has over ridden pre Cambrian India. The third is an analysis of the Western sector showing how a transect across the Aravalli Range by deep seismic sounding can lead to interesting information about the segmentation of the western side of the continent.
Introduction
Over a century of geological field mapping by the Geological Survey of India has led to the publication of the Geological Map of India (GSI, 2000) and adjacent areas. It represents the surface geology of all the areas designated “hard rock areas,” where the formations are exposed. The map is however blank in large areas which are under alluvial cover. These are the Indo-Gangetic plains with their extension into Assam, the coastal sedimentary belts and the continental shelf. The subsurface geology is missing, and much of the knowledge in this field is by inference from surface data.
Since the middle of the 20th century much sub-surface information has been gathered by the activities of institutions involved in hydrocarbon exploration. The National Geophysical Research Institute (NGRI) and National Institute of Oceanography (NIO) have also been active in this field. The stage is now set for the assimilation of all this information and its integration into the Geological Map. Some of the major conclusions arrived at by the author have been indicated in this paper.
The principal sources of information are the gravity and magnetic anomalies measured in the subcontinent as also the wealth of knowledge derived from reflection and refraction seismic data. All these measurements have been made on the ground, by aeromagnetic surveys and satellite observations. The most comprehensive information at present is obtained from gravity anomalies that are available all over the subcontinent, the offshore areas, the
Himalayan region and in Tibet. Corresponding magnetic data is under compilation. Seismic data is available essentially in the sedimentary basins.
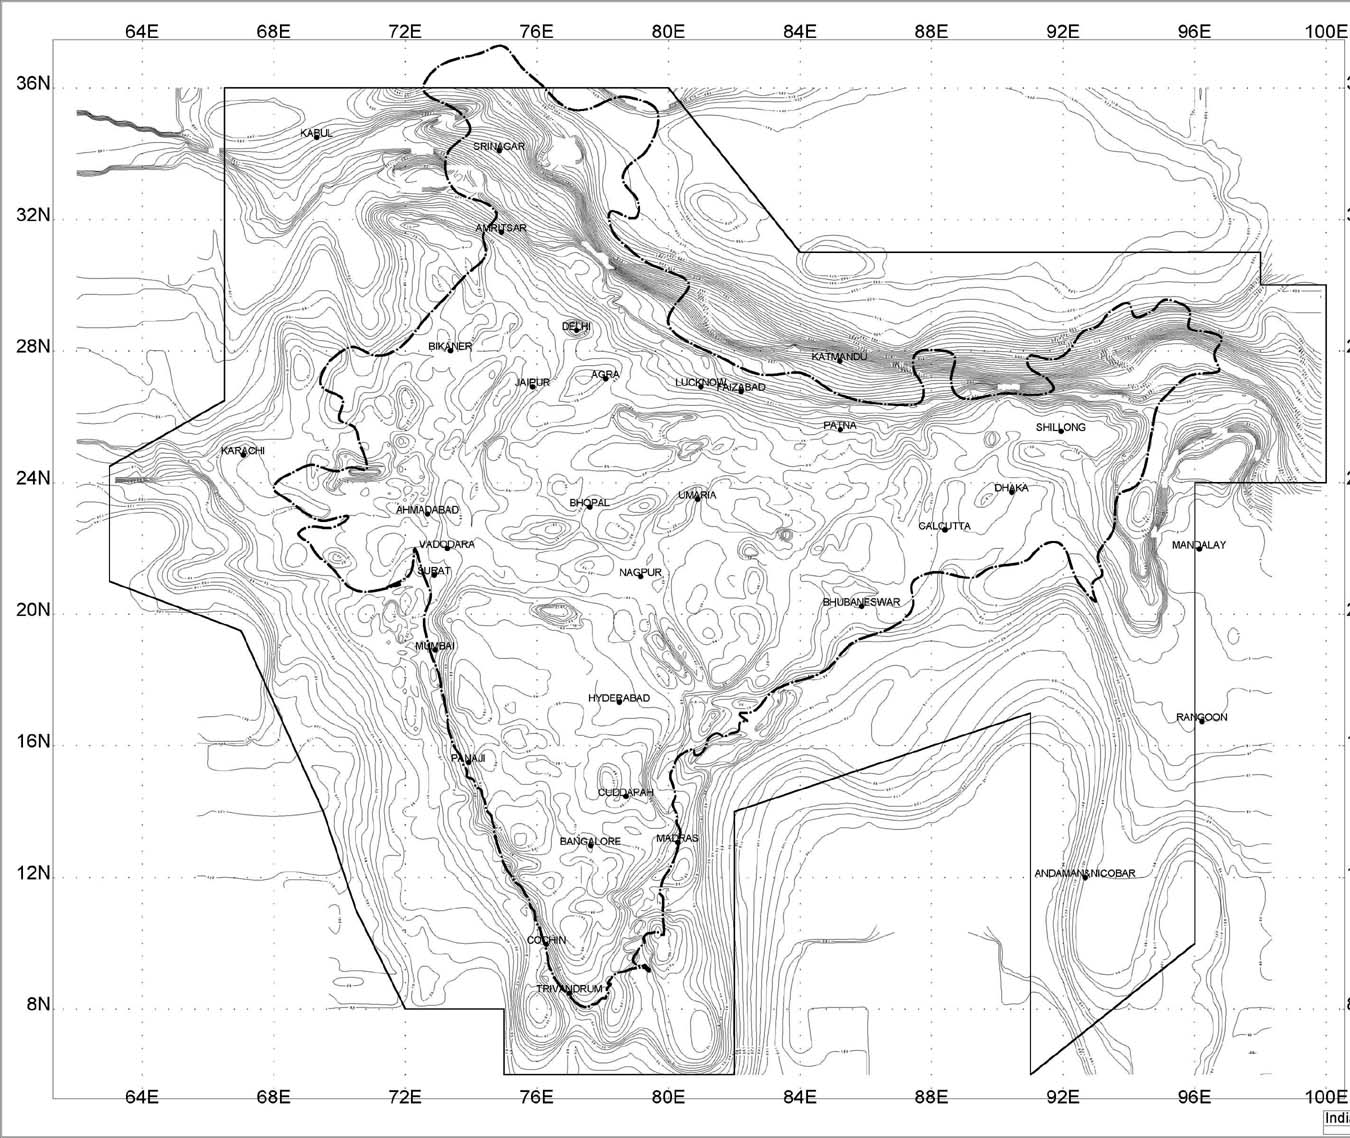
The Bouguer gravity anomaly (NGRI, 1975) is positive in the Bay of Bengal and the Arabian Sea. The zero anomaly contour more or less skirts the coast line. The sub continent proper has a negative anomaly. The Himalayas and Tibet have a very large negative anomaly. The broad picture depicts the lack of a low-density (Sialic) crust in the seas, a normal sialic crust on the subcontinent and a very thick sialic crust in the Himalayas and Tibet. The thickness of the crust increases all the way from Central India, across the High Himalaya and well into Tibet. The gradient gives way near the Indus-Brahmaputra suture zone. One can recognize the Indian plate rapidly sinking into the mantle and replaced by the Eurasian plate in this zone. Figure 1 redrawn from Balakrishnan (1997) gives the Bouguer gravity anomaly of the Indian subcontinent and contiguous area and incorporates information from gravity map of India including Pakistan (Roy, 1963; NGRI, 1975), Nepal, Tibet, Bangladesh (Abdulla, 1990), Burma (Evans and Crompton, 1946) Indian Ocean and Bay of Bengal (Udintsev, 1975).
Himalayas and Tibet
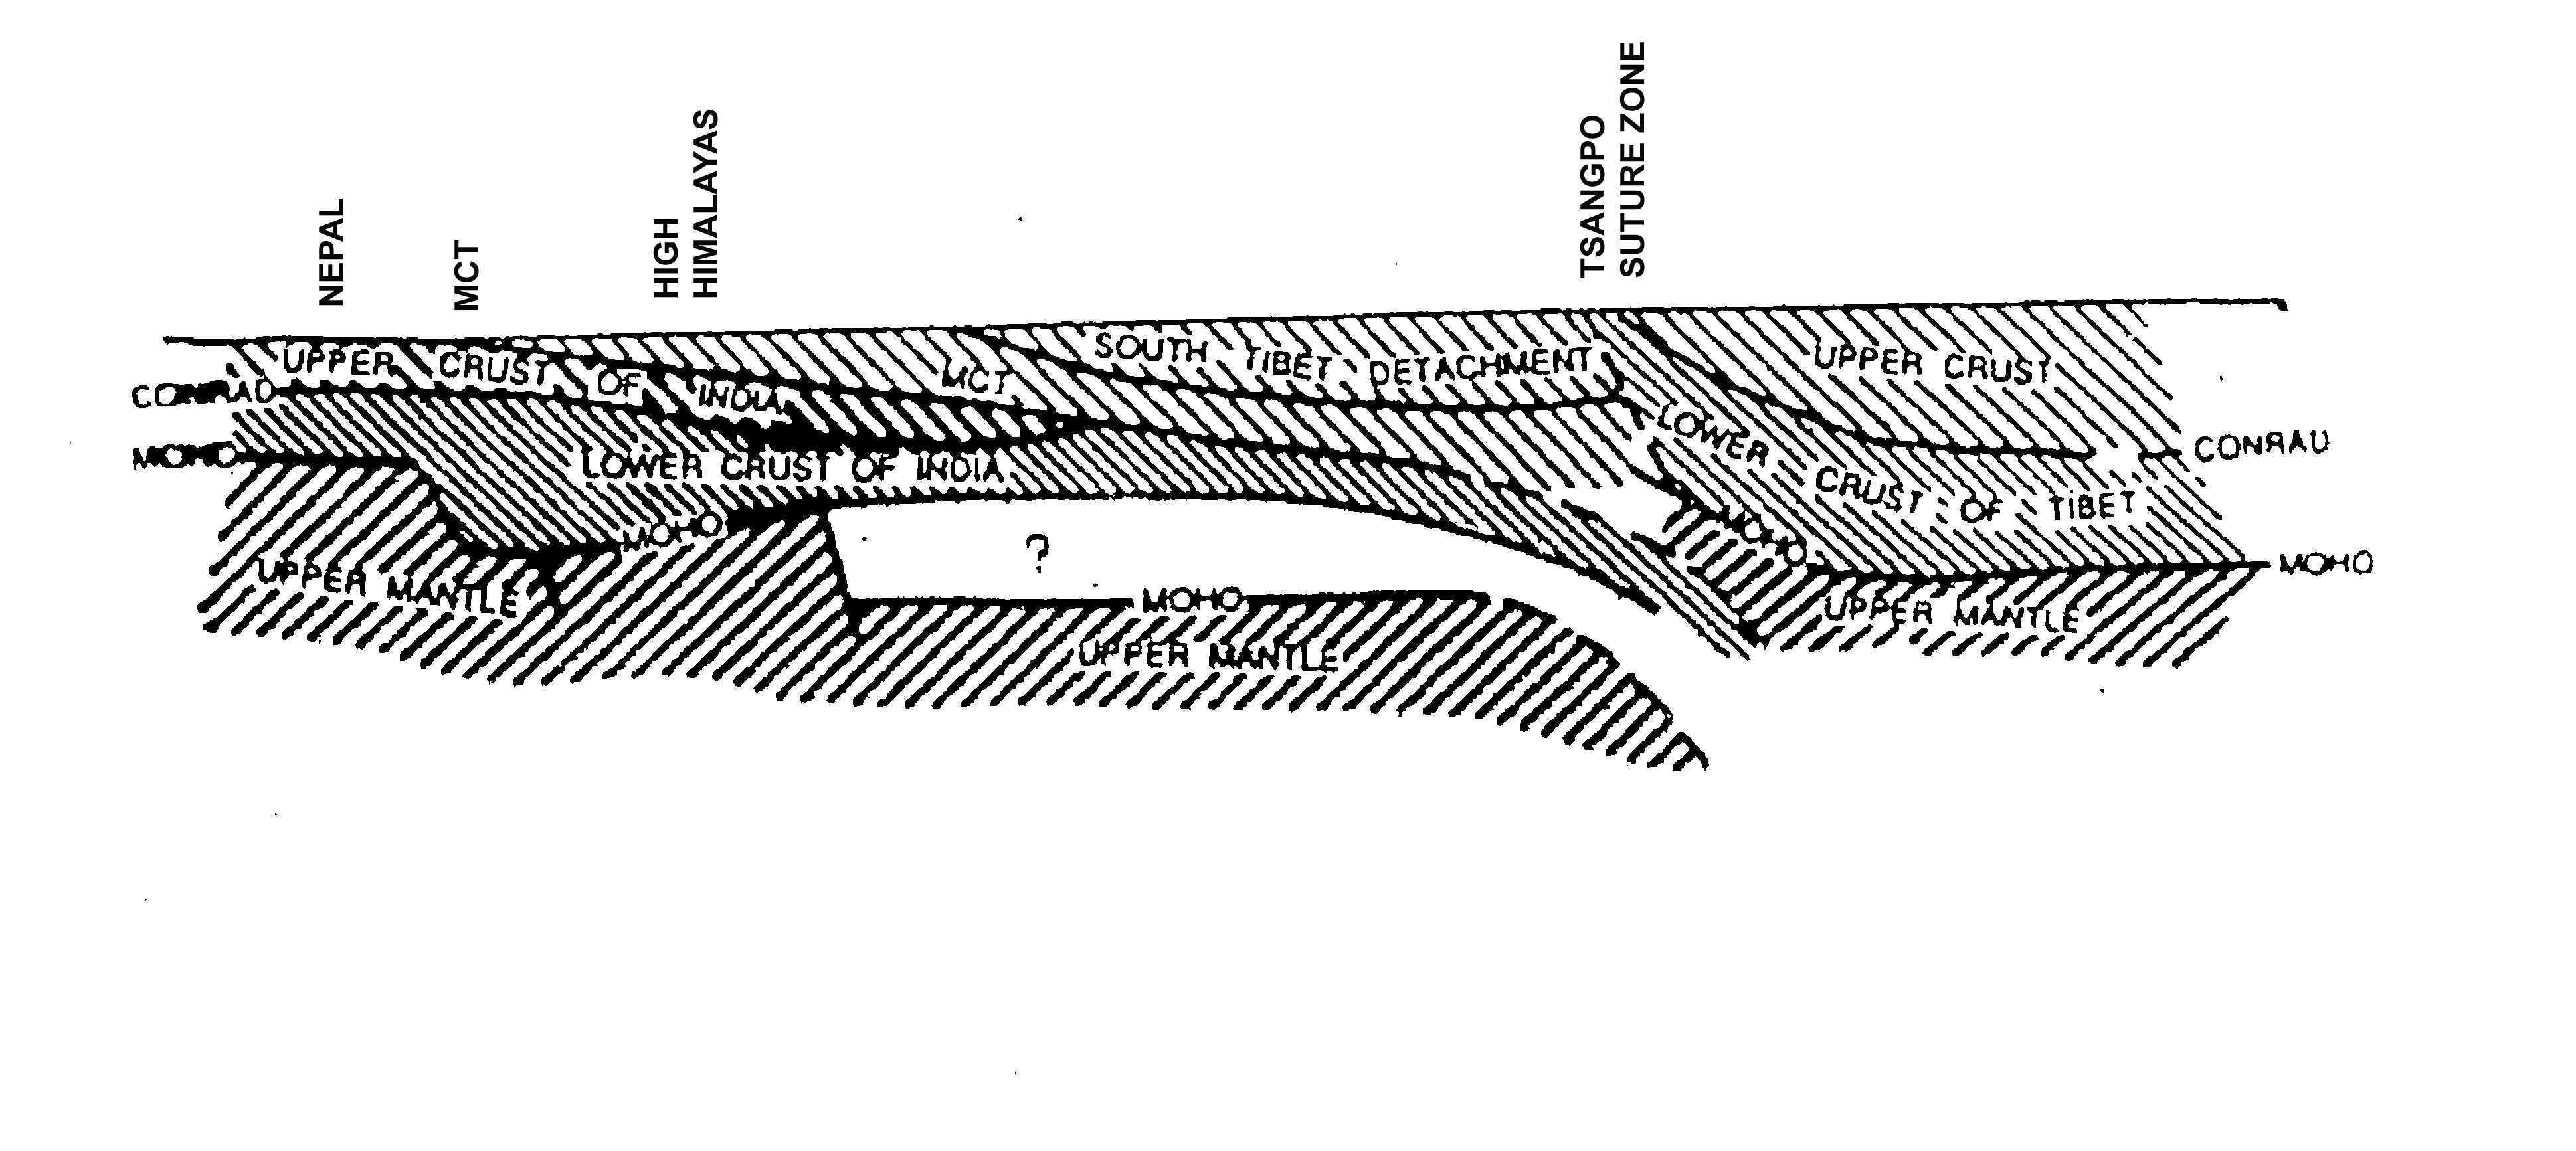
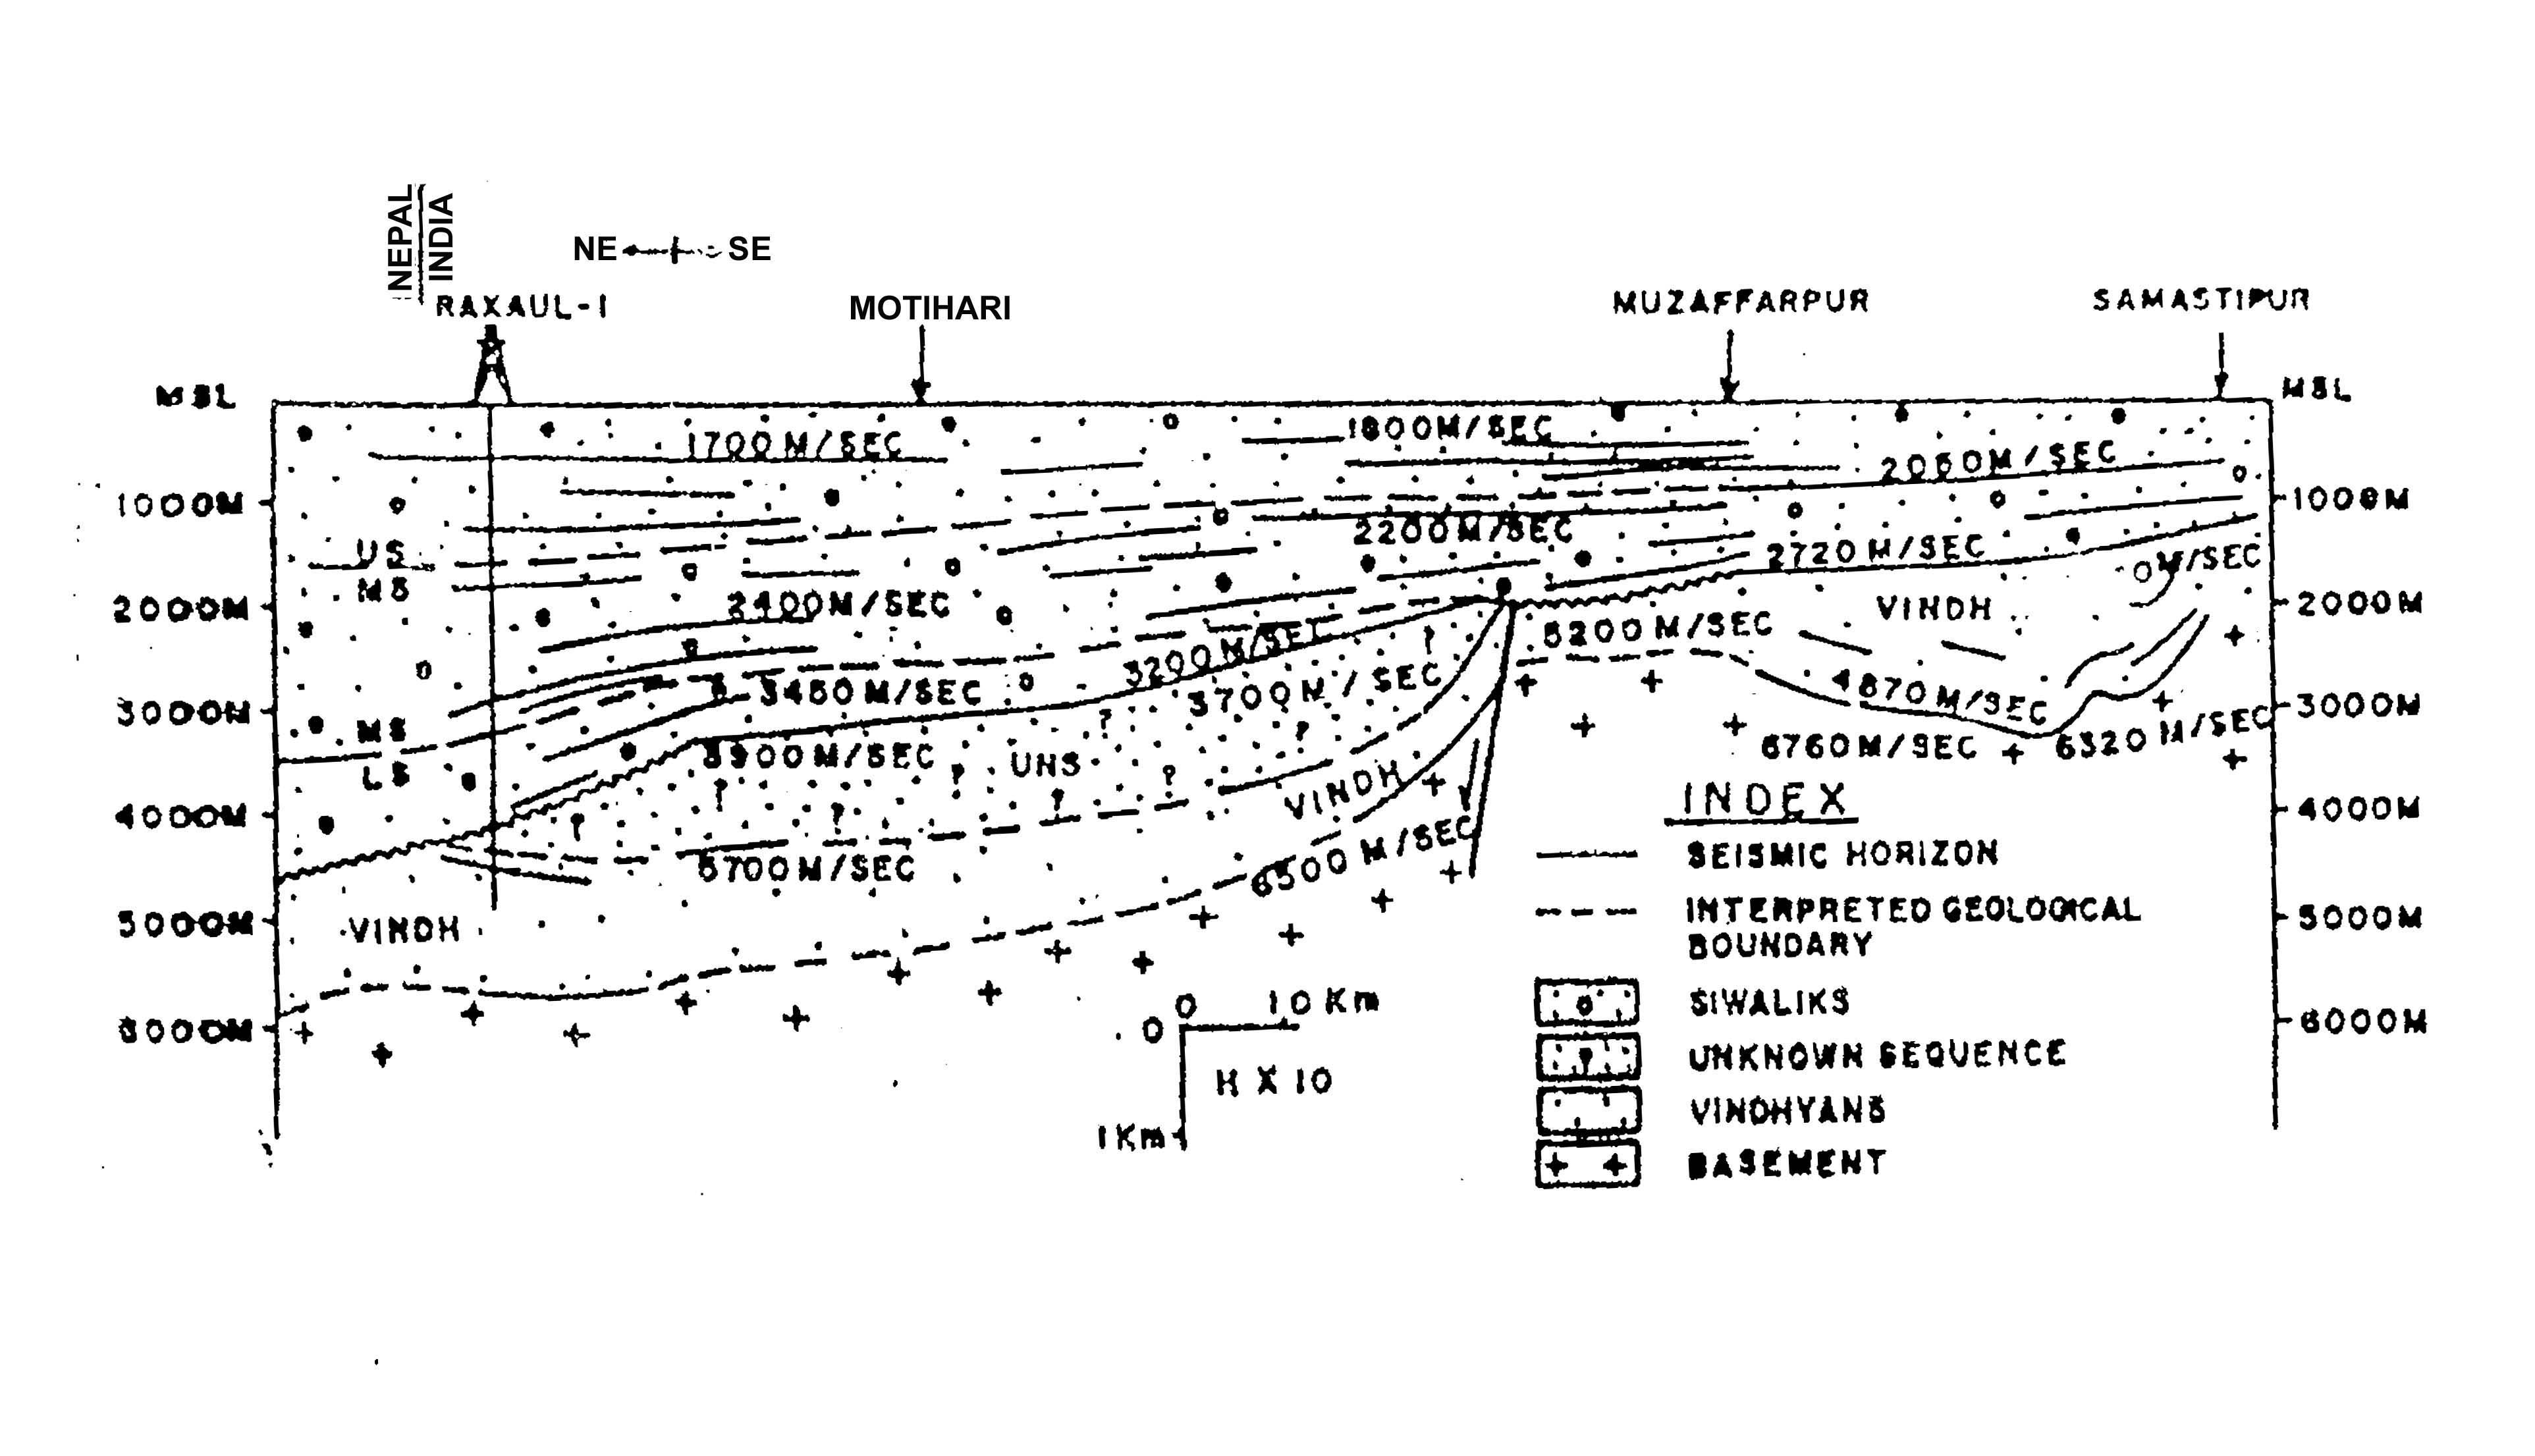
The subcontinent proper is a part of the Indian plate. It is a shield area of Pre Cambrian age. It is traversed by a number of major rifts. Some of these are filled with Precambrian sediments (Vindhyan and older), Gondwana sediments and tertiary sediments (in the north). In pre collision times it was bounded on the north by the Tethys sea. In the course of continental drift the Tethys sea disappeared under the Eurasian plate in the north leading to a continental collision between the Indian and Eurasian continents. Subsequent pressure led to the fracture of the northern part of the shield and its piling up on the part south of it. This led to the crustal thickening now observed. In effect the rifted Indian Pre-Cambrian shield is thus over thrust by a part to the north of it. One would therefore expect the down thrust part to retain its rifted character. The presence of large faults in that part has to be traced. An interesting section has been published by the French-Chinese expedition in S. Tibet and combining it with INDEPTH-1 expedition a section has been produced by Balakrishnan (1997) shown here as figure 2. The Moho is seen at three different depths. It is at 35 km in the Kathmandu Valley in Nepal, at 55 km in the Everest region and at 75 km in S. Tibet. The changes take place abruptly. The first drop is near the Main Central Thrust (MCT) and the second about 20 km north of Everest in the High Himalayas. These two major faults should be identified with preexisting faults in the down thrust Indian shield. One can also notice a surface well above Moho level with a velocity of about 6.4 km/sec. extending from the Tsangpo suture zone up to the Kathmandu Valley. This is apparently the plane separating the upthrust and down thrust blocks. It lies at a depth of 28 km in S. Tibet and at about 10 km depth in the Kathmandu Valley. Its apparent southward extension into the Ganga plains has been observed in a seismic refraction profile (Agarwal, 1977) from Muzaffarpur to Raxaul in Bihar state (Figure 3). At Muzaffarpur it lies at a depth of 3 km below surface and at about 6 km below surface at Raxaul to the NE. This probably represents the Great Indian Detachment extending from the Ganga plains to the suture zone. It would account for the continuously decreasing negative anomalies along that line.
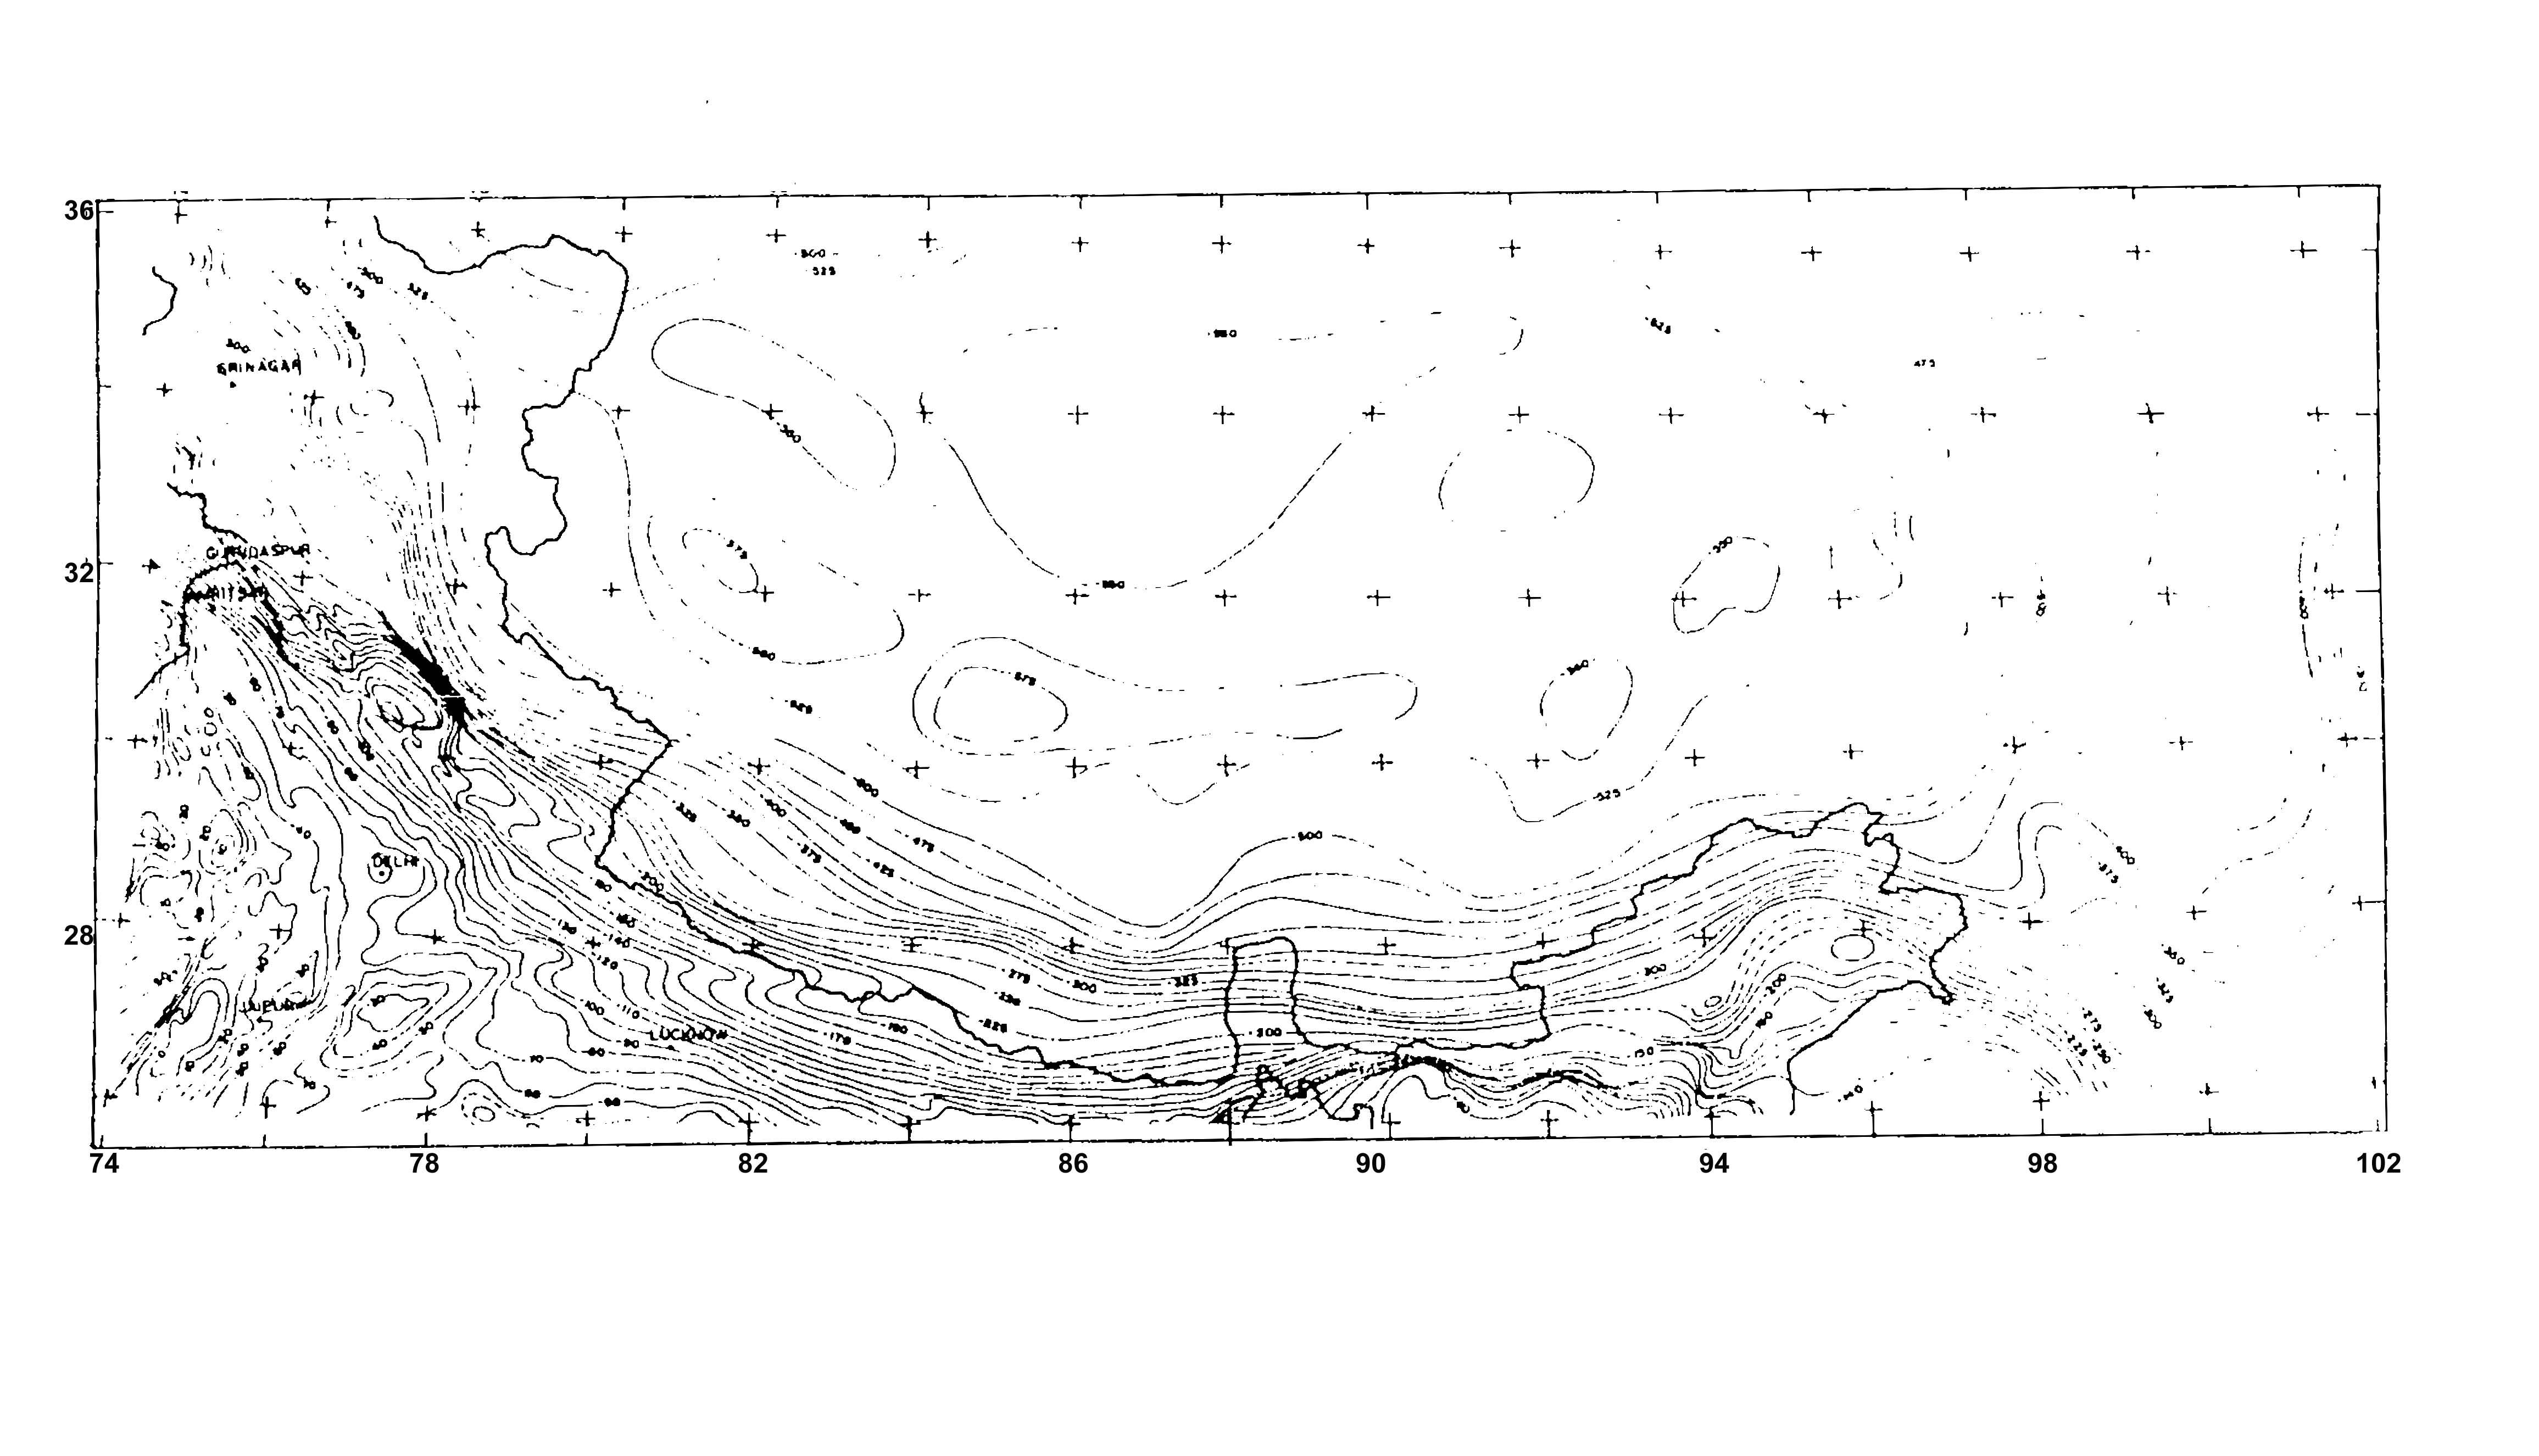
The areal extension of the southern end of this detachment can be inferred from the gravity anomaly map. It is an area of relatively large gravity gradients stretching from the NW Frontier province in Pakistan to Arunachal Pradesh in NE India. (Figure 4).
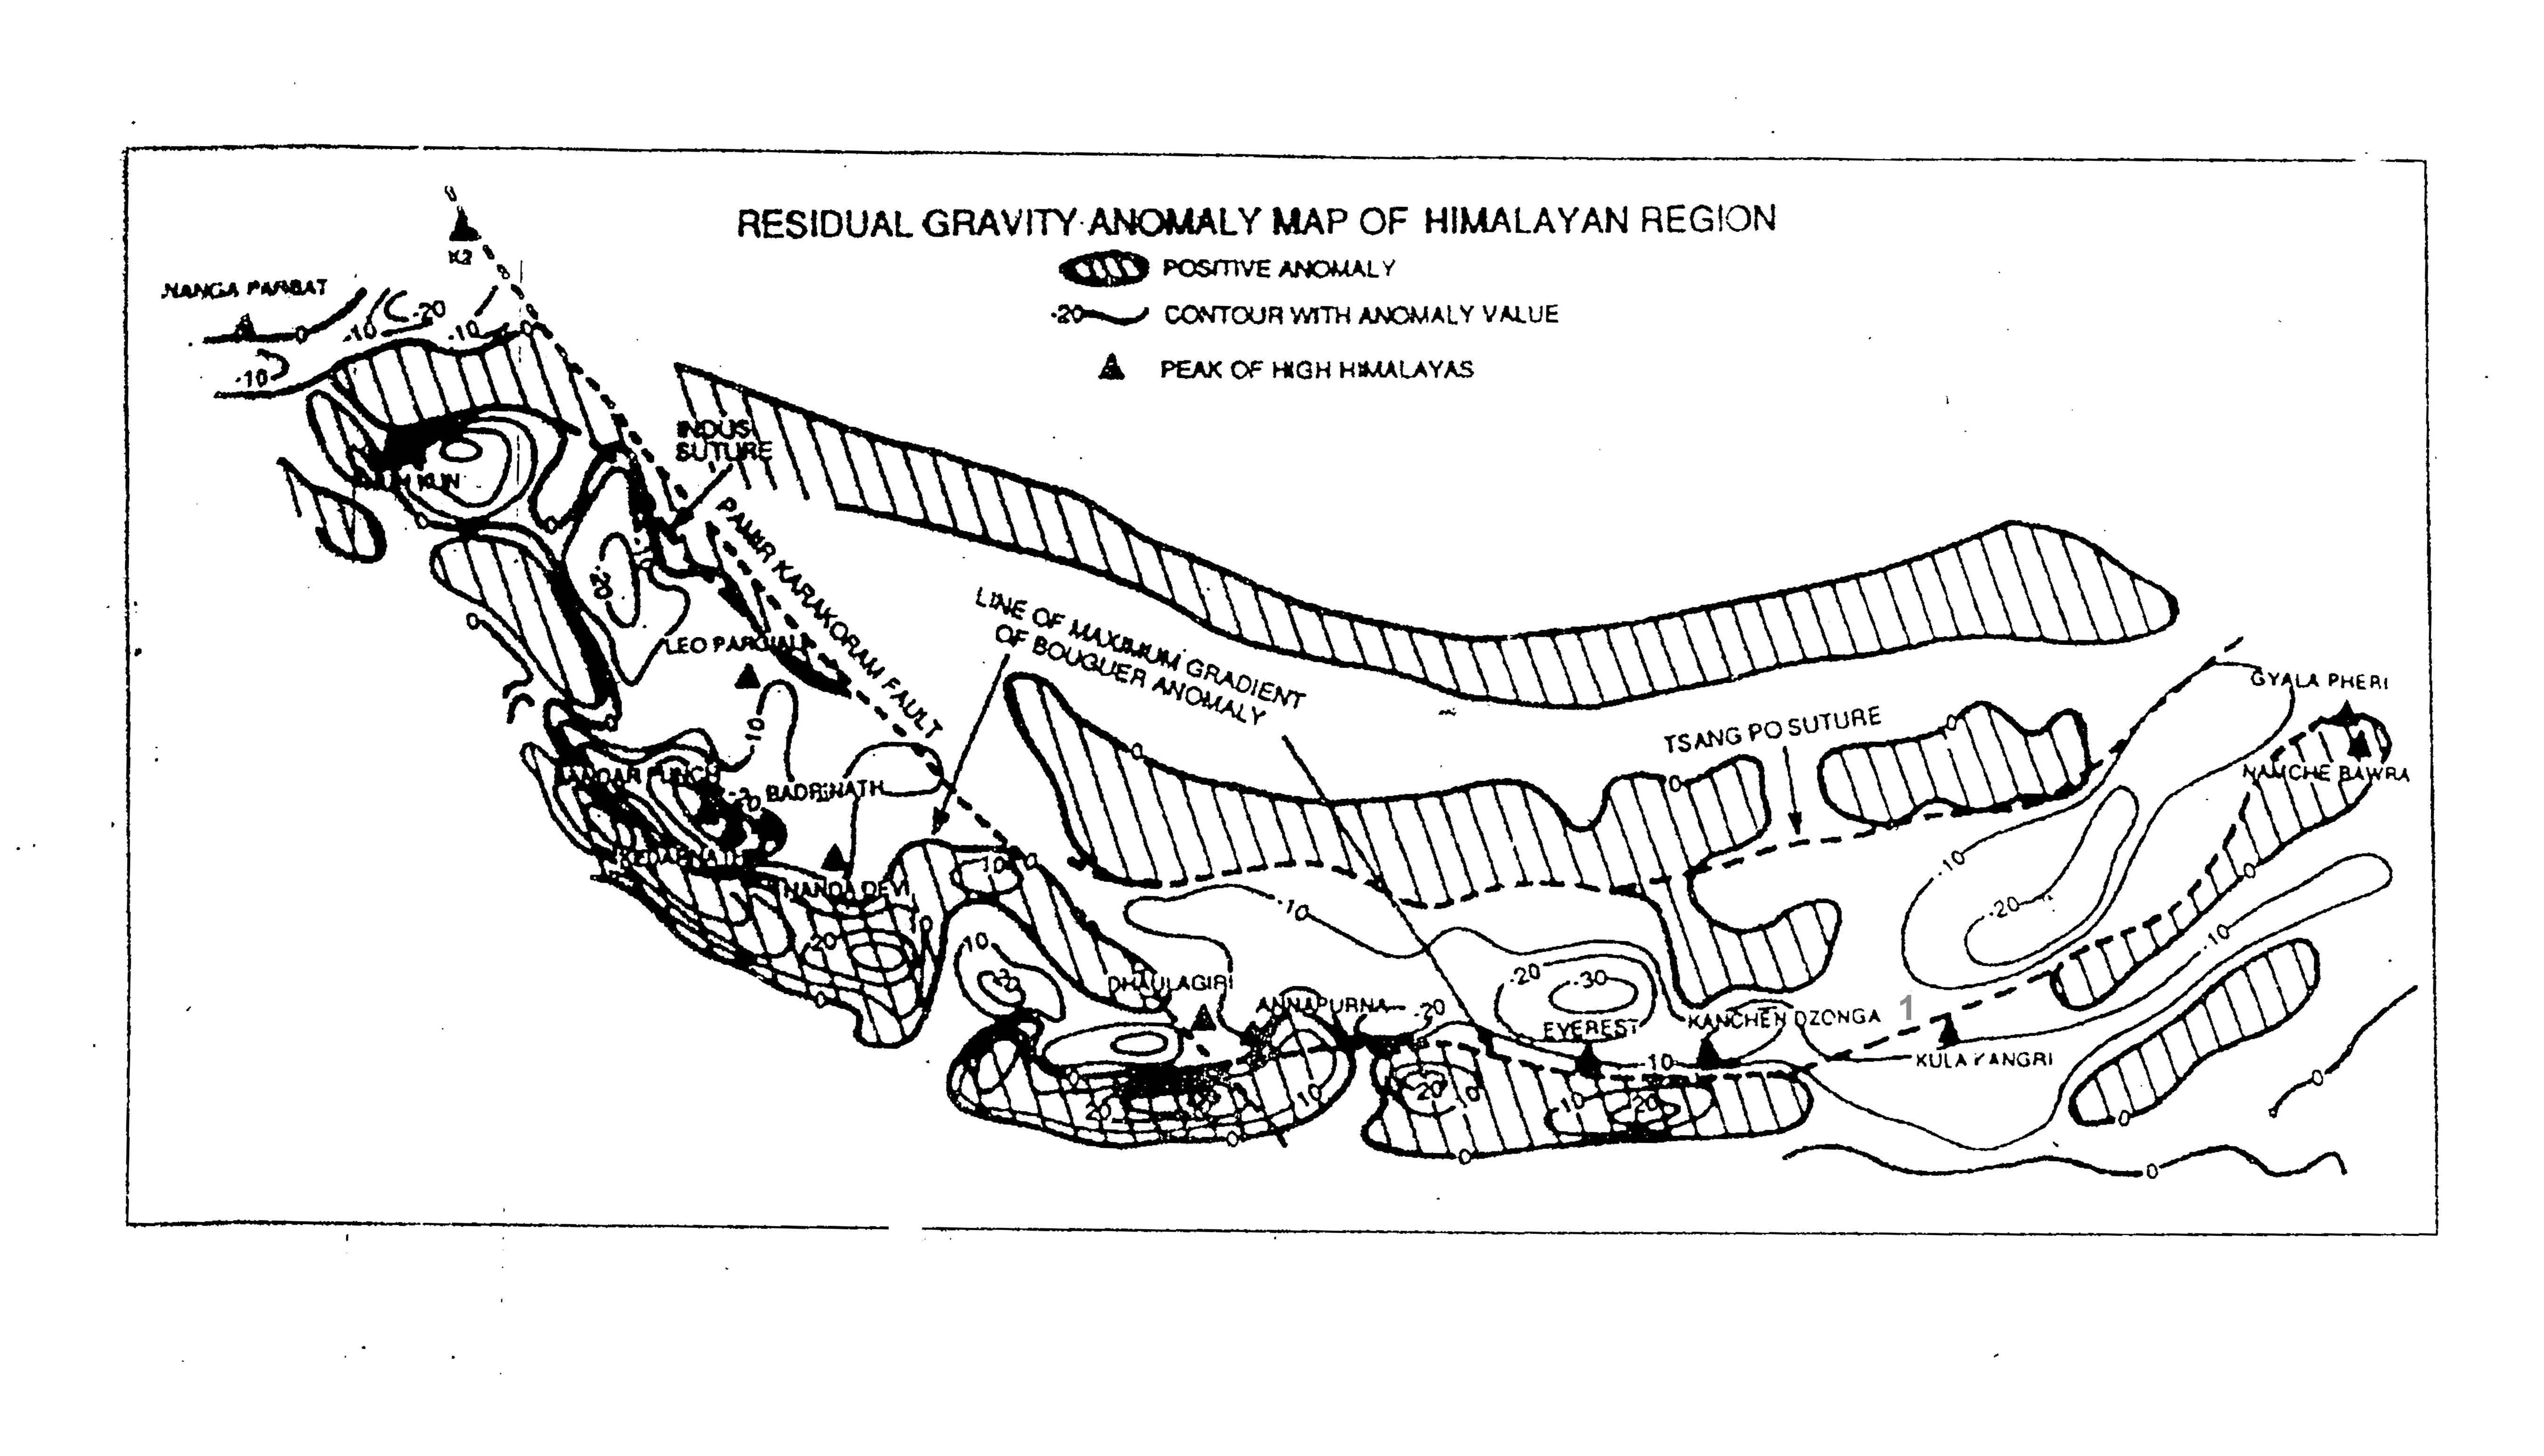
The major fault zones in the subthrust plate below the Himalayas mentioned earlier can be located by reference to the gravity anomaly map of Himalayas and Tibet. Between the Main Central Thrust (MCT) and the suture zone there is a region of high gravity anomaly gradients. This is where the sialic thickness rapidly increases. Even within this region there are narrow bands where the gradient is unusually high. We associate these bands with the regions of major faulting in the subthrust plate. We have already seen earlier that the depth to Moho does not continuously increase, but does so in discrete steps. A little observation will show that the faults observed seismically coincide with the zone of highest gravity gradients. To locate the faults more accurately it is convenient to prepare a residual gravity anomaly map (Figure 5). The zero contours on this map will be the position of the faults. It will be observed that the faults are very close to the MCT. We thus see that sudden increase in sialic thickness occurs close to the MCT.
Comparing this with the rapid increase in topographic elevation across the MCT one can notice that this is a clear case of isostatic adjustment – an increase in sialic thickness is accompanied by a corresponding uplift of the block.
The Eastern Sector
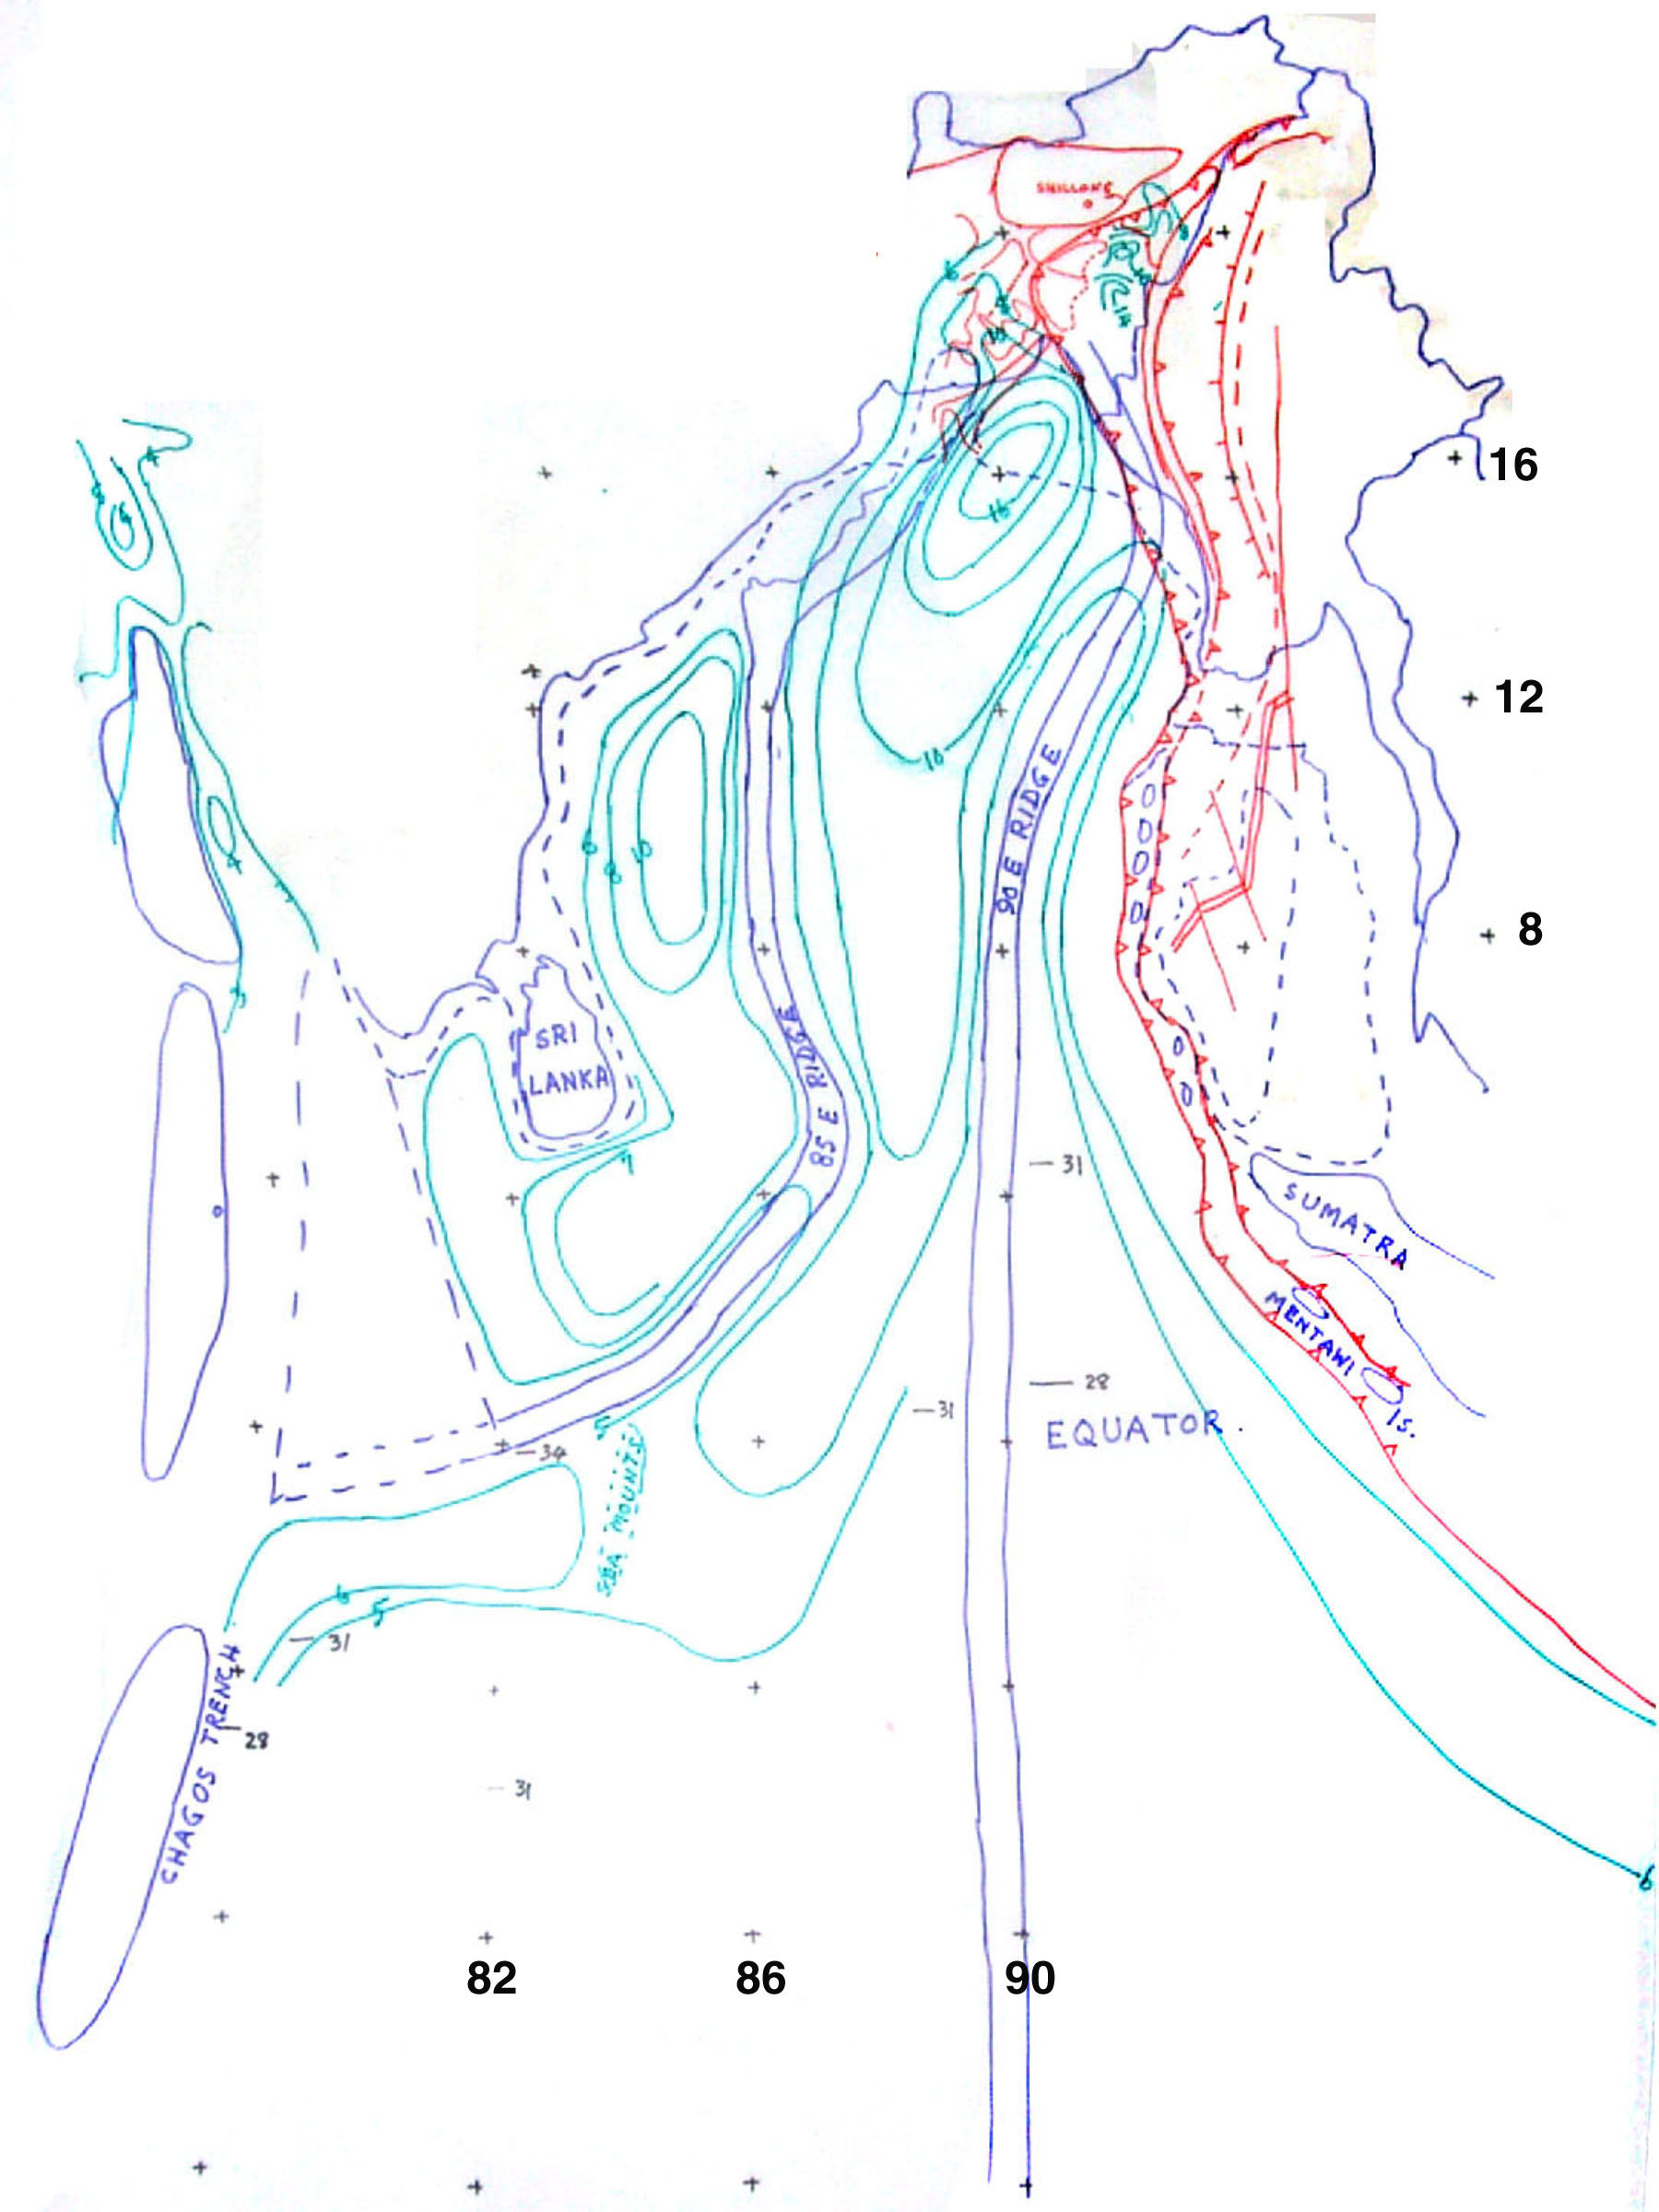
In this sector we include the Bay of Bengal, the Bengal Basin, Bangladesh and the Chittagong-Tripura hills, the NE states of India, Burma, Andamans & Nicobar and their extension south of Sumatra (Mentawi Islands) (Figure 6).
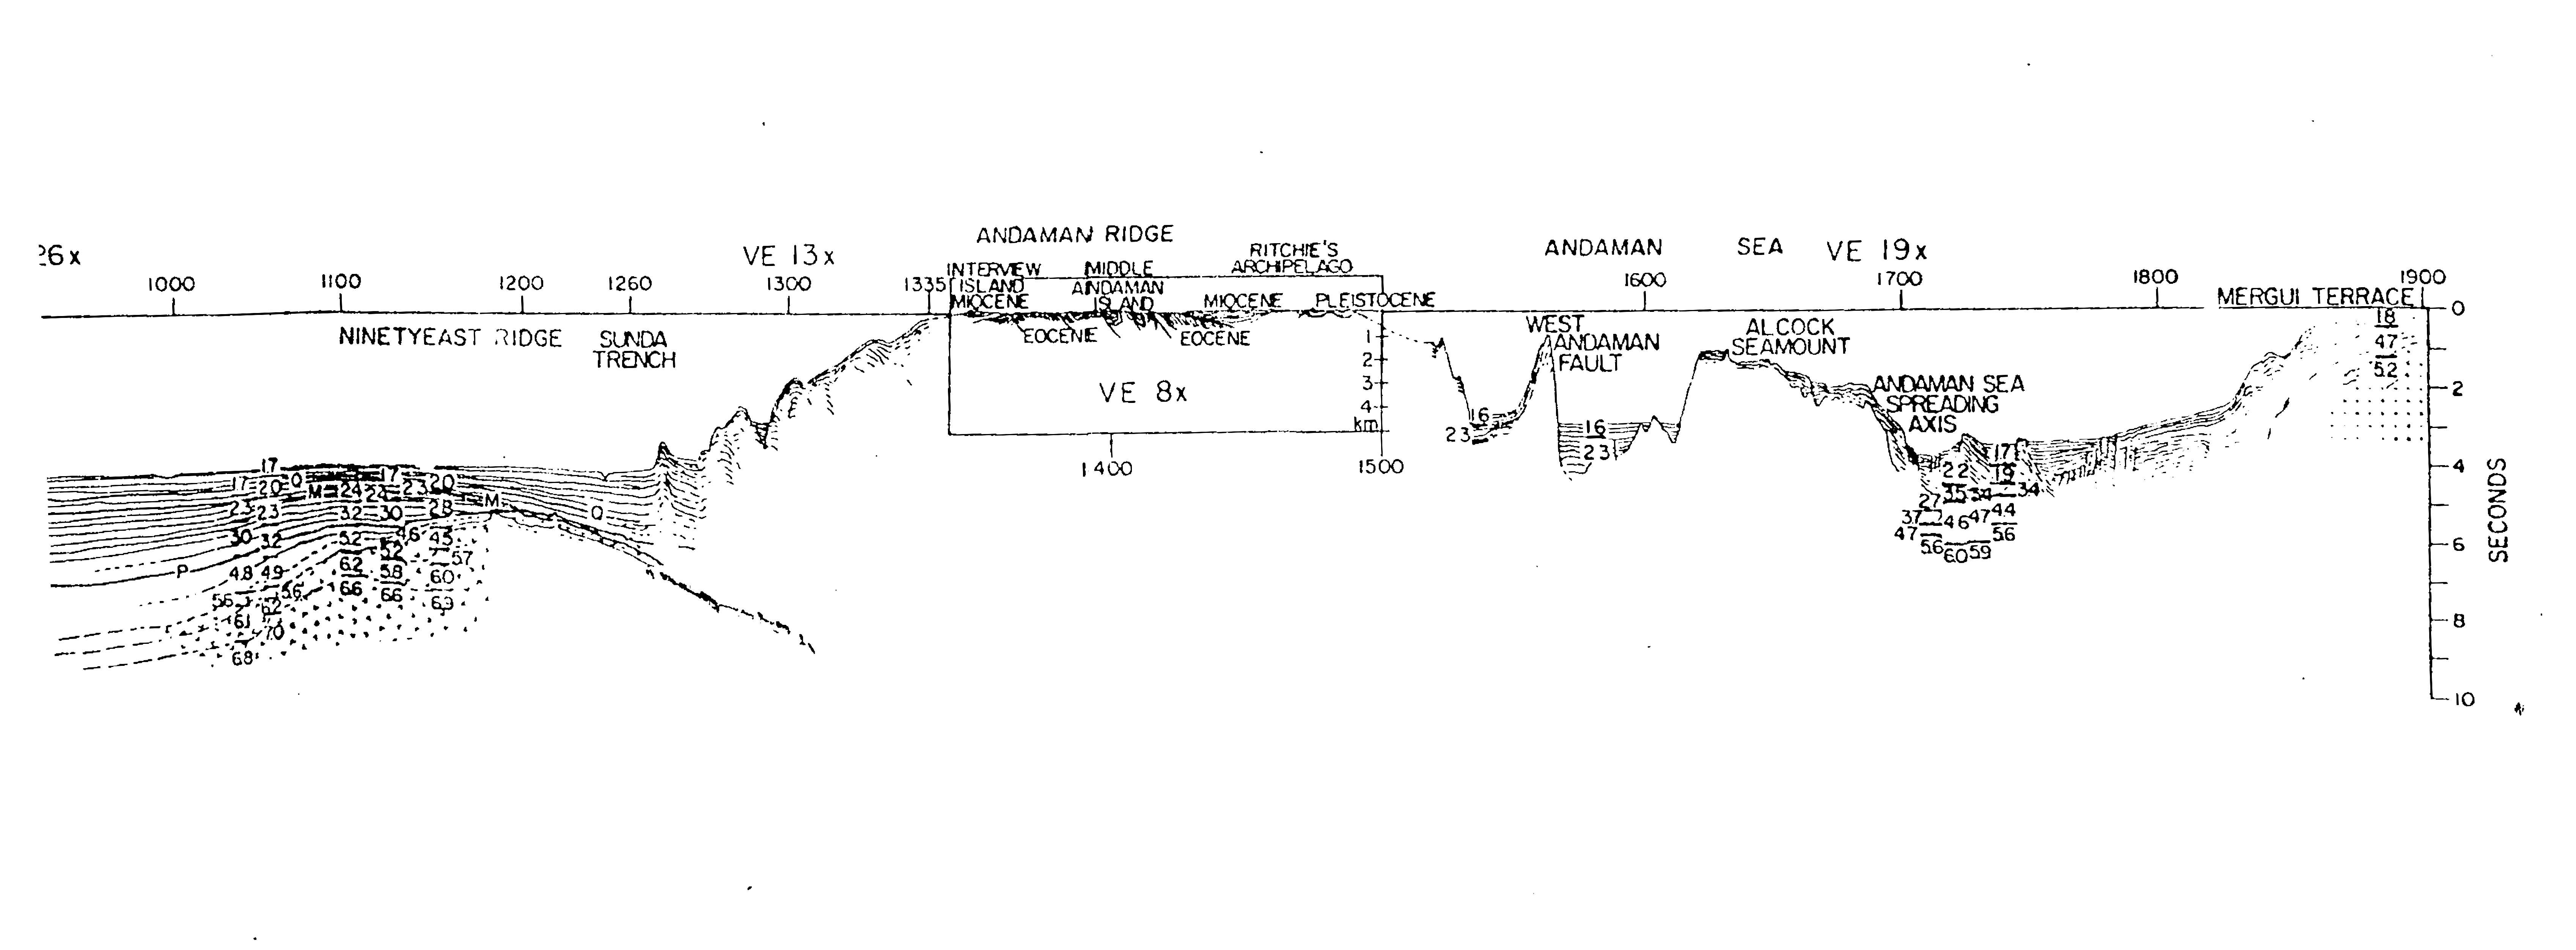
The Sunda Trench with about 7 km water depth lies immediately south of the Mentawi islands. It is the deep in front of the Indonesian subduction zone. The Mentawi Islands project northwestward to form the Andaman & Nicobar Islands. The 90 E ridge runs west of the Andaman Islands and has been traced seismically upto around 17o latitude where it plunges obliquely under the Burmese shelf. The sediments on the Bay of Bengal are horizontal in attitude west of the Burmese/Andamans shelf (Figure 7). Further east they break into a series of thrusts that constitute the Chittagong hills. The next element eastwards is the Arakan Yoma thrust in Burma which continue southwards as the Andaman and Nicobar islands where the main element is the Jarwa thrust.
The basement of the 90 E ridge plunges eastward steeply under the thrusts of the Andaman Islands and forms the subduction zone. The area between the 90 E ridge and the Andaman shelf is the extension of the Sunda Trench.
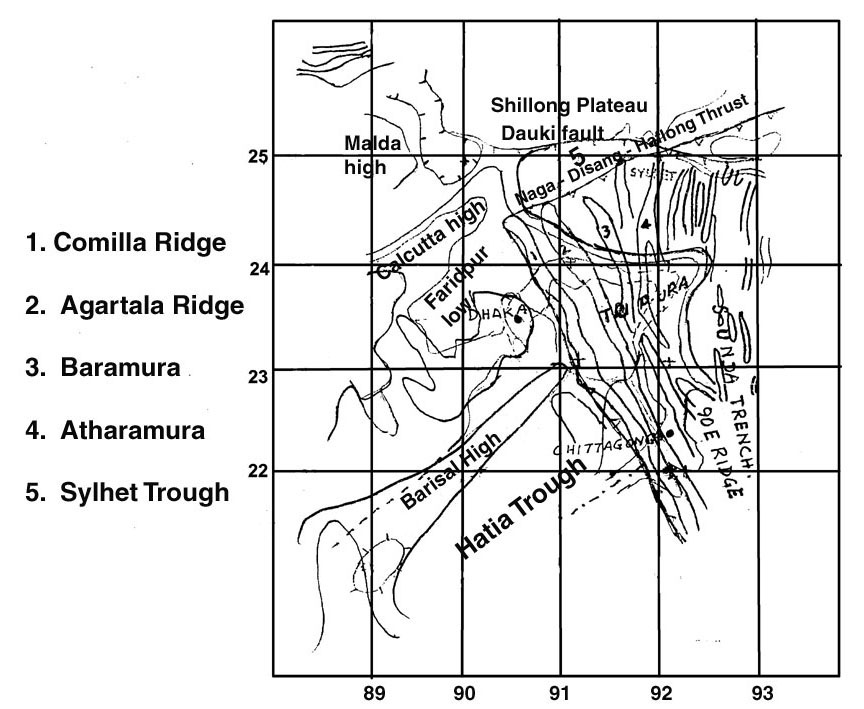
To determine the northern extension of the 90 E ridge one appeals to the gravity picture of the Chittagong hills (Figure 8). A well-marked high axis connecting the ridge with Tripura represents this extension. A low axis is noticed between this high and the Arakan Yoma and one can readily conclude that this low represents the northern extension of the Sunda Trench (Figure 8), hidden beneath the Chittagong hills. Aeromagnetic surveys carried out in Tripura, Mizoram and Cachar (Mehra et al., 1991) have indicated a sedimentary depth of 14km in this trench in Mizoram just west of Tripura. (Figure 6).
The Dauki Fault bound the Shillong plateau on the South. Seismic investigations in Bangladesh have shown that the thickness of sediments in the Sylhet trough south of this fault is over 15 km (Hiller and Elahi, 1988). It is evident that the Sunda Trench connects northwards with the E-W trending Sylhet Trough. The connection is clearly brought out in the Bouguer gravity and residual gravity anomaly map of the region (Figure 8 &9). It will be noticed that in the northern part, the 90 E ridge and Sunda Trench are overlapped by the thrust from the Burmese side as represented by the Chittagong-Tripura hills. The trench reappears from beneath the thrust in the Sylhet trough.
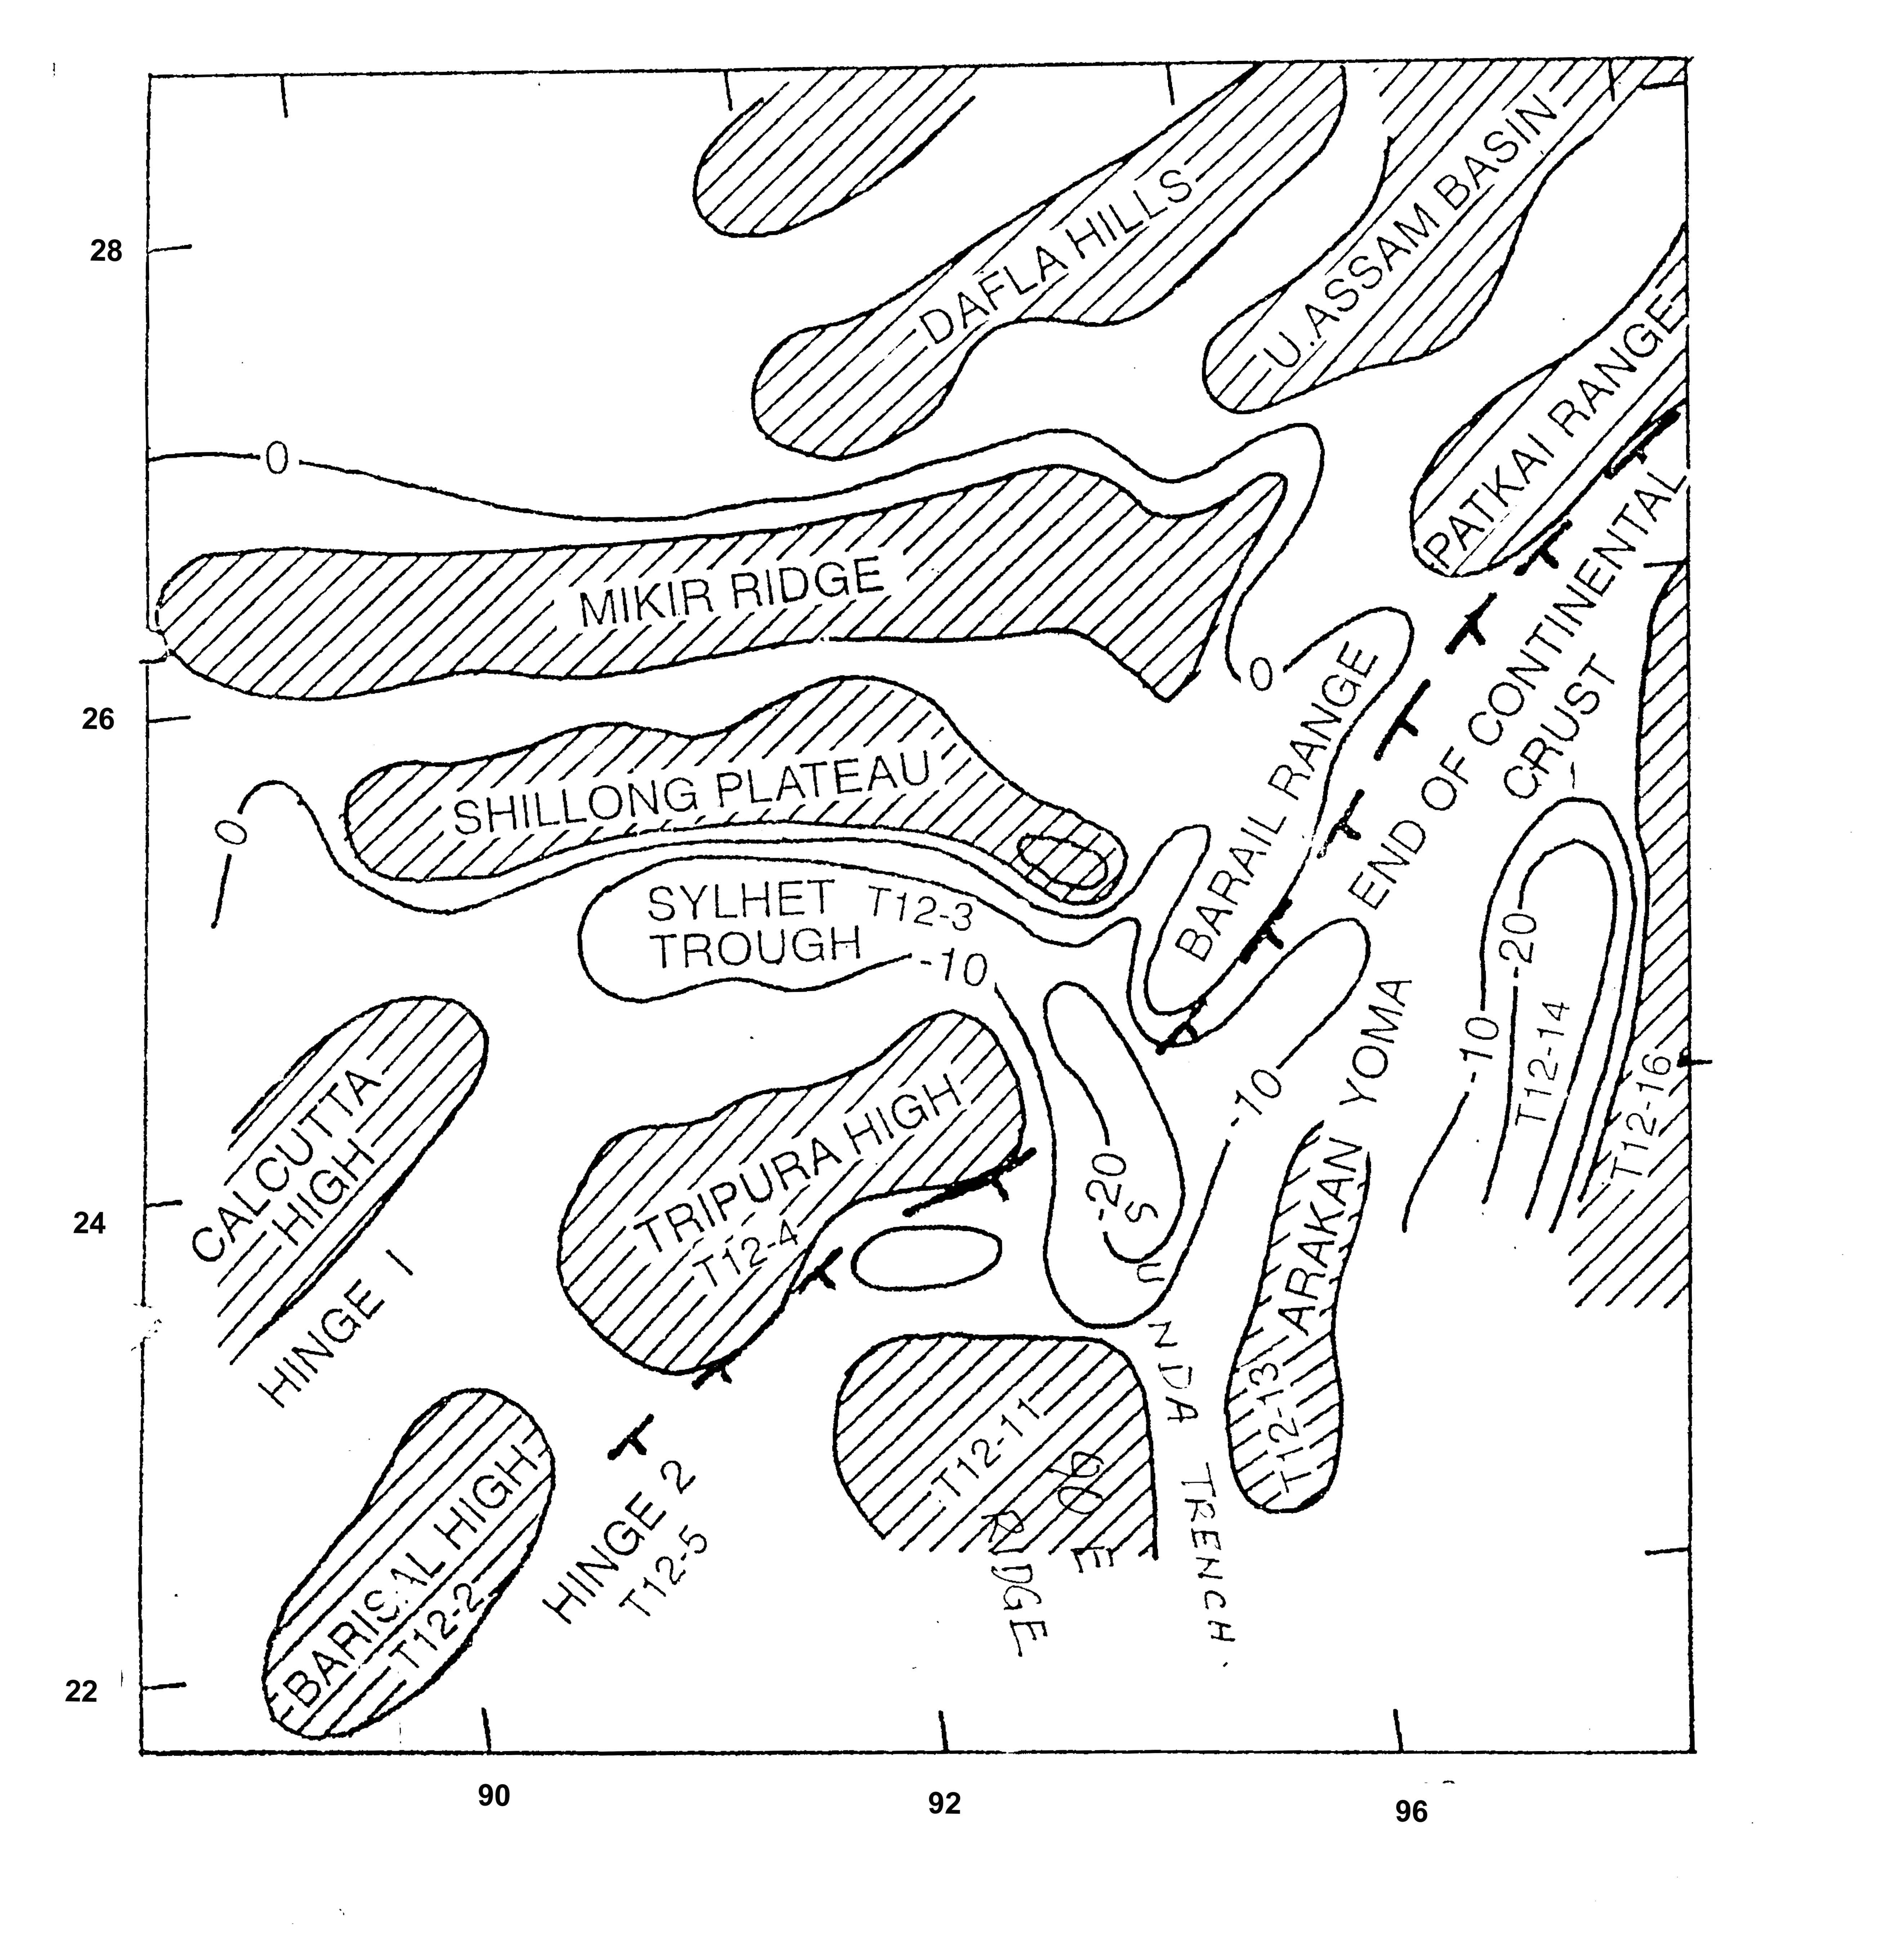
To the east of the Sunda Trench the Shillong massive is overthrust by the Arakan Yoma. Further northwest the Arakan Yoma is thrust against the plains of the Brahmaputra valley forming the Naga Disang Haflong Thrust System (Figure 8). In all these regions there is evidence of a continental collision between the Burmese mass and the Indian Peninsular mass.
Seismic evidence shows the westward extension of the Disang-Haflong Thrust under the alluvial cover and passing through Sylhet in Bangladesh. This represents the northern limit of the Chittagong Tripura hills. The Burmese thrust over the Indian subcontinent is thus clearly defined (Figure 8).
An important structural element in the Bay of Bengal is the 85oE ridge. It runs close to the 85oE longitude from 17o N almost up to 9oN latitude and then turns westwards south of SriLanka and runs almost up to equator (Figure 6). In the north it turns NE and enters the Bengal Basin as the Barisal ridge and the Tripura uplift. The latter is the junction of the 90 E ridge and the 85oE ridge. These two ridges divide the Bengal Fan into 3 lobes, - the western, central and eastern fans. The eastern fan overlies the Sunda trench west of Andamans. The western fan lies in another depression that is a southwest continuation of the Sylhet trough (through Faridpur low). In the south the western and central fans veer round to an E-W direction and there is a deep depression immediately to the south of Sri Lanka. This again veers round to a N-S direction and forms the Chagos trench (to the east of the Chagos ridge).
In the overall picture, the Sunda Trench proceeds all the way from south of Indonesia (7 km of water), through west of Andamans (9 km of sediments), through Mizoram (14 km of sediments) and the Sylhet through (18 km of sediments). It then continues along the Faridpur trough (11 km of sediments), the western lobe of the Ganges fan (11 km of sediments), the Sri Lanka low and the Chagos trench. A marked lack of isostatic balance in the Sri Lanka low suggests an incipient subduction under the island of Sri Lanka.
The northward pressure from the SE Indian ocean ridge led to the Indian continent drifting in that direction and the extinction of the Tethys ocean. It finally resulted in the continental collision between the Indian and Eurasian plates. The pressure has however not ceased and one should expect a new subduction zone to be formed to the south of the Brahmaputra suture. The obvious position is the junction of the southern boundary of the Indian subcontinent and the oceanic crust below the Bay of Bengal and the Bengal Basin (particularly at the Dauki fault south of Shillong plateau). Subduction under the Indonesian arc is well known. Subduction of the Indian plate under Burma has also been illustrated. In the circumstances subduction under the Shillong plateau need hardly be doubted.
In the North Arabian Sea, to the west of the subcontinent, there is a corresponding subduction, namely the Oman subduction zone. This is a response to the creation of new crust at the Carlsberg ridge.
The Northwestern Sector
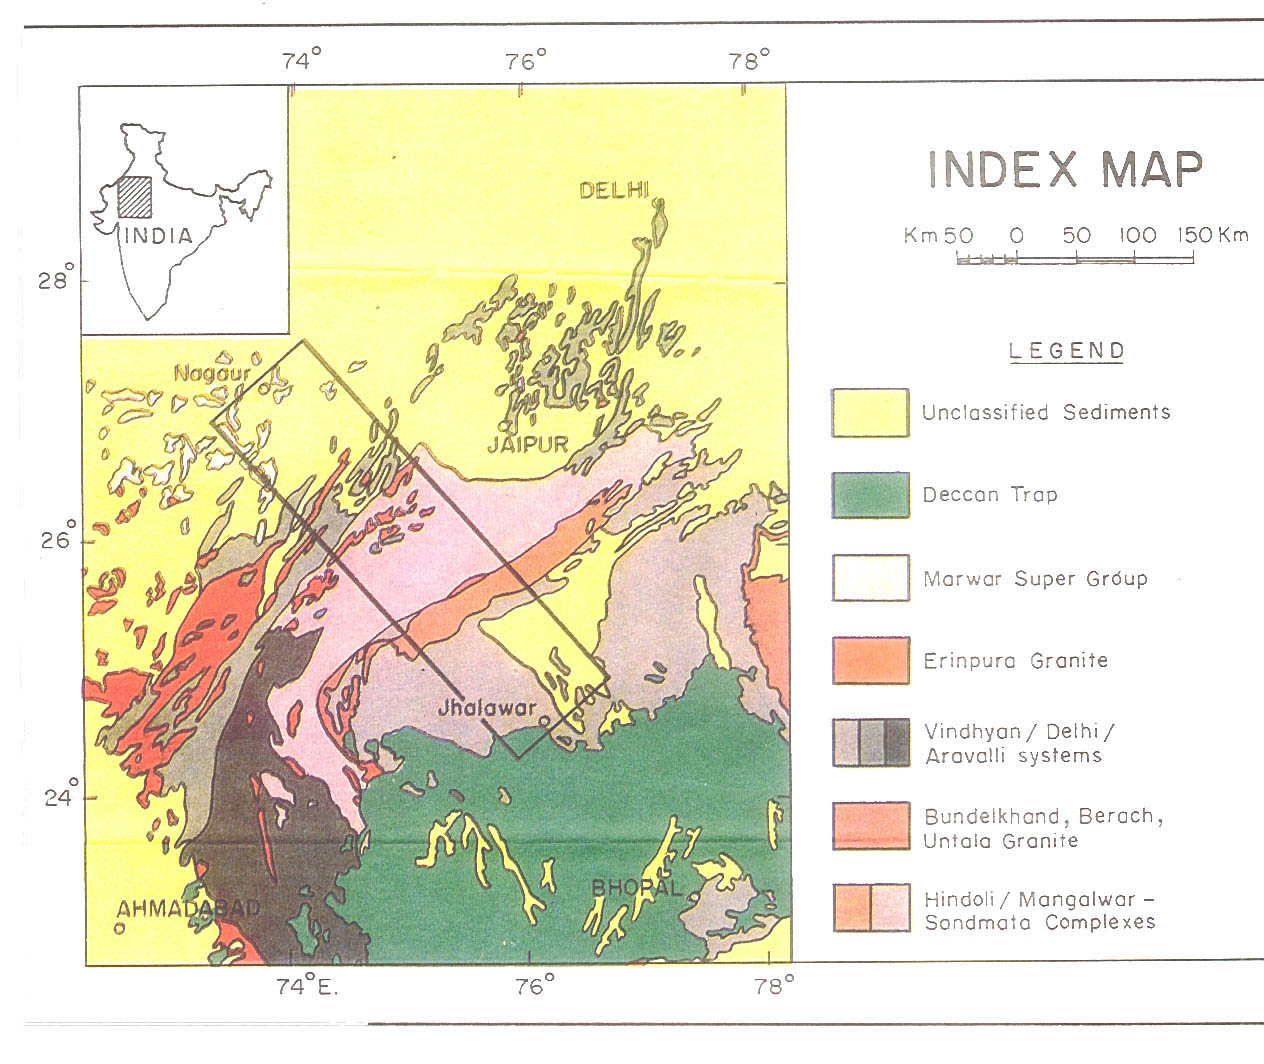
The Aravalli Range dominates this area. It stretches in a NE-SW direction from Delhi in the north upto the Gujarat sedimentary basin in the south. It has long been regarded as the junction of two continental segments namely the Bundelkhand segment to the SE and the Marwar segment to the NW. In the past few years’ geophysical investigations have been carried out in the area and has led to interesting results.
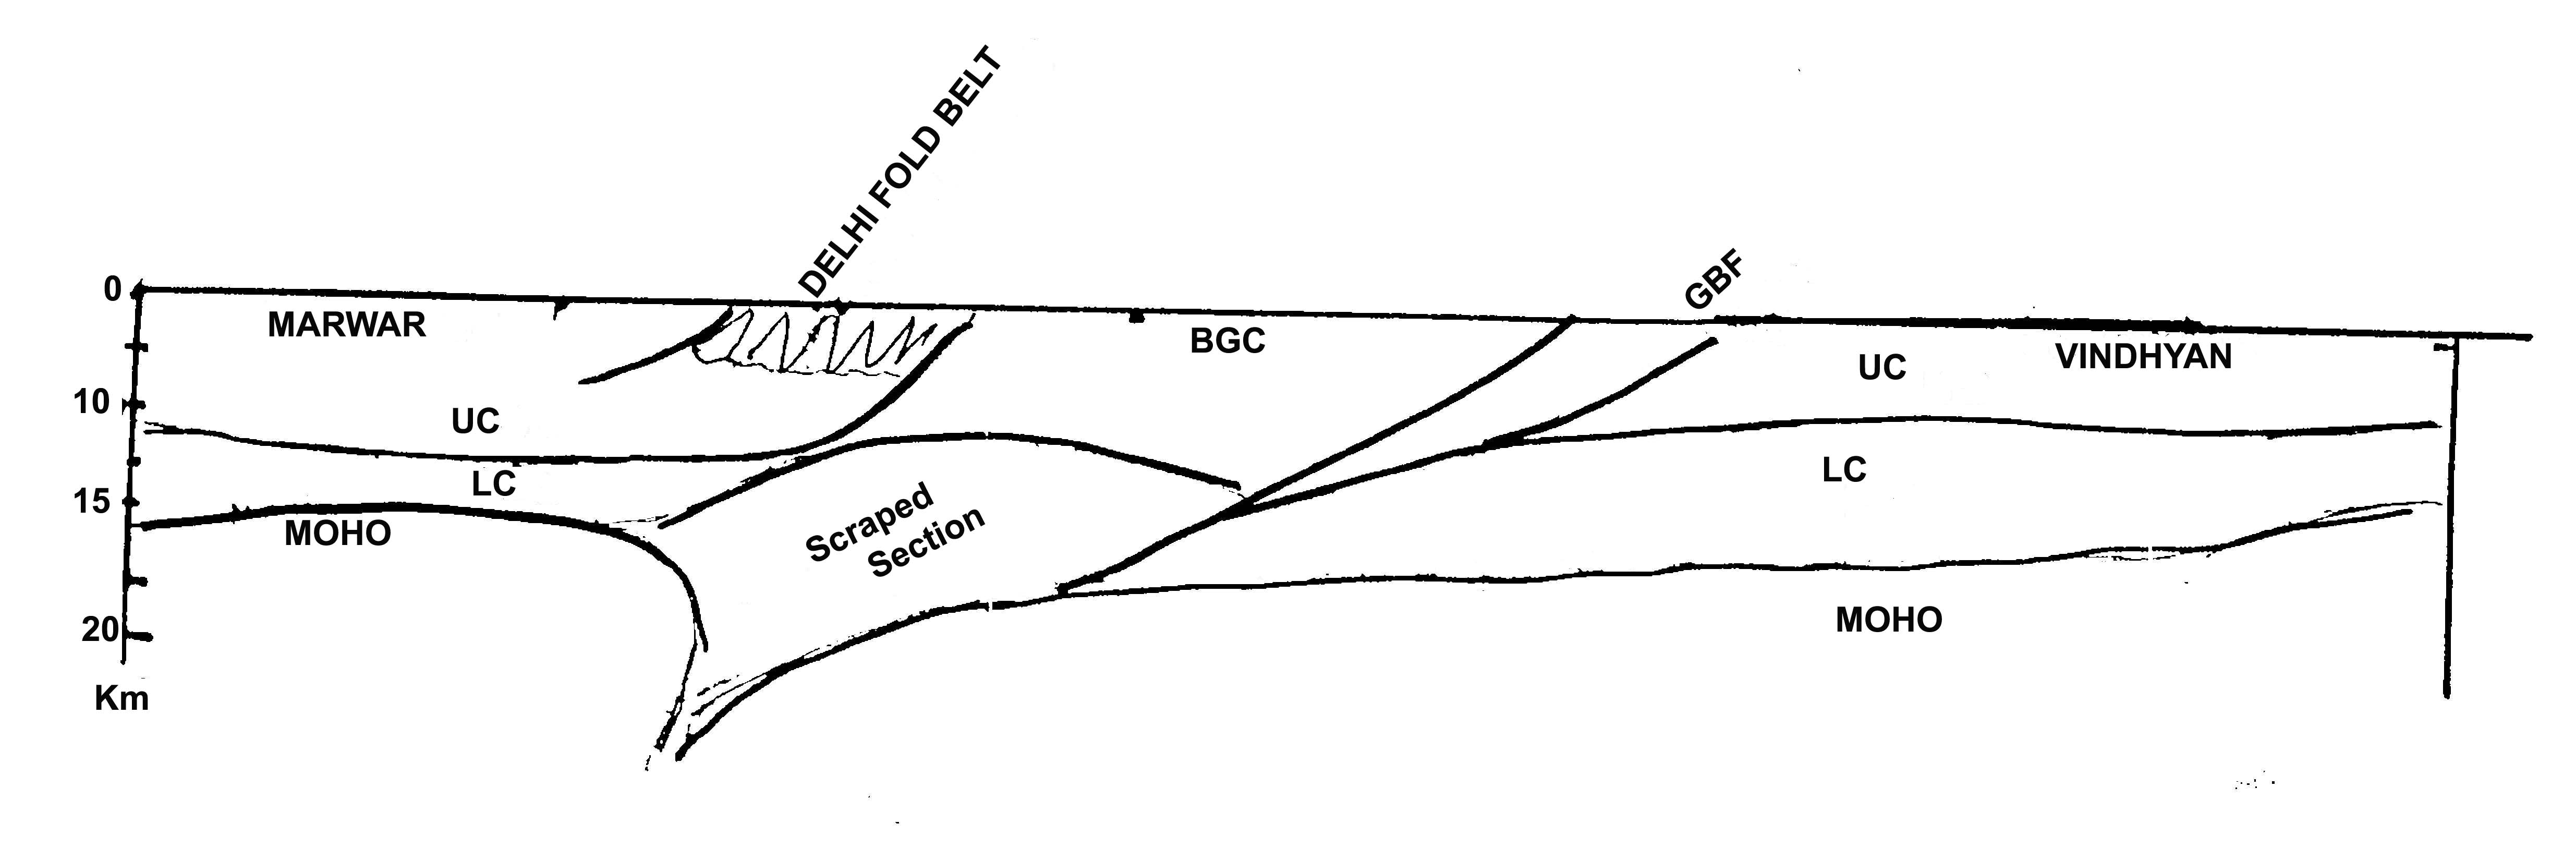
The Aravllai range is characterized by a gravity high with significant lows on both sides. The interpretation of this data has never been satisfactory until a deep seismic sounding across the range was carried out a few years ago. The data obtained from the deep sounding (Tewari et al., 1998) has been interpreted by the NGRI and published. The geology of the region is shown in Figure 10 and the section with a few changes is shown in this paper. (Figure 11). The profile cuts across the Marwar Basin in the NW, the Delhi Fold Belt (with high topography), the Bhilwara Gneissic Complex (BGC) and the Vindhyan Basin to the SE. The Delhi Fold Belt is younger than the Bhilwara Gneissic Complex and has been subject to compression in the course of continental collision.
SE of the range the Moho is seen to dip downwards from the SE to NW. It is not traceable under the range proper. To the NW of the range the Moho is flat and tends to dip downwards from NW to SE. This system is interpreted as the Bundelkhand Moho disappearing under the Marwar Moho. The former ultimately will disappear into the mantle. A case of continental collision can thus be recognized. The presence of ophiolites in the Delhi Fold Belt is well known. Many granitic plutons are known within the Delhi Fold Belt from Ajmer southwards largely situated within the negative anomaly zone. In the southwest Mt. Abu is well known. Further southwest the land is under alluvial cover and plutons have to be recognized from sharp local gravity anomalies. The Ahmedabad pluton is an example. From Ahmedabad the pluton belt swings westwards to cover one pluton within the Gujarat rift (Mehsana, 5) and the 4 plutons represented by the Nagarparkar (1), Patcham (2), Khadir (3) and Bela (4) islands (Figure 12). All these lie within a broad gravity low that appears to be a western extension of the low west of the Aravalli Range. Another branch of the low swings in a southward direction from west of Udaipur upto the Narmada lineament. On the ground this is covered by Aravalli formations. The Gujarat rift occurs to the west of this low. The eastern boundary of the low is marked by the Rakabdeo lineament where ophiolites are again present.
The segmentation of the western sector of the Indian subcontinent can be seen in figure 13. This picture is obtained from a two-stage study of the Bouguer gravity map of India. In the first stage regional anomalies are eliminated giving rise to a residual map. In the second stage the pieces are reassembled on the basis of geological and other evidence to produce the segmentation map. figure 14 is the interpreted tectonic elements of India derived from gravity and residual gravity (highs shown as dark shades) incorporating information from aeromagnetic and other geophysical data.
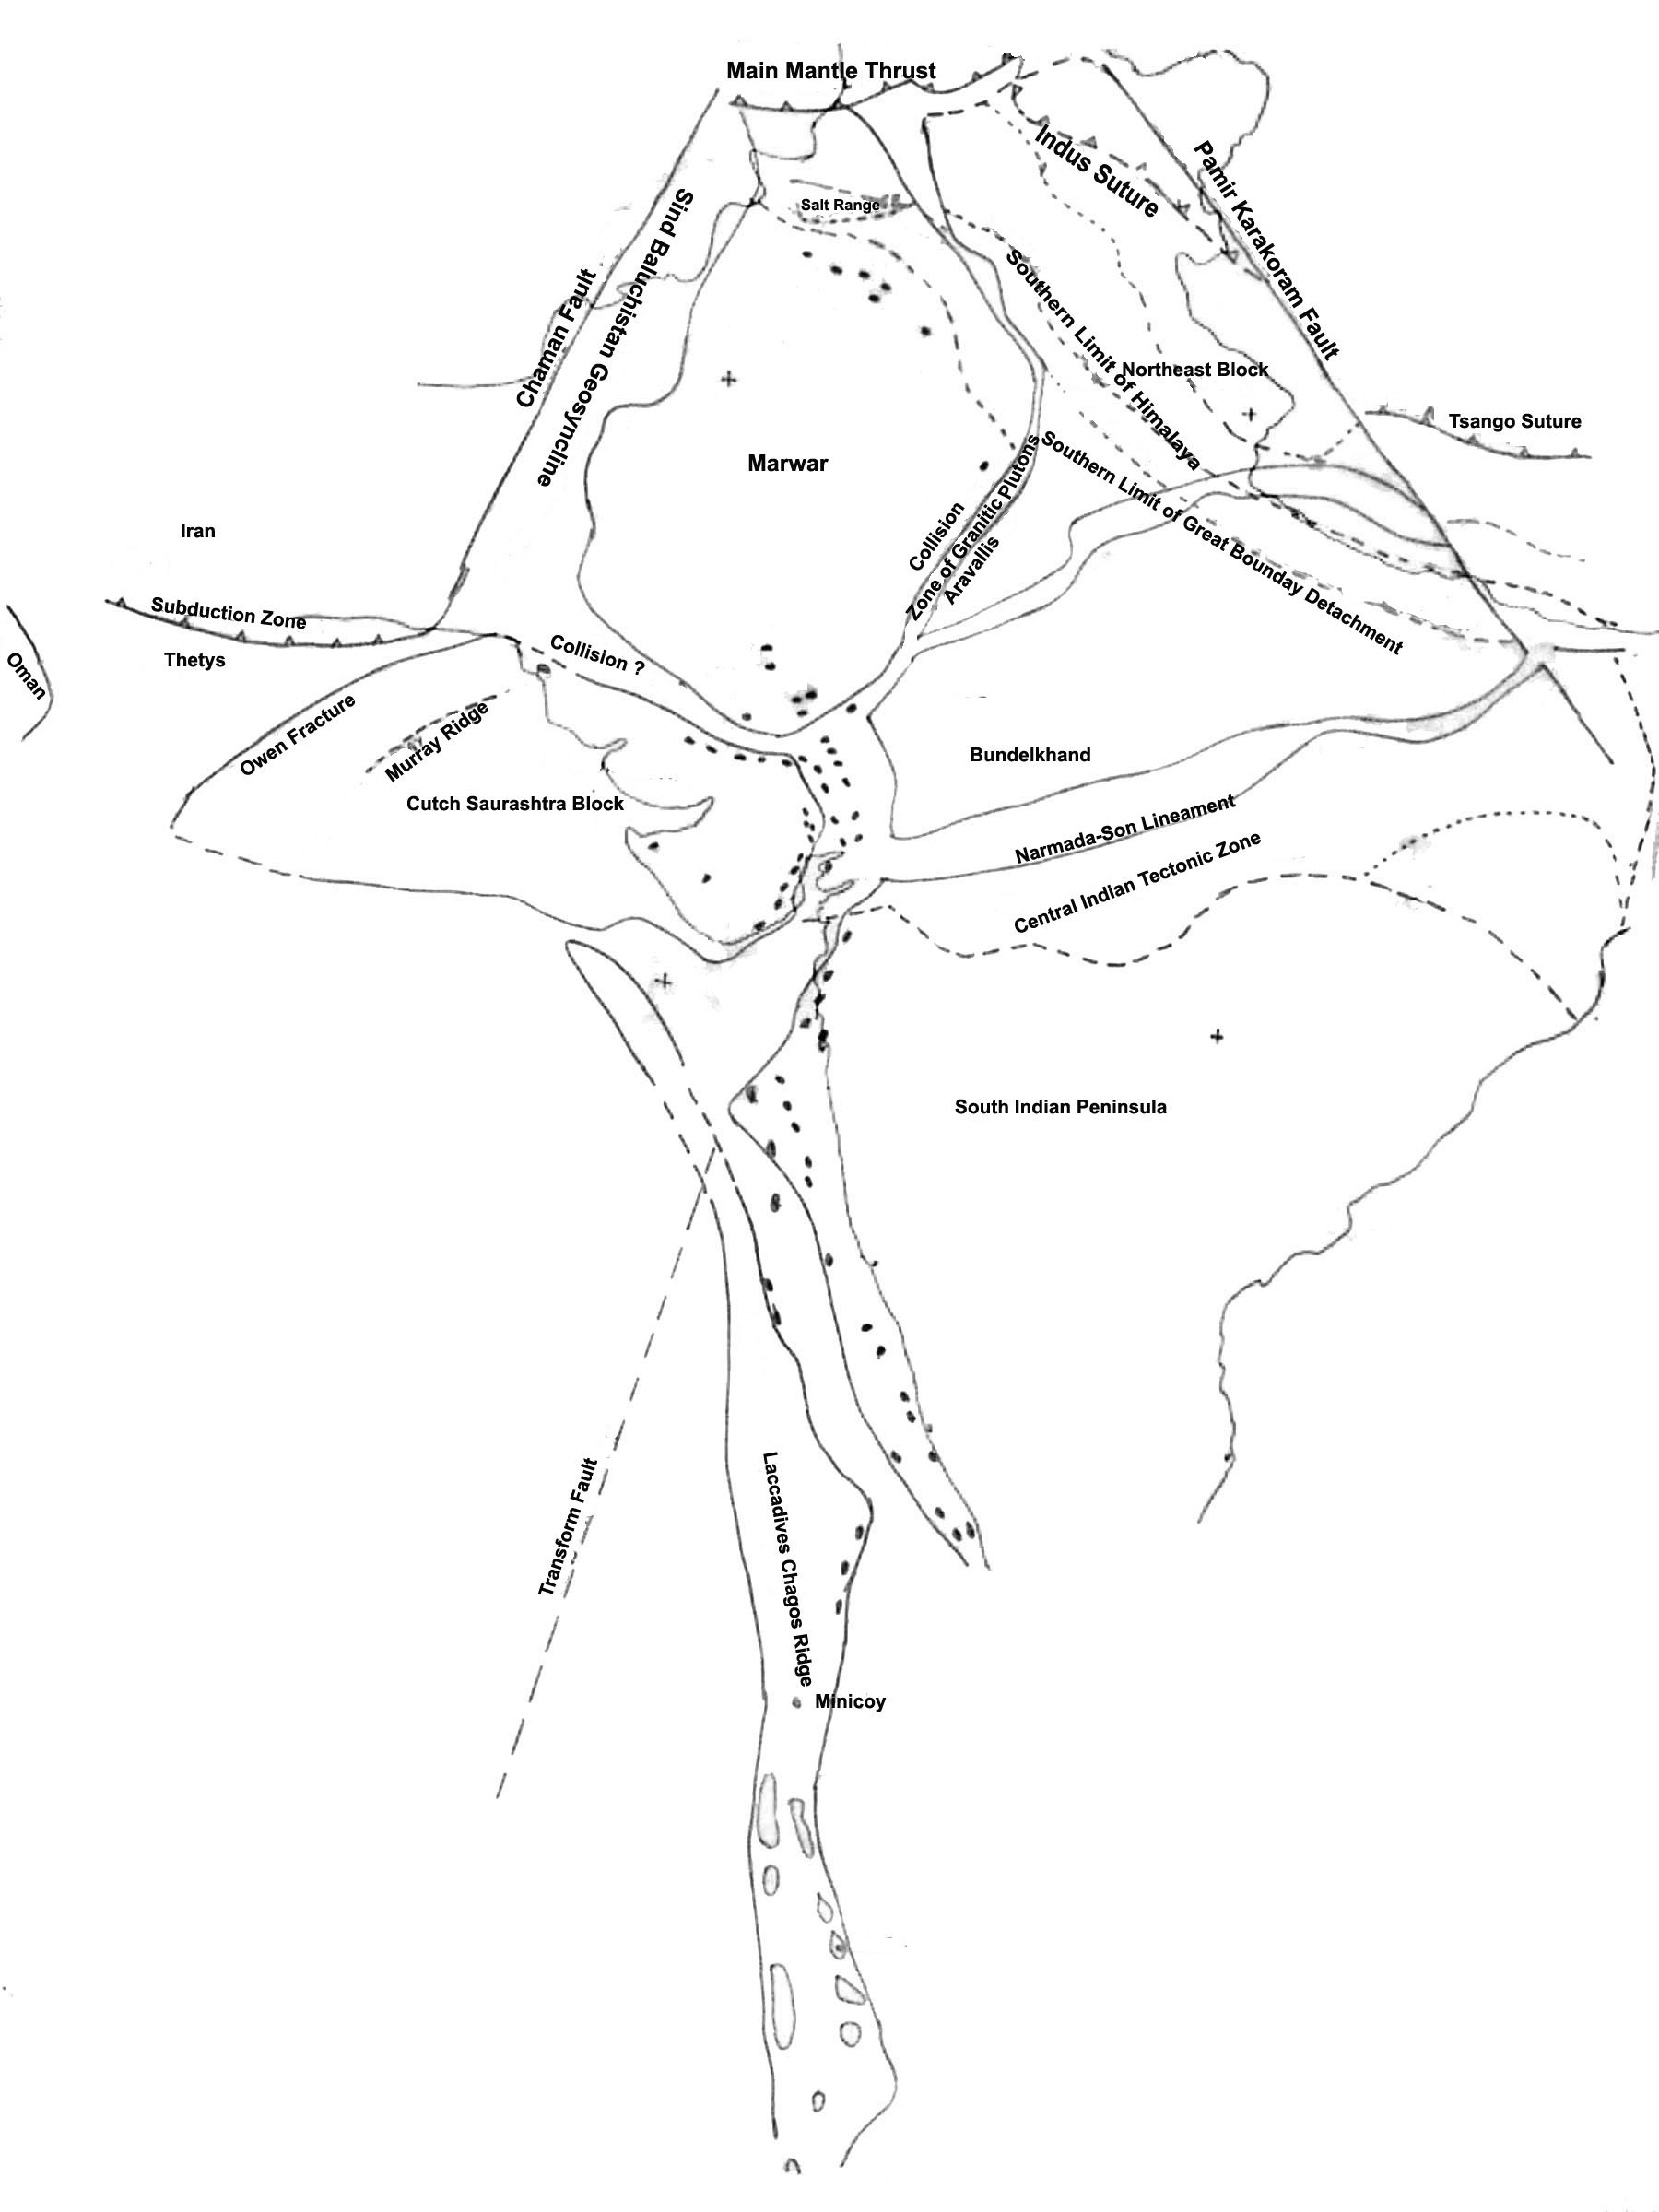
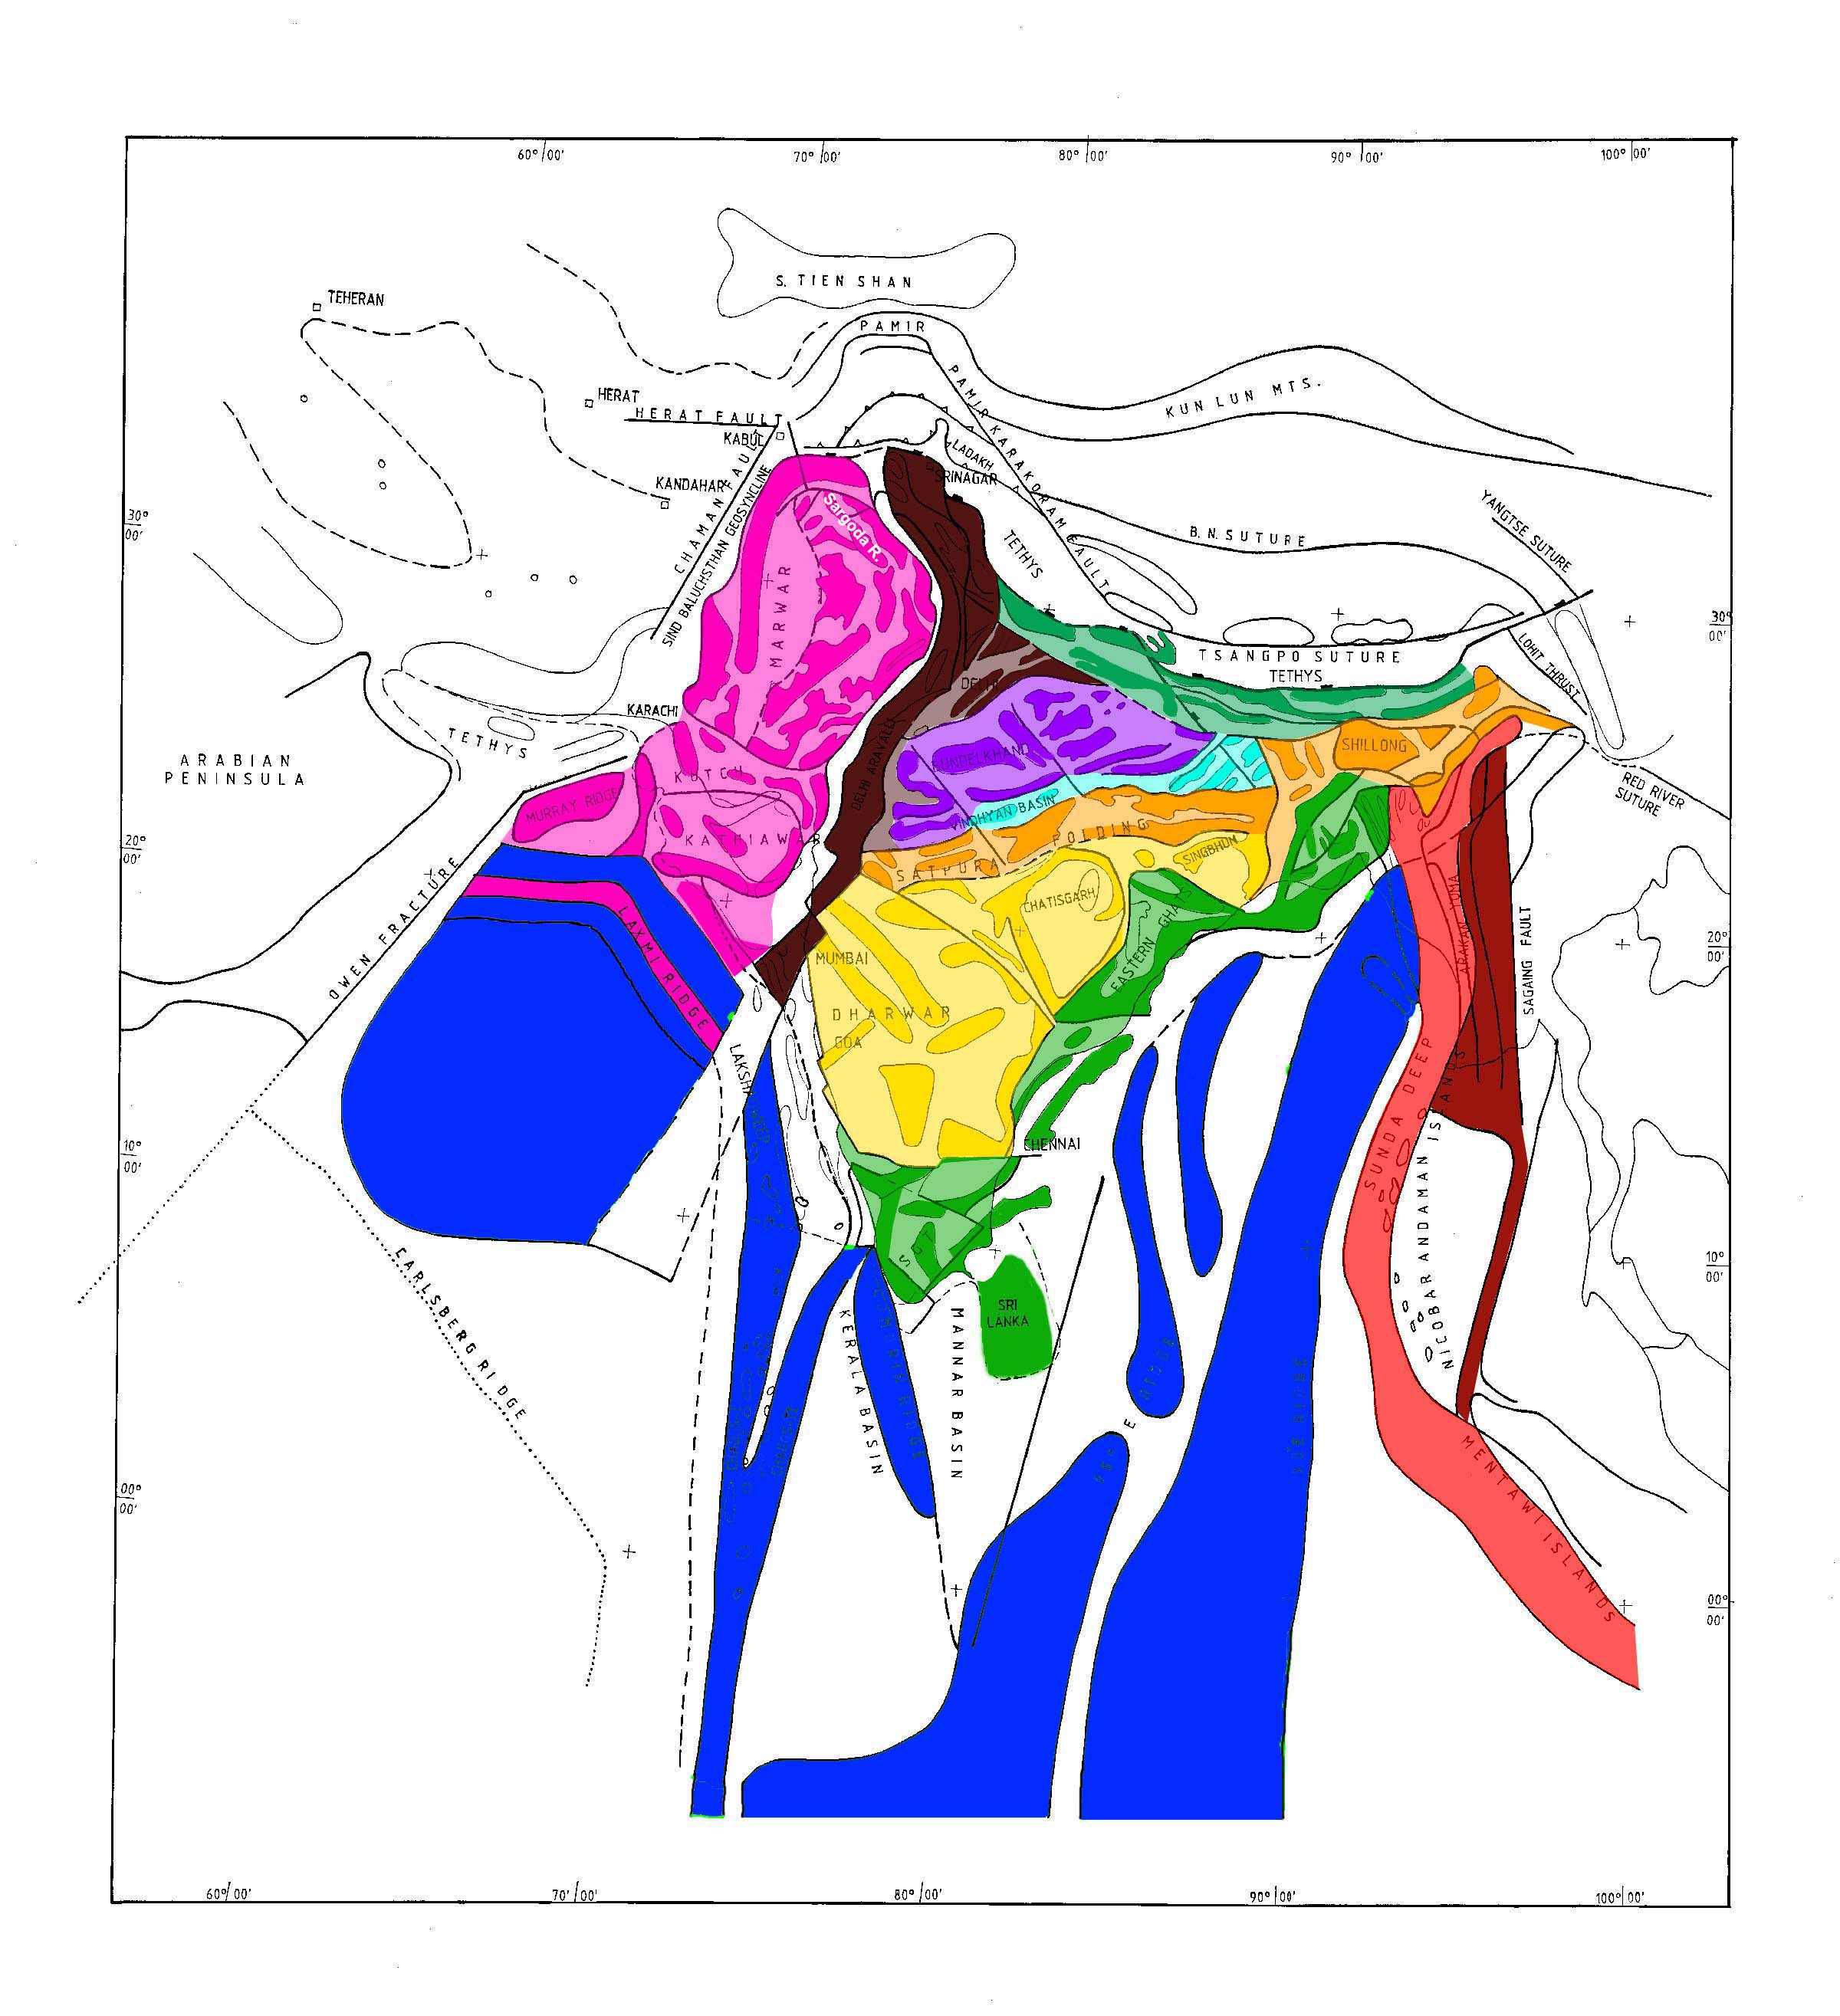
The first segment is the area north of the southern edge of the Great Indian Detachment. It is followed southwestwards by the Marwar, Cutch Saurashtra and Arabian sea segments. Southwards lie the Aravalli Bundelkhand and the South Indian Peninsular segments. All the segments are separated by mobile belts.
For the Marwar block using the low axis as an indicator one can extend the collision zone northwards. It can be easily traced upto the Sutlej river in Punjab. The Marwar segment includes the NW-SE Sarghoda Ridge and dips northwards under the Salt Range and the Great Indian Detachment. Both segments can be traced under the Detachment upto the E-W running Main Mantle Thrust, which is the northern suture zone of the Indian plate. Between Srinagar Valley and the Main Mantle Thrust an E-W gravity low exists (containing the peak of Nanga Parbat), in which the Moho plunges from 45 km depth in Srinagar Valley to about 80 km under Nanga Parbat. It is interesting to note the peak is composed of rocks of Aravalli age.
The eastern and western shoulders of the Gujarat rift contain a number of local gravity culmination that we identify as plutons. Even within the rift there are a number of such plutons further south covering the western offshore area and the Laccadives-Chagos ridge. Adding to this the string of plutons along the Delhi Fold Belt, a great line up to these plutons all the way from the Sutlej river upto the southern limit of the Chagos islands can be traced.
There is evidence that the Aravalli Range has been influenced by Deccan Trap activity (Cretaceous-Paleocene). It is therefore possible that the line up of plutons mentioned above may be the trace on the continental block of the Reunion plume.
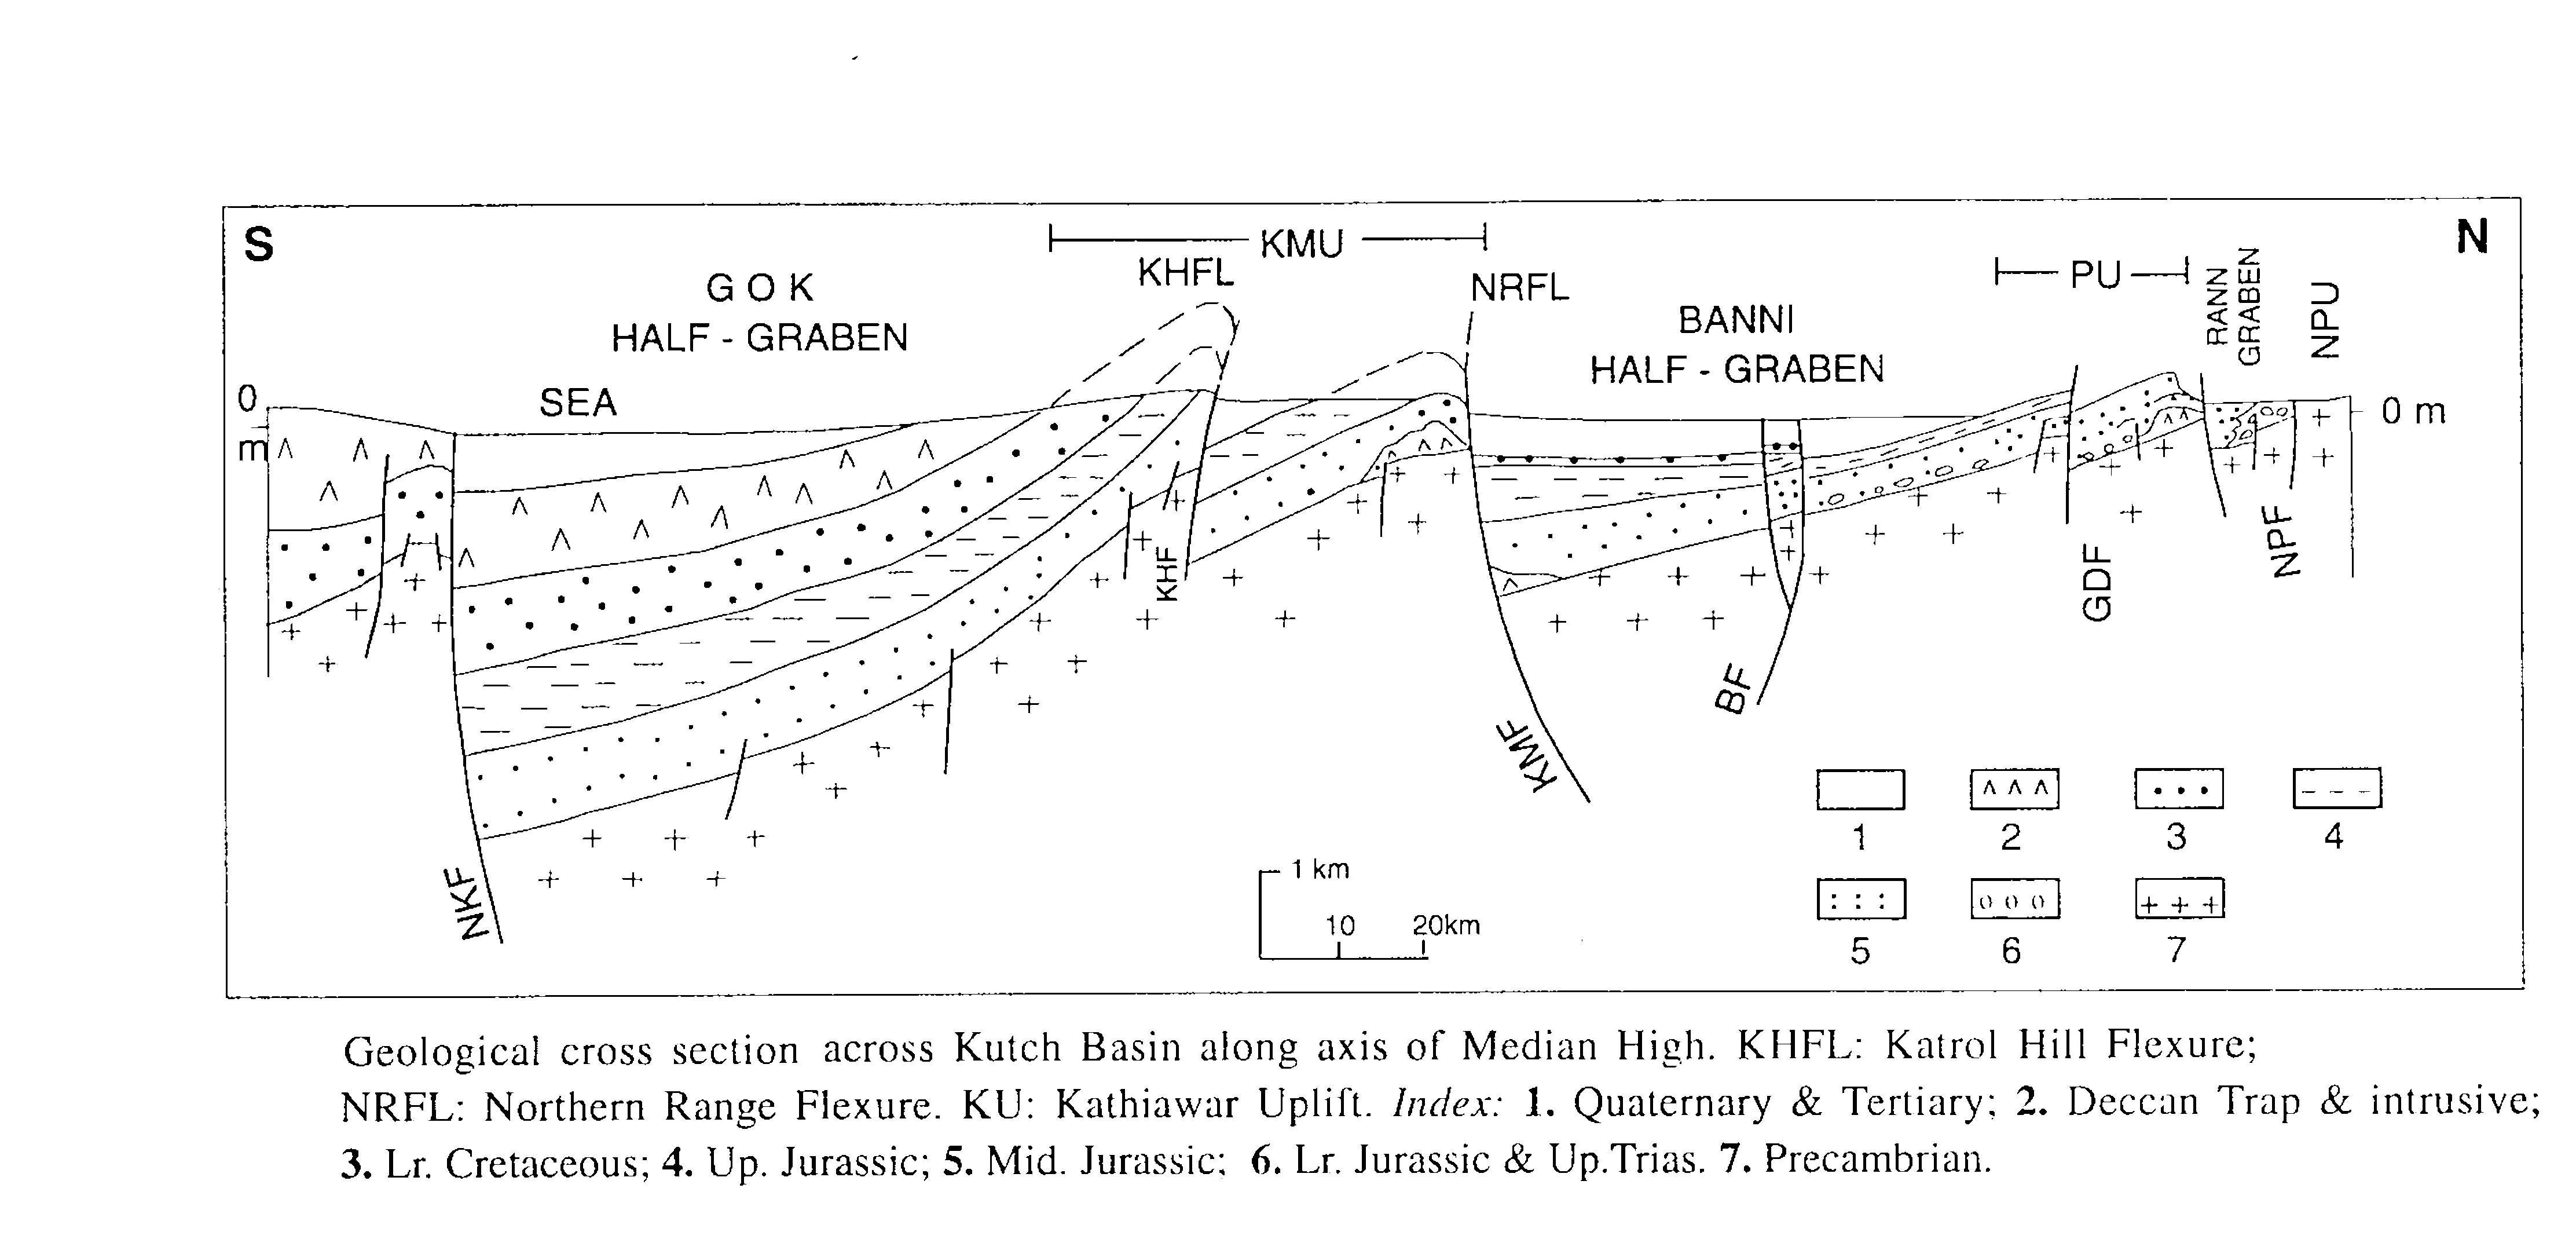
The western extension of the Delhi Fold Belt (largely submerged) consists of the Nagarparkar Ridge, the Great Rann of Kutch, the Patcham-Khadir-Bela Island belt, the Great Rann, the Mainland of Kutch and the Gulf of Cutch. The Nagarparker Ridge lies directly to the east of the Oman subduction zone and would appear to be an extension of the same. The only difference is that while subduction is active in the latter, the former is a zone of continental collision. Geological sections across the Mainland and Rann of Kutch clearly indicate a series of E-W trending thrust lines that suggest compression and continental collision. (Figure 15).
In a similar manner the owen fracture zone in the N. Arabian sea could be an extension of the Kutch Mainland Fault and could be further extended westwards upto the Oman coast and the southern shore of the Persian Gulf.
Conclusion
The above description gives a broad outline of the information that can be obtained from an analysis of geophysical data. Needless to say the information is a little sketchy due to the vast area covered and the limitations of space.
References
- Abdullah S.K.M. (1990) Bouguer anomaly map of Bangladesh (1:1,000,000), Geological Survey of Bangladesh.
- Agarwal R.K. (1977) Structure and tectonics of Indo Gangetic plains: Geophysical case histories of India, M.B.Ramachandra Rao Volume Assoc. of Exploration Geophysicists, India p.27-46.
- Balakrishnan T.S. (1997) Major Tectonic Elements of the Indian Subcontinent and contiguous areas: A Geophysicsl View. Geological Society of India, Memoir: 38, p.18.
- Biswas S.K. (1987) Regional tectonic framework, structure and evolution of the western marginal basins of India. Tectonophysics. V.135, pp:307-327.
- Curray J.R., Emmel F.J., Moore D.G and Wait R.W. (1975) Structure, Tectonics and Geological history of the Northeastern Indian ocean. In: The ocean basins and margins A.E.M.Narin and F.G.Stehli (Eds.), p.399-450.
- Evans, P. and Crompton, W. (1946) Geological factors in gravity interpretation illustrated by evidence from India and Burma. Quart. J. Geol. Soc. London, 102, pp 211-249.
- Geological Survey of India (2000). Geological Map of India scale 1:2,000,000. India.
- Hiller K. and Ellahi, K. (1988) Structural growth and hydrocarbon entrapment in the Surma basin, Bangladesh. In: Wagner H.C., Wagner L.C. and Wong F.L. (Eds) Petroleum resources of China and related subjects: Houston, Texas, Circum-Pacific Council for energy and mineral resources, Earth Science series, No. 10, pp. 657 – 699.
- Mehra G., Singh T.P. and Laskar S.K. (1991) Aeromagnetic survey in Tripura – Mizoram – Manipur – Cachar area. Pp. 63 – 97.
- NGRI. (1975) Gravity map series of India (1:5,000,000), published by national Geophysical Research Institute, Hyderabad, India,
- Roy B.C. (Ed.) (1963) Geological map of India (1:2,000,000), Geol. Survey India.
- Tewari H.C., Divakarrao V., Narayana B.L., Dixit M.M., Madhavarao N., Murthy A.S.N., Rajendraprasad B., Reddy P.R., Vankateswarulu N., Vijaya Rao V., Mishra D.C and Gupta S.B. (1998) Nagaur-Jhalwar geotranscet across the Delhi/Aravalli Fold Belt in Northwestern India. Jour. Geological Society of India V.52, pp 153-159.
- Udintsev G.B. (1975) The International Indian Ocean Expedition, Moscow, Geological and Geophysical atlas of the Indian ocean, Academy of Sciences, p. 151.
Figures
- Figure 1
- Bouguer Anomaly map of Indian subcontinent and contiguous areas. (Balakrishnan, 1997)
- Figure 2
- Section from S. Tibet to Nepal ( Balakrishnan, 1997)
- Figure 3
- Section from Muzaffarnagar to Raxaul, Bihar ( from Agarwal, 1977)
- Figure 4
- Gravity anomaly map of Ganga Valley, Himalaya & S. Tibet ( Balakrishnan, 1997)
- Figure 5
- Residual gravity map of Tibet and Himalaya ( Balakrishnan, 1997). MCT is close to the dashed line1.
- Figure 6
- Map of Eastern sector showing the tectonic elements and basement depth (Balakrishnan, 1997)
- Figure 7
- Section across Bay of Bengal and Andaman Islands (Balakrishnan, 1997, Curray et al., 1975)
- Figure 8
- Gravity map of Chittagong Tripura hills (Abdullah, 1990)
- Figure 9
- Figure 9. Tectonics elements of Bengal Basin and subducted zone beneath Burmese Thrust. From residual gravity ( Balakrishnan, 1997).
- Figure 10
- Geological map of Aravalli (from Tewrai et al., 1998)
- Figure 11
- Reinterpreted Deep Seismic Sounding section across Aravalli Range (Tewari et al., 1998). BGC - Bhilwara Gneissic Complex, LC- Lower Crust, UC- Upper Crust, GBF- Great Boundary Fault.
- Figure 12
- Map of offshore pluton ( Balakrishnan, 1997). 1- Nagarparkar, 2- Patcham, 3-Kadir, 4- Bela, 5-Mehsana, 6-Ahmedabad.
- Figure 13
- Segments of the Western and Northern sector.
- Figure 14
- Tectonic elements.
- Figure 15
- Geological section across Kutch (Biswas, 1987)