The crustal structure across and along the strike of the Pyrenean mountains show well preserved crustal thicknesses derived from its thickening during the Tertiary continental collision and only modified in the eastern Pyrenees by late Neogene and Quaternary extension.
The Iberian crust shows thickening towards the N reaching maximum values of about 50 km below the northern Pyrenees (Gallart et al., 1981). The European crust also thickens towards the south reaching maximum values of about 40 km in the central Pyrenees. The geometry of the Iberian and European crusts beneath the Pyrenees was determined from the ECORS deep seismic reflection survey across the centre of the mountain chain (Choukroune and team, 1989; ECORS Pyrenees Team, 1988)]. This profile shows a highly reflective lower crust gently dipping towards the north in the Iberian side and towards the south in the French side. North-dipping Iberian reflectors however reach the northern part of the Pyrenees and are located underneath the European crust, indicating subduction to the north. The base of this reflective unit was identified as the Moho at 32 km beneath the stable Iberian plate and at 30 km beneath the external part of the Aquitaine basin. Gravity modelling based on gravity data collected along the ECORS profile reproduces the basic crustal geometry below the Pyrenean orogen (e.g., Torné et al., 1989).
Variations of the crustal structure along the strike of the Pyrenean chain are determined from the completion of the gravity anomaly map of the Pyrenees (Casas et al., 1997) as well as using a combination of Bouguer and geoid anomalies (Vacher and Souriau, 2001). Maximum crustal thickness corresponds to the central Pyrenees where topography is higher and decreases towards both the Mediterranean Sea and the Atlantic Ocean in accordance to topography. The reduction in crustal thickness to the west of the chain agrees with the corresponding decrease of the amount of calculated shortening (about 80 km according to Teixell, 1998). The more dramatic reduction in crustal thickness in the easternmost Pyrenees is due to the late overprint of Neogene extension related to the opening of the Valencia Trough in the Western Mediterranean (Vidal et al., 1998; Gallart et al., 2001).
The Pyrenean structure to the W of the Pamplona Fault has been determined by using deep seismic profiling (Fernández-Viejo et al., 2000; Fernández-Viejo et al., 1998). The crustal structure is similar to the Central Pyrenees one with thicknesses increasing towards the N reaching its maximum of 50 km underneath the Mármoles Fault, interpreted as the western continuation of the North Pyrenean Fault (Martínez-Torres et al., 1994). The resultant crustal geometry is interpreted as the product of the moderate subduction of the Iberian Plate to the N.
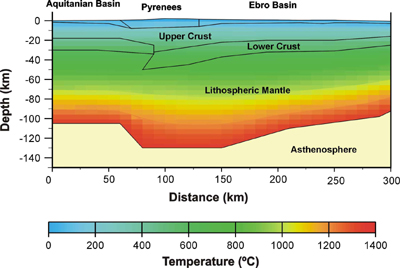
The lithospheric structure under the Pyrenees is determined by integrating the Bouguer anomaly, the topography and the heat flow in a single model (Zeyen and Fernàndez, 1994), (Fig. 16). The geometry of the lithosphere shows thickening beneath the Pyrenean orogen. The lithosphere thickness roughly mimics the crustal geometry being thicker below the inner part of the mountain. The geometry of this lithospheric root is progressive in the Iberian side with increasing thicknesses from about 105 km in the undeformed part of the Ebro Basin to 130 km below the range. The passage from the undeformed Aquitaine Basin to the French part of the chain is more abrupt.
Figure 16. N-S lithospheric transect
N-S lithospheric transect along the ECORS profile showing a lithospheric root underneath the Pyrenees. The transect is based on integrating Bouguer anomalies, topography and heat flow data (from Zeyen and Fernàndez, 1994). Location in Fig. 15.
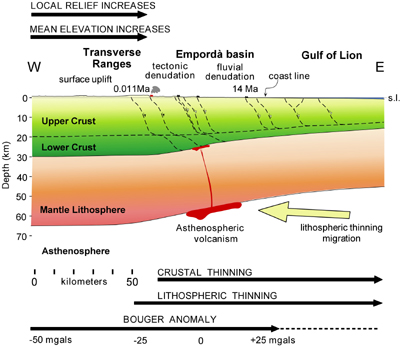
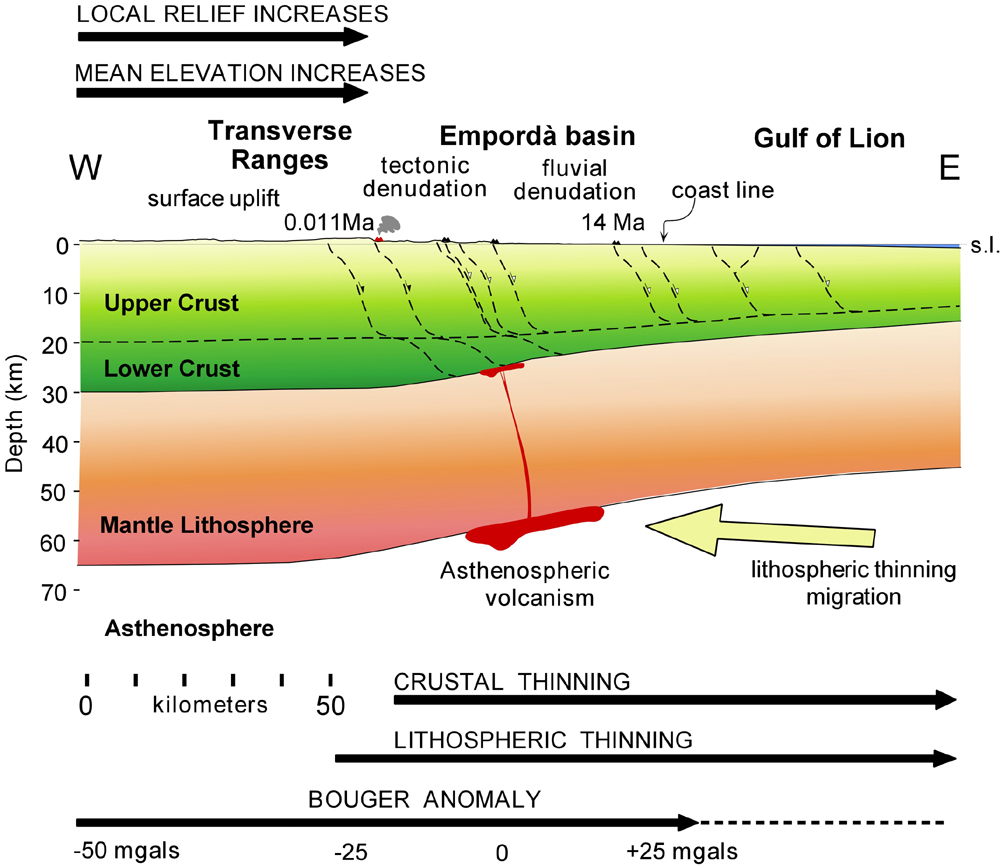
The lithospheric geometry of the Eastern Pyrenees is imaged along the strike of the eastern Ebro Basin (Ayala et al., 1996; Lewis et al., 2000), showing crustal and lithospheric thinning towards the Mediterranean Sea (Fig. 17).
Figure 17. E-W lithospheric transect
E-W lithospheric transect to show the present-day geometry of the eastern termination of the Pyrenean Range (location in Fig. 15). The profile integrates surface and subsurface data (modified from Lewis et al., 2000). The colors of the section are not directly related to temperatures as in Fig. 16.