Introduction
Three-dimensional structural changes along strike are commonly observed in fold and thrust belts. Examples have been documented e.g., in the western Salt Range of Pakistan (McDougall and Khan, 1990), in the Jura Mountains in France and Switzerland (Philippe, 1994, 1995; Philippe et al., 1998), and in the Alberta Foothills and Front Ranges of the Canadian Rocky Mountains (Fermor and Moffat, 1992; Fermor, 1999). Faults in such belts form part of a complex system of subhorizontal detachment faults, frontal ramps and transfer zones. The latter transfer displacement from one frontal ramp to the next. Transfer zones may be lateral ramps, oblique ramps or subvertical tear faults (McClay, 1992). The origins of transfer zones are diverse and can be related to, e.g., pre-existing basement faults, basal rheological changes, and variations in lithological thicknesses.
Analogue
modelling experiments were performed to investigate the development
and evolution of transfer zones. Transfer zones were induced by deforming
a basal viscous layer that was placed adjacent to the mobile backstop
and was overlain by brittle analogue materials. The shape of the basal
viscous layer was varied in order to test its influence on the geometric
and kinematic evolution of transfer zones. Experiments were analysed
using helical (spiral) X-ray computerized tomography (CT; Hounsfield,
1973). This technique allows visualisation of the interior of an analogue
model without destroying it. Periodic acquisition of volumetric data
sets makes it possible to follow the three-dimensional evolution of
the model structures at successive stage of deformation (Schreurs et
al., in press). Results of experiments simulating transfer zones have
been previously published by Schreurs et al. (2001). In this paper we
focus on computer animations of these experiments that show in more
detail the geometric and kinematic evolution of transfer zones.
Experimental procedure
The experimental apparatus consisted of a rectangular wooden box with a length of 80 cm, width of 43 cm and height of 17 cm. A vertical mobile backstop driven by a motor produced shortening at a constant velocity of 4.8 cm/h. A 5 mm thick layer of linear viscous polydimethyl-siloxane (PDMS; density of 0.965 g/cm3 and viscosity of 5x 10⁴ Pa s, Weijermars, 1986) was placed over part of the wooden base (Fig. 1). Granular, brittle analogue materials (dry quartz sand and corundum powder with an average grain size of 100 µm and a density of 1.56 and 1.89 g/cm3, respectively) were sprinkled in alternate layers on top of the PDMS and the adjacent uncovered wooden base. The initial model was 80 cm long, 27 cm wide, and its thickness was 3 cm. A 3 mm high slot at the base of the mobile wall ensured that the initial detachment horizon was located within either granular material or viscous PDMS. Total shortening amounted to 9 cm, reducing the final model width to 18 cm. Three-dimensional CT data sets were obtained from part of the initial, undeformed model (Fig. 1) and subsequently after every full centimetre of progressive shortening, giving a total of ten three-dimensional data sets. From the three-dimensional volume raw data, 88 (experiment 73) and 74 (experiment 75) cross-sectional slices with 2 mm spacing were computed retrospectively. Thus, the field of investigation width covered 17.6 and 14.8 cm, respectively. The computed attenuation values of each cross-sectional slice resulted in a grey scale image. Attenuation is mainly a function of material density, atomic number and thickness. The distinct densities of the analogue materials allowed visualisation of boundaries between different materials. Faults in granular materials corresponded to dilatant zones, where the attenuation was reduced compared to the adjacent unfaulted material. This contrast in attenuation made faults clearly visible in X-ray CT images. Digital data were stored on CD-Rom in Dicom 3.0 standard format ensuring interoperability with visualisation software. NIH image software was used to enhance images and to produce movies of serial cross-sections through one particular deformation stage or the time evolution of model deformation in two dimensions. Noesys T3D visualisation software was used to generate 3-D perspective views from serial cross-sections. This software also provides the possibility to compute sections in any direction through a three-dimensional data set, i.e., cross, longitudinal, oblique, or horizontal sections. Three-dimensional views at successive deformation stages were used to make short movies.
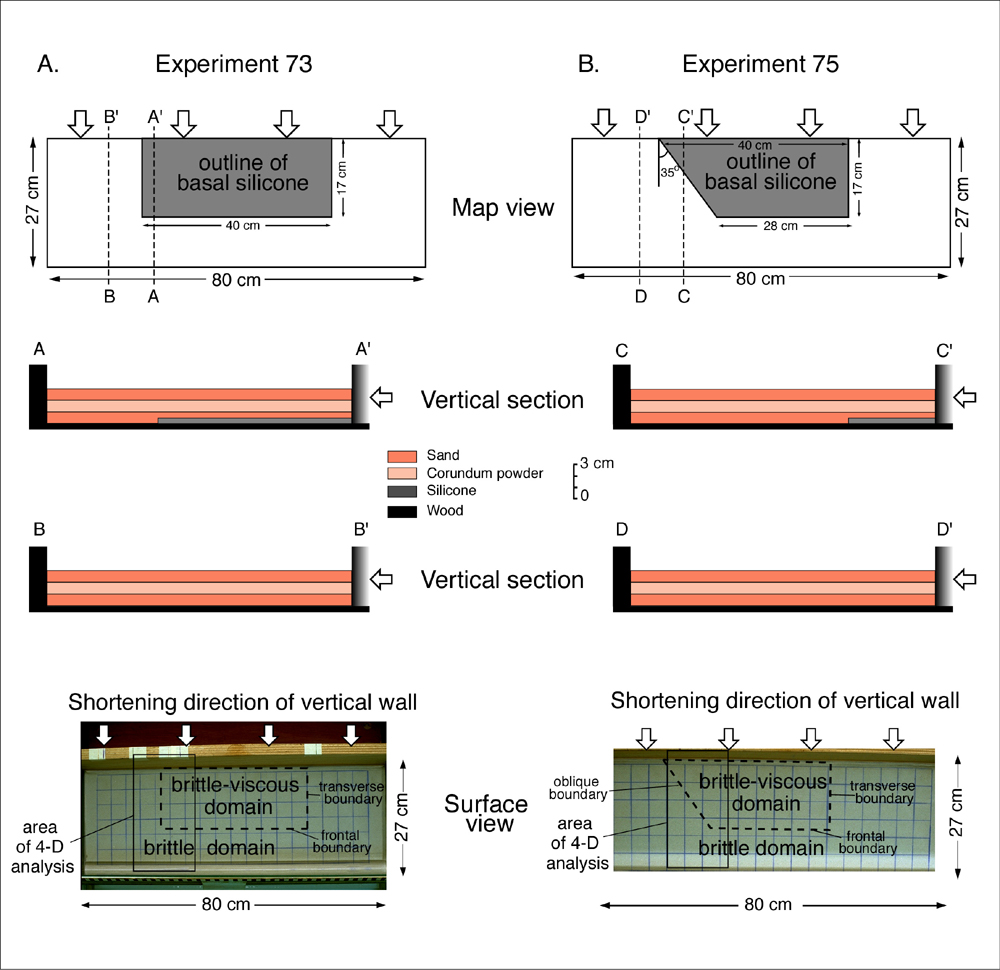 |
| Figure 1. Initial experimental setup illustrated by map view, vertical sections and surface photographs. (a) Experiment 73. (b) Experiment 75. Boundary conditions were identical except for the shape of the basal layer of viscous polydimethylsiloxane (PDMS), whose initial outline is indicated by a dashed line. Area analysed by X-ray computerized tomography (CT) is shown on plan view photographs. Initial grid spacing of model is 4 cm. (Click for enlargement) |