Introduction
Previously performed physical modelling of continental subduction suggested existence of two principal regimes of this process characterised by different mechanisms for exhumation of high-pressure rocks (Chemenda et al, 1996). The regime is defined by the interplate pressure which is inversely proportional to the pull-force. The latter depends on the difference between the average density of the subducting lithosphere and the surrounding mantle. In both regimes the continental crust reaches a critical depth proportional to its strength (~200 km) and fails, forming a major crustal thrust. In the case of high interplate pressure (highly compressional regime), the failure occurs in front of the subduction zone and the uplift (exhumation) of the subducted crust is only possible with erosion of the forming relief. If the interplate pressure is low (low compressional regime), the failure of the crust occurs under the base of the overriding plate and is followed by the buoyancy driven uplift of the subducted crust between the subducting and overriding plates. Although the results of this modelling seem to correspond quite well to the available geological data, it was purely mechanical (isothermal) and did not consider any change in the mechanical properties of the subducting material. In the real conditions, however, both pressure and temperature increase during subduction, causing the rheology of the subducting crust and the mantle to change. Experimental studies of the coesite aggregates show in particular, that the strength of the crustal rocks reduces from ca. 100 MPa at the mid-crustal level (Ranalli and Murphy, 1987) to about 10 MPa (Stockert and Renner, 1998; Renner et al, 2001) at 750± 150°C and P= 3 GPa (corresponding to ca. 100 km-depth). Such strong change in the mechanical properties should certainly affect the subduction and exhumation processes, which therefore must be addressed by thermo-mechanical modelling. In this paper we describe the set-up of such modelling and report the first results. They confirm that in a low compressional regime of continental subduction, a coherent slice of the subducted continental crust rises between the plates, althought both its volume and exhumation-depth are smaller than in the isothermal experiments. The crust subducted to more than 70 km-depth follows different evolution, undergoing intense plastic deformation and upward flow. The sedimentary material buried to these depth experiences still greater deformation: it is squeezed by the thickening and moving up crust and extruded upwards, overtaking the rising crust.
Set-up of thermo-mechanical experiments
A scheme of the experiment is shown in Fig. 1. It is similar to the mentioned isothermal experiments. The principal difference is that the lithospheric layers are made of new temperature sensitive materials (hydrocarbon compositional systems) and that the whole model is subjected to a vertical thermal gradient. The subducting plate comprises oceanic and continental parts. The oceanic lithosphere is one layer, while the continental lithosphere is composed of three layers. The upper layer corresponds to a sedimentary cover; it is continuous and coloured in green at the continental margin and in red in the rest of the model to better visualise its deformation during the experiment. The whole crust is made of a single material in contrast with the isothermal experiments where two different materials were used to simulate the strong upper crust and the weak lower crust. The rheological stratification (reduction of strength with depth) of the crust is now achieved in a more continues and natural manner due to the temperature gradient. The overriding lithosphere is oceanic and is thinned in the arc area as suggested by petrologic (Schmidt and Poli, 1995), geothermal (Furukawa, 1993), and seismic (Zhao et al, 1994) data as well as by the results of thermal numerical simulations (Peacock, 1996; Kincaid and Sacks, 1997). (The thinning, however is not important for the present experiments where overriding plate does not fail during subduction). The lithospheric plates are underlain by the low-viscosity asthenosphere, which is pure water. Convergence is driven by a piston moving at a constant rate throughout the experiments, and the pull force generated by both subducted oceanic lithosphere and the continental lithospheric mantle.
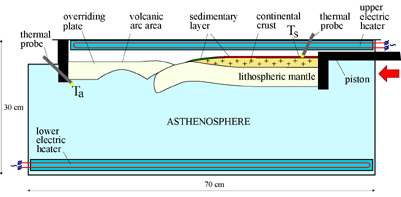 |
| Figure 1. Scheme of the experiments. The names of model layers correspond to what they model: e.g. the continental crust means the continental crust model. The lithospheric layers are made of the hydrocarbon compositional systems. The asthenosphere is model by pure water. |
Upper and lower electric heaters (Fig. 1) are used to create a vertical thermal gradient in the model shown in Fig. 2a. The temperature is controlled and maintained by high precision thermal probes and auto-adaptive thermo-regulator: temperature Ts is imposed at the lithosphere surface and the asthenosphere is maintained at temperature Ta. The thermal gradient inside the model induces a vertical variation of mechanical properties in each layer: the strength of the crustal layer drops from 30 to 15 Pa between the top and the base (Fig. 2b). The lithospheric mantle strength reduces from 45 Pa at the “Moho” to 8 Pa at the base. Ts = 37°C and Ta = 42°C are maintained constant throughout the experiments.
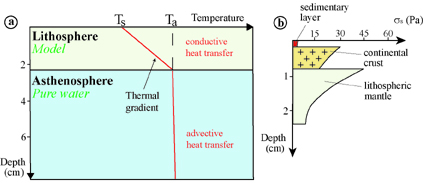 |
| Figure 2. Thermal gradient maintained within the model (a) and strength envelope of the continental lithosphere model before subduction (b) at strain rate: e = 2x10⁻² s-1 |
The mechanical similarity criteria met in this modelling are the following (Chemenda et al., 2000):
ss/
rsgHs
= const, sc/
rcgHc
= const, sl/
rlgHl
= const, rl/ ra
= const, rl/ rc
= const, Hl/Hc = const, Vt/Hl
= const, VH/k = const; (1)
where ss,
sc
and sl
are the average yield limits under normal loading of the sedimentary cover,
the crust, and the mantle, respectively; Hs, Hc
and Hl, are the thicknesses of the sedimentary cover,
the crust, and the mantle, respectively. rs,
rc, rl
and ra are the densities
of the sedimentary cover, the crust, the mantle and the asthenosphere.
V is the convergence rate, t is the time, k is the
thermal diffusivity of the lithosphere and H is the thickness of
the whole continental lithosphere. Table 1 shows the parameters values
assumed for the prototype and the model which satisfy the similarity conditions
(1).
We report here the results of one representative experiment (Figs. 3, 4 and 5). The initial stages of this experiment (Figs. 3a to c) are the same as in the purely mechanical modelling. At stage c the subducting “sediments” reach the base of the overriding plate, being already very weak. They are partly underplated at the lower part of the interplate zone and partly accumulated at the entrance of this zone. The continental crust subducts deeper, following the subducting lithospheric mantle and reaches ~4 cm-depth (equivalent to ~130 km in nature). Then it fails and a crustal slice (unit 1 in Figs. 3d and 5b) starts to slide up, intruding the lower crust. This is the beginning of a delamination of the subducted crustal and mantle layers. Approximately at the same stage, the sedimentary cover starts to be scraped off and accreted in front of subduction zone (Figs. 3d and 5b). The crust in the interplate zone undergoes ductile along-interplate zone shortening and thickening in the direction perpendicular to this zone. This is followed by the failure of the crust resulting in the formation of a second slice (unit 2 in Fig. 5d). This decoupled from the lithospheric mantle slice rises, pushing up and extruding the sedimentary material accumulated along the interplate zone. The deeply subducted sedimentary cover (green colour in Figs. 3f and 5d) of the continental margin therefore find itself over the crustal slice at the last stage of the experiment (Figs. 4 and 5e). During this process, the subducted lower crust continues to flow up under the upper crust, increasing the crustal thickening. The subducted lithospheric mantle then breaks off (Fig. 3g and h) after which the experiment was stopped.
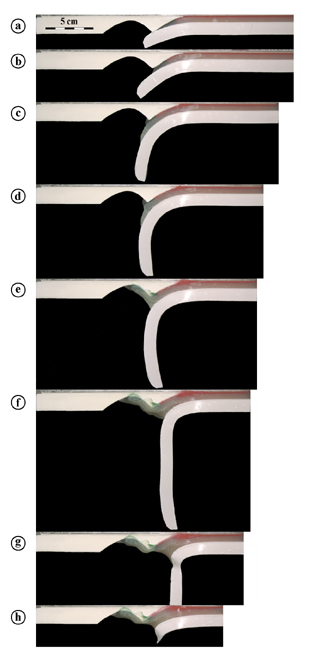 |
Figure 3. Experimental result: a to h, photos of successive stages of the continental subduction. The model parameters are indicated in Table 1. |
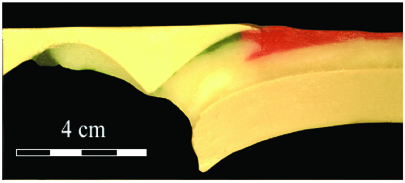 |
| Figure 4. Cross-section of the middle part of the model at the last stage (h in Fig. 3) of the experiment. (View animation) |