Structural model
Model realisation
The 3D structural model was constructed by applying the software 3D Move to a series of geological sections across the study area. For their shallow part, these sections were drawn based on a detailed field survey on the Quaternary fault system of the high Agri River valley. Available information obtained by field structural analysis was used to constrain the geometry of surface faults (Figs. 3 and 4). The part of the cross-sections used to build up the structural model at depth (Figs. 5 and 6) was drawn based on the analysis and integration of the large amount of subsurface information (deep geological sections, borehole and seismic reflection data) published on the high Agri River valley hydrocarbon province (Mostardini and Merlini, 1986; Carbone et al., 1991; Casero et al., 1991; Roure et al., 1991; Mazzoli et al., 2000; 2001; Menardi Noguera and Rea, 2000; Morandi and Ceragioli, 2000, 2002; Shiner et al., 2002; Butler et al., in press). Examples of hydrocarbon well log and seismic reflection data are shown in Figs. 7-9. Seismic response within the study area is highly variable, ranging from moderate to poor. It is controlled by a number of factors commonly observed to limit seismic quality within fold and thrust belts, namely: extreme topographic variation, highly variable surface geology, complex structures commonly characterised by steep dips, strong lateral variations in velocity resulting in Òpull-upÓ phenomena, and the presence of marked velocity inversions, particularly at the base of the allochthon (La Bella et al., 1996; Dell'Aversana et al., 2000). Given this, the only seismic event that can be identified and mapped with a moderately high level of confidence based on its seismic character alone is the Top Apulian Platform reflector. This event is seismically characterised by a high-continuity, high amplitude, low frequency singlet or doublet, arising either directly from the Top Apulian carbonates or by interference between reflections deriving from the strong positive reflection coefficients at the top of the platform and at the top of the Pliocene clastics (Figs. 7 and 8).
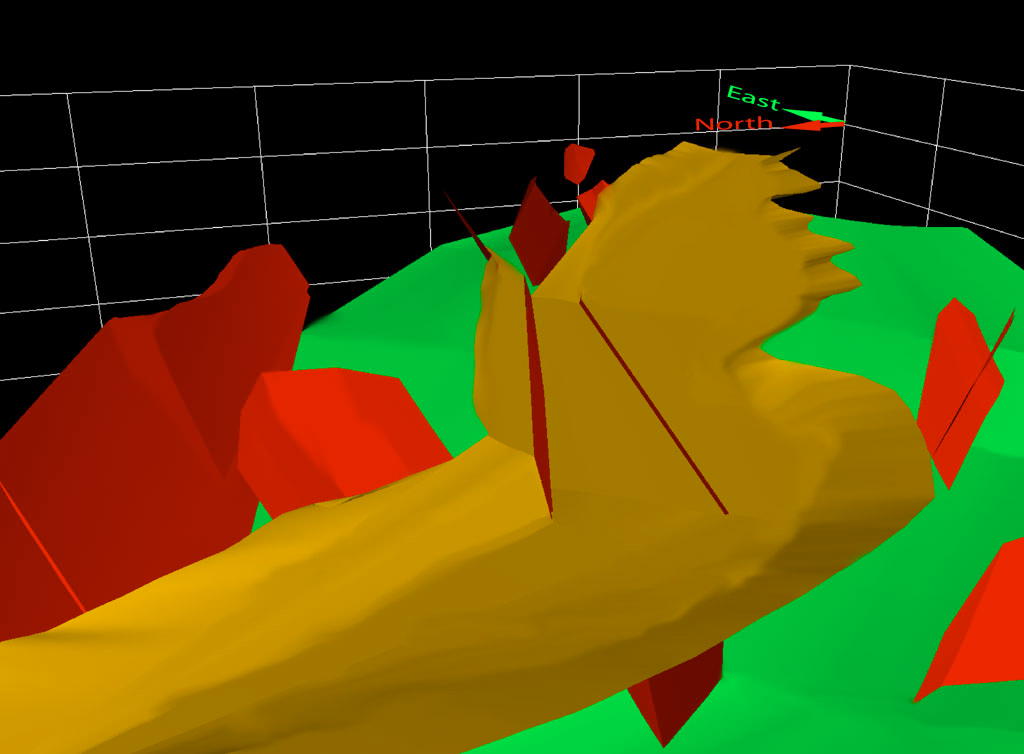 |
| Figure 3. Three-dimensional structural model: detail of faulted base Quaternary on the NE side of the valley (view from WNW). Legend in Fig. 2. |
 |
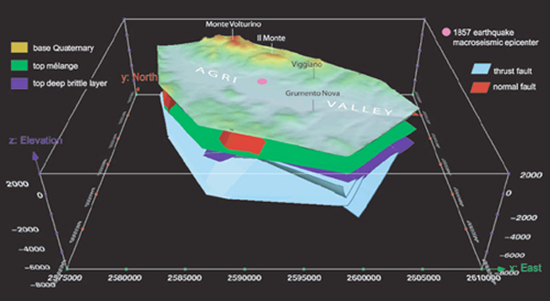
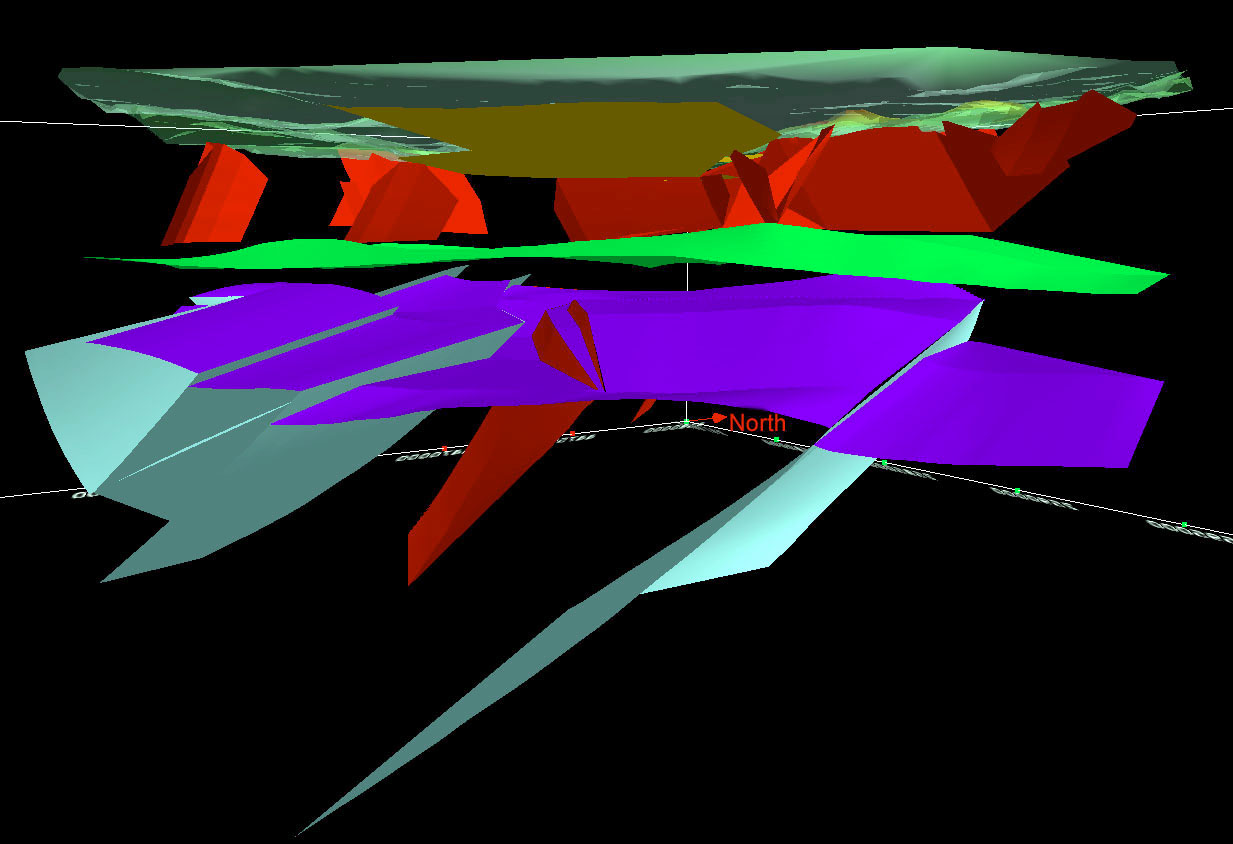
| Figure 4. Three-dimensional structural model: view from the East, showing (in red) shallow fault pattern (translucent topographic surface; base Quaternary not shown). Legend in Fig. 2. (Enlargement) |
 |
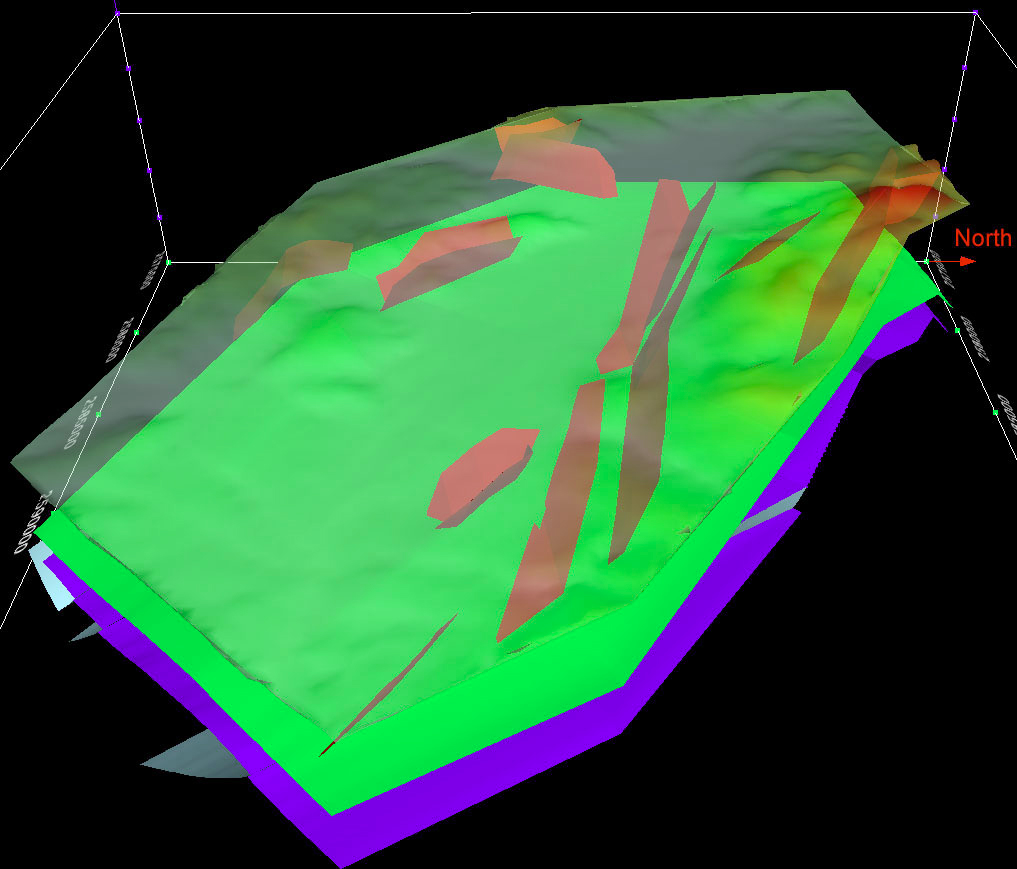
| Figure 5. Three-dimensional structural model: faults within the deep brittle layer (view from SE; top of the deep brittle layer in dark blue, thrust faults in sky-blue, normal faults in red). Legend in Fig. 2. (Enlargement) |
 |
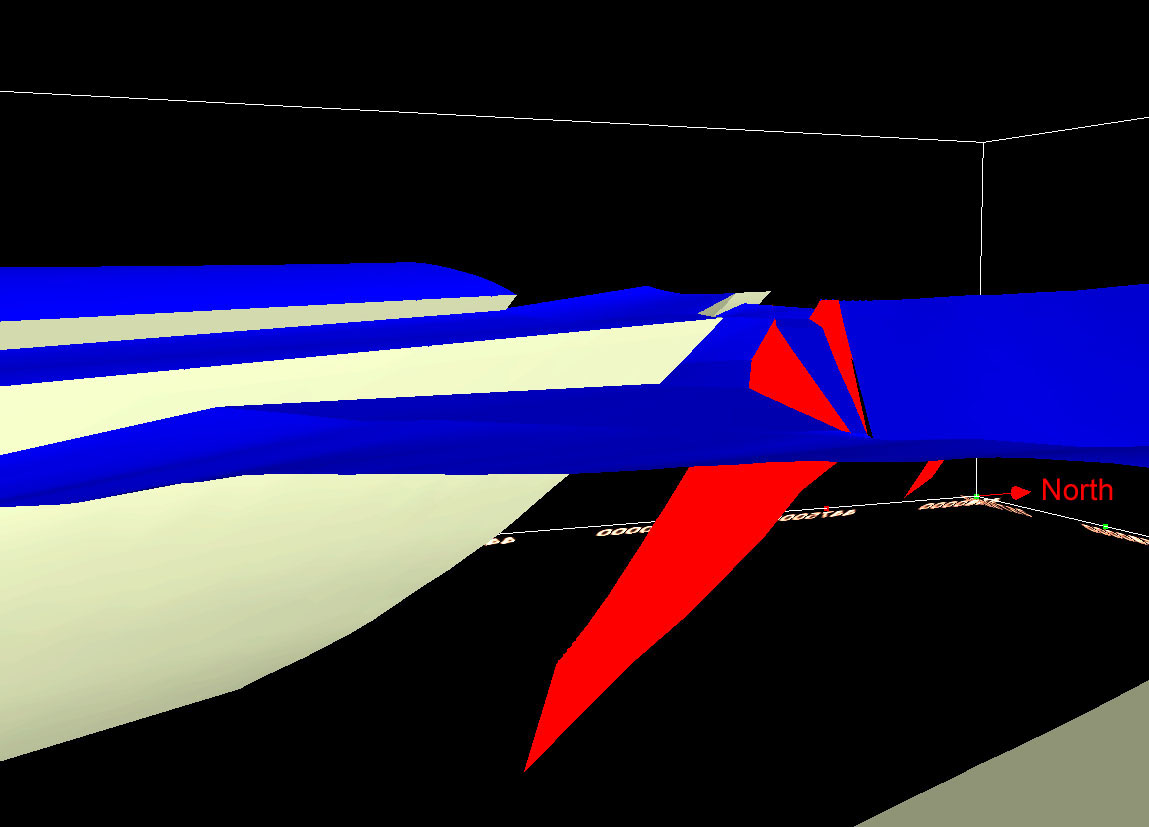
| Figure 6. Three-dimensional structural model: view from SE, showing lack of continuity between normal faults in the shallow layer (i.e. the allochthon) and those in the deep brittle domain. Legend in Fig. 2. (Enlargement) |
Fig. 7 shows an interpretation of the Top Apulian Platform reflector in a typical seismic line from the Lucania area. A main low-angle detachment separates the Pliocene sequence, stratigraphically overlying the Apulian carbonates in the footwall, from the allochthonous units in the hanging wall. This detachment Ð and the associated mŽlange zone (Fig. 9a) Ð also divides the section into two parts showing different styles of deformation: the allochthon, characterised by low-angle thrust surfaces, and the Apulian domain, characterised by steeply dipping reverse faults. The base of the Apulian platform is also visible as a strong reflection in some areas and can sometimes be used to guide the interpretation of the top platform (Fig. 8). This deep seismic event was interpreted by reference to deep wells drilled in the Apulian foreland. For instance, the Puglia 1 well drilled 6112 m of shallow water carbonates and evaporites before penetrating an unconformity underlain by about 1000 m of continental to transitional argillites and sandstones (Fig. 9b).
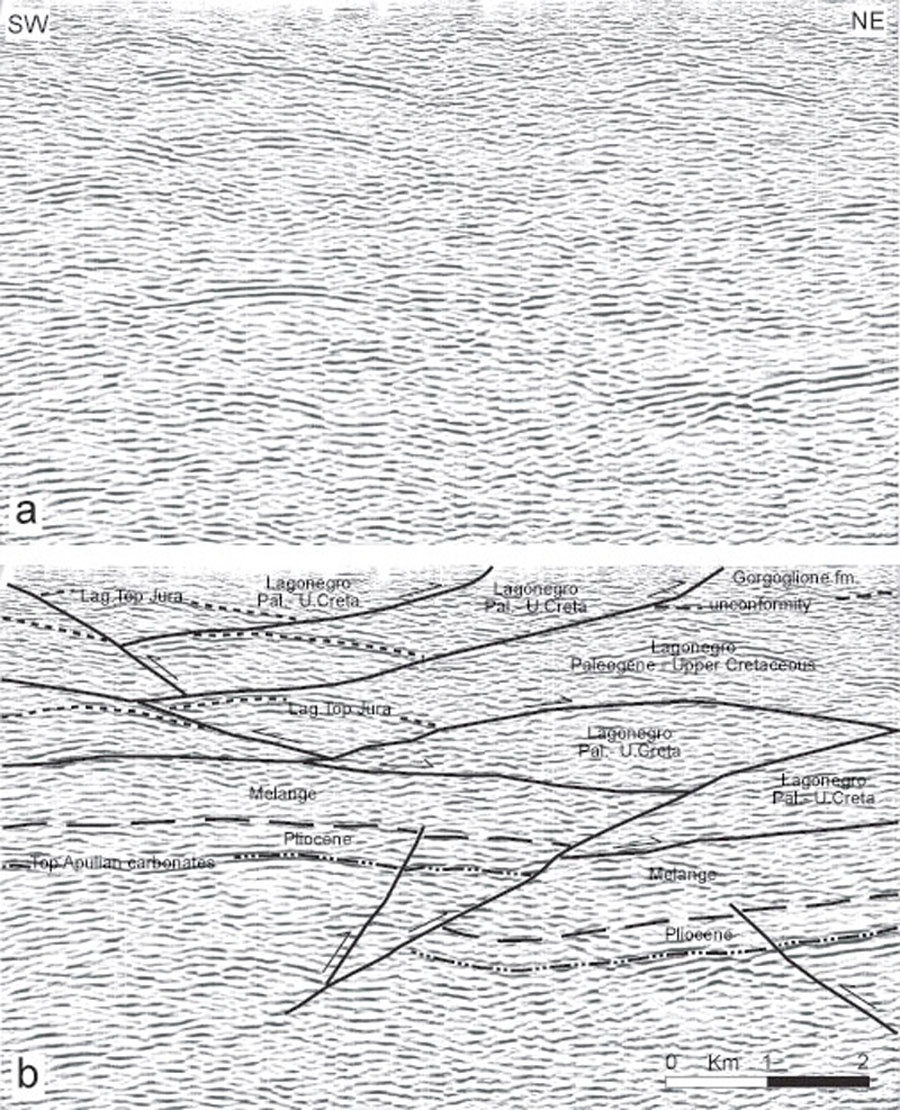 |
| Fig. 7. (a) Stack seismic line across central Lucania (from Mazzoli et al., 2000; precise location and depth in two-way-time are confidential). (b) Interpretation, showing allochthonous thrust sheets overlying the Apulian platform carbonates. (Enlargement) |
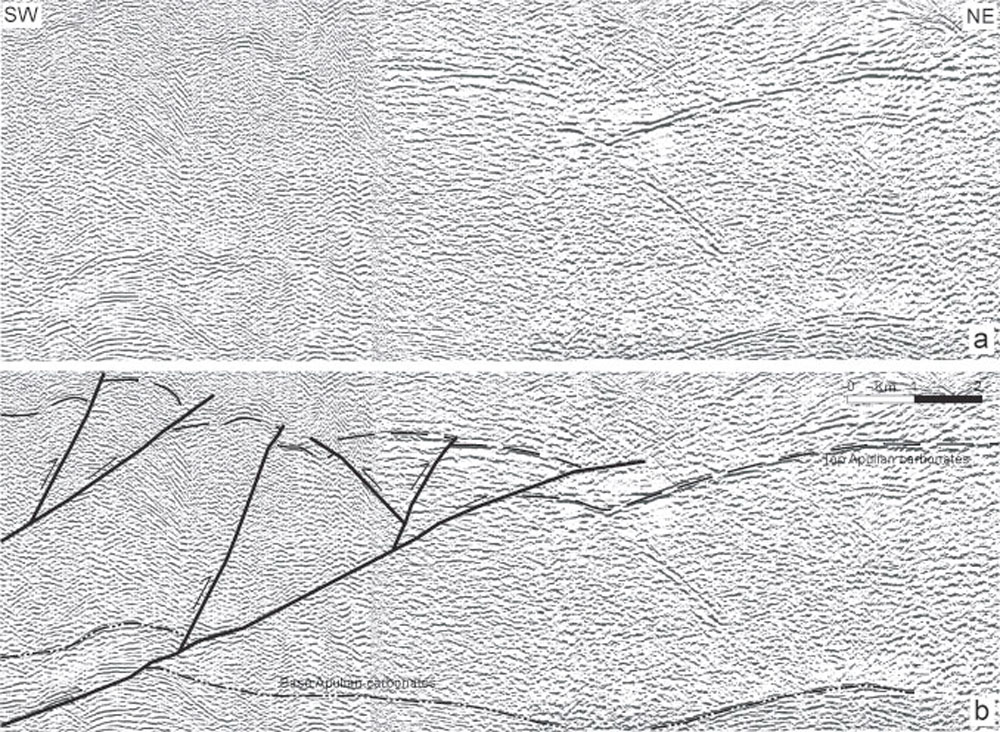 |
| Fig. 8. (a) Stack seismic line across southern Lucania (from Mazzoli et al., 2000; precise location and depth in two-way-time are confidential). (b) Interpretation, showing reflectors ascribed to ÒtopÓ and ÒbaseÓ Apulian platform carbonates. (Enlargement) |
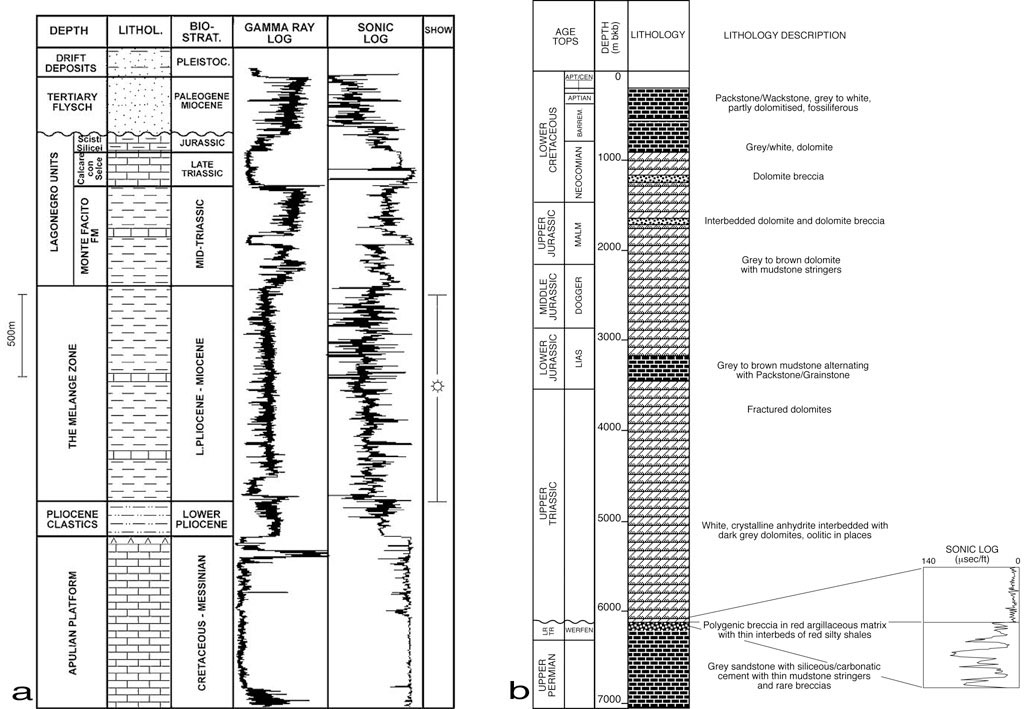 |
| Fig. 9. (a) Typical hydrocarbon well in the Lucania area of the southern Apennines, showing thick mŽlange zone at the base of the allochthonous Lagonegro and Tertiary flysch units (from Butler et al., in press). (b) Simplified stratigraphic log of the Puglia 1 well drilled in the Apulian foreland. Inset shows detail of sonic log around the base of the shallow-water carbonate succession (from Mazzoli et al., 2000). (Enlargement) |
Model description
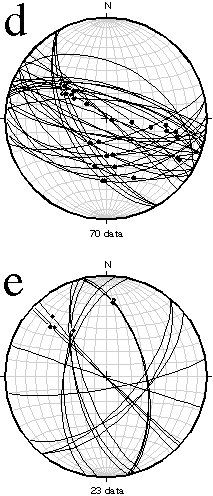
The shallow part of the 3D structural model shows how the Agri River basin, filled with Quaternary fluvio-lacustrine, alluvial fan and slope deposits, is tectonically controlled by WNW-ESE striking, high-angle faults (Figs. 3 and 4). These, according to Giano et al., (2000), acted as left-lateral strike-slip structures during the Early Pleistocene and were later reactivated, mainly as normal faults, in Middle Pleistocene-Holocene times (latest documented extensional activity dated at 40-20 ky; Giano et al., 2000). At surface, this fault system is mainly developed along the north-northeastern side of the valley (Figs. 1d-e and 4). Here, it produced significant tilting of the bedding in a domino fashion, as well as an asymmetric filling of the basin, which shows a maximum thickness along the same side (Morandi and Ceragioli, 2000). At depth, a recent (i.e. post-thrusting) normal fault (with a secondary splay) offsets the buried Apulian unit (Fig. 6). This fault develops for about 20 km in WNW-ESE direction, dips toward SSW with an angle of ca. 60¡ and shows a total vertical displacement of about 350 m referred to the Top Apulia Platform horizon. This structure, however, does not link directly with the extensional structures in the overlying allochthon (Fig. 6).The relationships between shallow and deep structures reconstructed in the study area can be fully appreciated in the animation of Fig. 10.
Further and independent constraints on the reconstructed relationships between surface features and deep faults in the high Agri River valley are also provided by fluid inclusion data. Samples from fault rocks exposed in the study area contain fluid inclusions composed of very low-salinity water (Cello et al., 2001). This contrasts with data from similar basin-bounding faults exposed in other areas of the Apennines (e.g. the Central Apennines). The latter contain fluid inclusions composed of high salinity water, which has been interpreted as a result of fluid upwelling from a depth of 4-6 km (Cello et al., 2001). In our study area, the lack of hydrocarbon and/or high-salinity water inclusions rules out a direct connection of the surface faults with the deep (Apulian) reservoir, while it is compatible with the interpretation that surface faults are confined within a shallow level.