The challenge of building a comprehensive 3-D geological model resides in that subsurface geology is by definition difficult to access and thus can only be crudely mapped or extrapolated even in the best of conditions (Kelk, 1992). Geophysical methods, such as three-dimensional seismic surveying, provide data to image broad geological structures present at depth, but lack the capacity and resolution to picture complexly folded geological surfaces, faults and fracture networks, and fault-fold complexes. Exploration boreholes, in conjunction with geophysical data and surface relationships, bring complementary data that provide the basis for rough extrapolations of three-dimensional relationships within limited geological volumes.
Large rugged surface exposures, such as those found in the Canadian Rocky Mountains, offer some unique 3-D mapping opportunities to derive general principles governing the development of structural elements in thrust-fold belts. In such areas, if geological elements could be mapped precisely on a given mountain cliff face, and could be extrapolated through the mountain subsurface to fit with corresponding geological elements outcropping on opposite exposures, a three-dimensional model of a large geological volume (1-10 cubic km) could be created. Hence, the distribution of through-going features such as folds, faults and fractures (10-1000 m extent) within such volumes could be explored and it would provide better control for the kinematic interpretation of such features. This is an area or research that is particularly intriguing to oil and gas geologists in light of the increasing recognition of lateral reservoir compartimentalization by minor faulting, as a cause of low oil and gas pool volume and productivity. These small reservoirs may be more productive if they are connected through regionally continuous fractures, that have also long been thought to represent migration conduits for hydrocarbons systems. Thus, any surface analogue examples of such relationships would be valuable as models for subsurface exploration. It has been shown also that a better description of the 3D geometry of fracture arrays near the surface or in boreholes, help to produce more realistic flow models and enhances hydrocarbon productivity (Yose et al. 2001). To explore hydrocarbon reservoirs situated at depth, better conceptual models of fracture geometry and development relative to fold features are particularly needed in the Foothills of the Canadian Rocky Mountains (Newson and Sanderson, 1999; Osadetz et al., 1995). This is also a leading research topic in other parts of the world (Pringle, this issue; Circle Ridge Fractured reservoir study, US Department of Energy Advanced Imaging Program).
We present an outline to an integrated method towards 3D geological modelling combining 2.5-D photogrammetric mapping with various classical geological methods. These latter methods, such as field mapping, balanced cross-sections and surface contouring techniques (Groshong, 1999), lead to more realistic three-dimensional digital models of fold-fault complexes if combined with photogrammetrically-derived data. The proposed integrated method is an iterative process that is best illustrated by using computer animations. The virtual model is based on a detailed stratigraphic framework (Richards, 2000), and structural mapping during a regional geological campaign. These data are incorporated in the 3D 'virtual mapping' process that comprises three basic steps. These are: 1) refinement of the early geological map through vertical photogrammetry and 2.5-D terrain rendering; 2) optional oblique photogrammetry to refine the geology map of complex structures in rugged cliff areas; 3) 3-D surface and volume construction with geological modelling software tools, integrating the 2.5-D geological framework, subsurface data, and interpreted cross-sections.
This integration approach was developed using data gathered through a geomatics and geology study of a rugged area of the inner Foothills of the Canadian Rocky Mountains, at Moose Mountain, Alberta (Figure 1). Field work consisted in detailed geological mapping of the area, guided by stereo aerial photos in the field and by a 2-D digital orthophoto for observation transcriptions at field camp. This initial stage led to a preliminary geological map of the area, which was refined over a period of two field seasons (Marcil, in preparation). Geodetic and photogrammetric data was acquired separately, for more detailed "virtual" mapping of steeply inclined slopes in the laboratory (described below).
Figure 1. Moose Mountain, Alberta
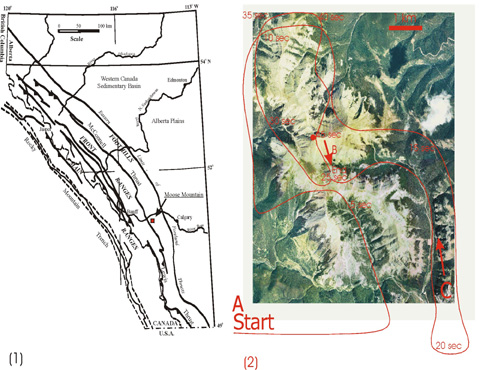
(a) Regional geological setting of Moose Mountain, Alberta of the inner Foothills of the Canadian Rocky Mountains. (b) Colour orthophoto of Moose Mountain, Alberta, used for geological mapping and in the terrain rendering of Figure 2, with superposed flight paths of computer animations found at Figure 3 ("A"), 5 ("B") and 6 ("C"). Time intervals in seconds, where each 10 sec step corresponds to one frame in the Figure 3 animation.
We use four different computer animations to illustrate the 2.5-D mapping and 3D modelling methods. The computer animations provide visualization of geological structures. These are: 1) a virtual reality 2.5-D draped orthophoto model (terrain rendering) of the rugged area with mapped regional lithostratigraphic units and structural plane traces; 2) an animation extracted from an oriented oblique photogrammetry model and orthophoto of a physical rock exposure, with mapped and draped 2.5-D geological elements; 3) a computer animation that describes the various steps involved in building a 3-D geological model from the integration of field data and photogrammetry data through the use of various Computer Aided Design Software (CAD) and 3-D modelling tools.
Precise geological mapping of small discrete features, such as small-scale folds and fractures, within large rock volumes of rugged mountainous areas poses special challenges owing to the difficulties of access. Although vegetation is sparse or absent above the tree line, scree can cover much of the bedrock, and cliffs can be especially daunting (Figure 2). Recording of accurate observations can also be challenging in typical field conditions encountered in alpine terrains, where summer seasons are short and weather can be rapidly changing, access to remote areas is by helicopter, and thus time can be very precious. Geological field observations traditionally comprise a mix of written and tabular data and accompanying illustrations. These illustrations, either as photographs or sketches are used to describe various geological features (folded surfaces, faults, lithological boundaries, etc) and field relationships (e.g. measured stratigraphic sections, crosscutting relationships, etc.). Two-dimensional media (paper, film, and computer bitmaps) are insufficient to accurately describe, illustrate and quantify three-dimensional elements such as fracture networks, by themselves or in relation to folds and faults. For these reasons, many structural problems such as the exact three-dimensional geometry of geological structures residing in large and complex rock exposures remain elusive and derivative kinematic interpretations are usually incomplete. Thus, better techniques to describe geology in 3-D should help towards better kinematic interpretations of regional features.
Figure 2. Land surveyor and photogrammetrist gathering control points
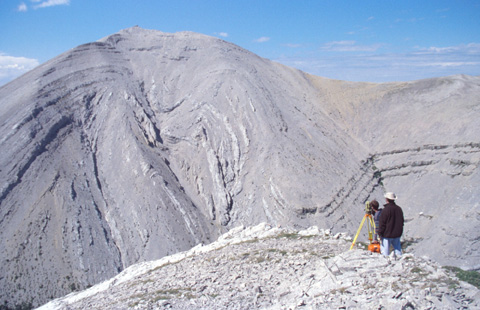
View looking north of land surveyor and photogrammetrist gathering control points at Moose Mountain, Alberta, near the head of Moose Dome Creek, a rugged area of the Rocky Mountain Foothills, that is also the setting of a relatively important gas field (Newson and Sanderson, 1999). In particular, this area has been selected because structures within Carboniferous carbonate thrust sheets are well-exposed, and provide sufficient structural continuity to allow for accurate geological mapping. Cliff face opposite from the viewpoint is 600 m high (peak/fire tower is at 2438m). Folds and stacked fault slivers, observed in the Lower Carboniferous Rundle Group carbonates, are typical of the structures prospected 3000-4000 m below the surface for natural gas by the petroleum industry. Several exploration wells have been drilled to that depth, within a few kilometres of this location (Moose Mountain gas field).
Photogrammetry is a natural extension of the traditional use of photographic illustrations in geological surveys. Photogrammetry consists of using computer or instrumental techniques to orient photographs taken from either a digital or analog camera to extract precise measurements of physical objects from the intersection of lines of sight. Most commonly, geologists use photogrammetry in its simplest form, as stereopairs of vertical aerial photographs to map the extent of geological elements interpreted from the structural relief of geomorphological features. Precise regional-scale mapping can be achieved in this manner, as a complement to field observations. Other digital technical variations, such as vertical orthophotographs or oblique visualisation of draped imagery over digital elevation models (DEM) or 'terrain renderings' are increasingly interesting mapping tools. This is because they provide a visual perception to the user that resembles the actual appearance of the field area, and they are now easier to create with the increased availability of the necessary datasets, software and hardware (Gwinner et al. 2000, Lebel et al, in press).
Although it is known that oblique close-range photogrammetry can provide additional data to substantiate the more traditional field methods, few such studies exist. The early oblique photogrammetry studies, set in Greenland and in the U.S. (Dueholm 1993a, 1993b; Coe and Nelson, 1997), have developed methods to remotely record quantitative measurements of simple geological geometries, such as sedimentary channels and parallel bedding from a laboratory setting, following image acquisition in the field. However no study so far have addressed the question of complex, large-scale geological structures.
The first step of our 3-D geology integration method consists in using vertical aerial orthophotographs to refine the geological map of the rugged area. Figure 3 represents a computer animation of a regional orthophoto draped over a DEM of the studied area (also termed a "terrain rendering"). Geological contacts derived from field work and ortho-, stereo-photogrammetry and terrain rendering interpretation are shown as solid lines overlain on the photographic base. We have described this combined photogrammetric technique, for geological mapping, integrated within a CAD environment (Bentley Microstation) in Lebel et al. (in press). We used readily available regional geospatial data (aerial photographs and DEM, and photogrammetrically derived orthophotos). We also described the approach and the advantages and inconvenients of using this relatively simple mapping tools and data to complete a 2.5-D virtual geological model of the same mountainous area described here. In summary, the strength of the approach resides in the fact that the interpreted geological linework, positioned using the photogrammetric models, can be readily verified to be geospatially accurate, and thus be a representative survey of the geology.
Animation 3. Computer flythrough
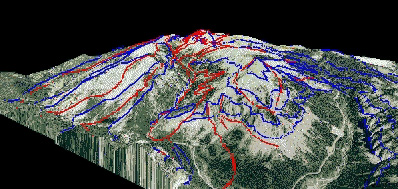
Computer animation (Quicktime) representing a 'flythrough' (or a panoramic animation along a virtual flight path) of a high-resolution colour orthophoto and geological map draped over a TIN, for the Moose Mountain area. See text for explanations. Geology by Marcil (in preparation). Computer animations in Figure 3 and 5 are in the AVI format, and Figure 6 in Animated GIF. Each can be visualised with several common computer animation viewers (e.g. Microsoft Media Player and Apple QuickTime). See flight paths at Figure 1.
The computer animation presented at Figure 3 is a 'flythrough' composed of a series of still frames captured from the oblique sequential visualisation of terrain renderings. These individual still frame renderings are derived from oblique viewpoints of a vertical high-resolution orthophoto of the area (0.7 m/pixel) draped over a Triangulated Irregular Network (TIN) of the DEM data of the area. The flight path runs along a curving trajectory situated some 1000 m above the highest elevation point. The sequence was put together using the 'Flythru' module (ÔmdlÕ program) provided with Microstation, and a 'constant' rendering mode using 'pattern maps'. The flight path starts with a view towards the northeast and is centred on the highest elevation point, Moose Mountain, near the centre of the rendered area (see Figure 1 for flight path). Red lines are thrust faults and blue lines are formation boundaries, draped over the TIN surface and the orthophoto. The 2.5-D mapped framework consists in Carboniferous carbonates, locally folded into tight structures and repeated by W and E-directed thrust faults that form complex structures such as the one shown on Figure 2. The mapped geological linework was systematically examined and corrected from various points of view but still needs to be perfected, especially in the central part of the area (Figure 3, frames from time 0:06 to 0:12 and 0:23 to 0:46). This corresponds to the core of the anticlinorial culmination of Moose Mountain (Newson and Sanderson, 1999, McMechan, 1995) and geology is especially difficult to decipher due to access, shadowy cliffs and the presence of numerous folds and faults. Frames 0:26 to 0:27 (Figure 3) are particularly interesting, because they readily illustrate the strength of the 2.5-D terrain rendering technique to quickly spot abnormal relationships of folded and faulted surfaces. A complex fold is visible on the south face of the mountain (bright area with outlined antiformal structure, matching bulk of Figure 2), but has not yet been mapped on the north side of the mountain. By carefully going through the flythrough movie, one can quickly see that the structure continues northward but is difficult to detect because it underlies and actually forms most of the north running ridge situated behind Moose Mountain (Figure 3-Frames 0:27 to 0:43). Clearly, earlier traditional mapping of the area missed this structure and our digitally enhanced map will provide a means to reappraise the area.
Important data pitfalls are also evident from the visualisation of the exploratory sequence presented at Figure 3. This is best illustrated by the last few frames of the animation (Figure 3-Frame 0:47) that image a fold situated opposite to the Moose Mountain fold (Figure 3-Frame 0:26, cliff opposite to Figure 2), along a view looking southwards. The most important problem of the vertical photogrammetry method is that the accuracy of the measurements and surveyed lines is dependent on the DEM data and on the resolution of the aerial imagery. In regional DEM and aerial imagery data, cliff areas are usually too undersampled to represent accurately the physical features. Thus 'virtual' terrain model of important cliffs are often represented with shallower slopes than their physical equivalent (due to sparse data), which can reduce sensibly the validity of some geological measurements, such as measured stratigraphic sections and bedding strike and dip (Lebel et al., in press). The real world equivalent of the exposure visible in frame 0:47 (Figure 3) is particularly puzzling to researchers because it presents only a single anticlinal closure, whereas the opposite cliff displays at least three different anticlinal structures at higher elevation, suggesting a moderate fold plunge. This plunge contrasts with the northern continuation of the structure, suggesting a possible lateral thrust ramp at depth. Faults are also difficult to trace across the valley to the next mountain face, due to interrupted exposures. The southern rock face is relatively steep and the terrain rendering gives only a poor representation of the real geological features due to the steep terrain slope and the fact that it is generally poorly illuminated (north facing slope). This is an ideal situation to explore the more sophisticated oblique photogrammetry technique to survey this rugged area (see below).
When important structures are physically inaccessible or too complicated to describe comprehensively through written descriptions and sketches, geologists rely on photographs to quickly record a critical image for future interpretation. Oblique photogrammetry can be used in the same way to derive exact measurements of the 3-D geometry of a rock exposure.
The oblique photogrammetry technique uses the same mathematical principles as vertical photogrammetry, proceeding in steps going from camera calibration, to image acquisition, to relative and absolute image orientation and finally image analysis and feature extraction. The oblique photogrammetry technique has found a variety of applications: architectural design, accident scene reconstructions, movie sets, archeological surveys, civil engineering surveys, etc. (Boulianne 1995; Gravel 1999; Guillotin 1997; Huang 1998; Streilein and Niederöst 1998).
Oblique photogrammetry has been applied with success to geological mapping in the past (Dueholm 1992; Larouche et al. 1994; McGuffie et al. 1989; Pillmore 1989), but apparently its technical challenges have been perceived to outweight its benefits relative to more conventional mapping and photogrammetry methods. Few studies have been performed so far, and to our knowledge, this is the first oblique photogrammetric study dealing with complex structures in rugged mountain areas.
Our early efforts described here have been devoted to the evaluation of the method for measuring geological element orientations and spacing in areas difficult to access (Vuitton, 2001). The technique is deemed appropriate in special circumstances, for instance when detailed quantitative information is needed. In rugged areas this technique can be essential to complement measurements made by vertical photogrammetry and geological field observations, to carry a comprehensive 3-D evaluation. Our long-term objective is to complete the vertical photogrammetry-derived 2.5-D geology map presented above (Figure 3) with oblique photogrammetry, in areas critical for understanding fracture development. So far, we have only derived a limited set of geological structure measurements and detailed elevation data through oblique photogrammetry, using oriented oblique photographs taken from close-range (<300 m) for detailed study of some fractured and folded rock exposures. Other photographs, such as those taken from high mountain vistas of more complex exposures remain to be examined in detail.
Oblique photogrammetry was used here because the extension of some critical geological elements was often obscured by steep and shadowy cliffs and near surface erosion processes. The field campaign consisted in the acquisition of survey points, and a series of overlapping photographs. We followed the general principles of distance and overlap (60%) for oblique photo acquisition, as outlined by Dueholm (1993a, 1993b), although our coverage is not systematic due to difficulties in finding proper view angles. The analytical approach also varied in that we used computer programs ('soft-copy photogrammetry') to process and analyse the data, rather than the older analog/mechanical techniques. The PhotomodelerTM (EosSystem Inc.) photogrammetric software was used to perform image model orientations. As it pertains image acquisition, photographs were taken a medium format camera, with film diapositives (64 mm) that were eventually scanned at 2000 dpi with a Howtek photogrammetric drum scanner. High-resolution digital cameras are now more advantageous than film cameras, as they save the time-consuming step involved in scanning the film, and are also more straightforward to calibrate, since the CCD recording device does not distort like film. However, few high-resolution digital cameras are available with good optics and SLR type lens, to allow for a straightforward calibration, which explains our choice.
The surveyed points acquired to act as ground control points (GCPs) for the model orientation were obtained with a geodetic total-station by aiming at a series of individual station locations secured by a surveyor equipped with a reflective prism. This was a rather time-consuming process, necessary to obtain an accurate photogrammetric model. Total-station positions were derived from differential GPS measurements and triangulation. Close and panoramic photographs of rock exposures were acquired from a variety of viewpoints, enhanced by sketches for reference, following usual geological mapping procedures.
Using 'soft-copy photogrammetry' systems, a PC, and sets of digital images, we were able to extract elevation data of particular geological features, such as bedding and fractures, and to measure accurately the orientation and spacing of these elements in rugged settings. Our comparisons of field and oblique photogrammetry measurements of geological elements show that where the camera is accurately calibrated, orientation and spacing measurements are reliable. A more complete discussion of the relative strength of the various soft-copy photogrammetry packages and description of the results can be found in Vuitton (2001).
The oblique images (Figure 4) and computer animation found in Figure 5 illustrate the technique used here to derive high-resolution 2.5-D geological elements from an oblique orthophoto and terrain rendering, of steep cliff faces. As described above, several prior steps lead to this terrain rendering. Following the film acquisition and digitisation, oblique overlapping photographs were imported into the PhotoModeler photogrammetric software and a relative orientation model of each image was derived from a series of matching points. The image sets consisted of three 64 mm film diapositives, with fiducial marks, scanned at 2000 dpi (Figure 4). Following this, some 1400 elevation points were derived visually through individual point matching, using the epipolar point marking tools available in the software. Once this step was completed, a triangulated surface of all the elevation points was constructed. This provided the rugged surface on which to project one of the photographs, in order to derive an oblique orthophotograph. The elevation points were then exported through a data file to the Microstation CAD environment to create a terrain rendering model similar to the one exposed in Figure 3, but this time made from an oblique orthophoto rather than a vertical one, draped over the tilted TIN surface.
Figure 4. Moose Dome Creek
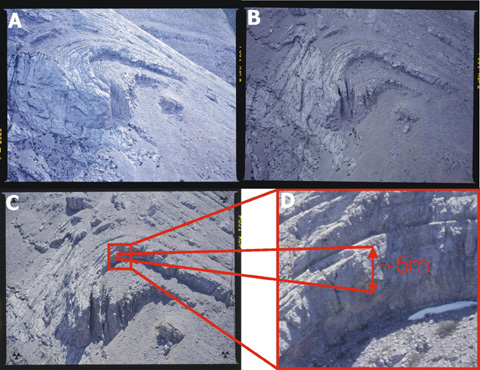
Set of three oblique and overlapping images from three 64 mm film diapositives used to create the TIN and orthophoto shown in Figure 5. Inset to (c) shows the amount of detail that can be extracted from such photographs when scanned at 2000 dpi, with a photogrammetric scanner. View looking to south side of Moose Dome Creek, opposite to Figure 2.
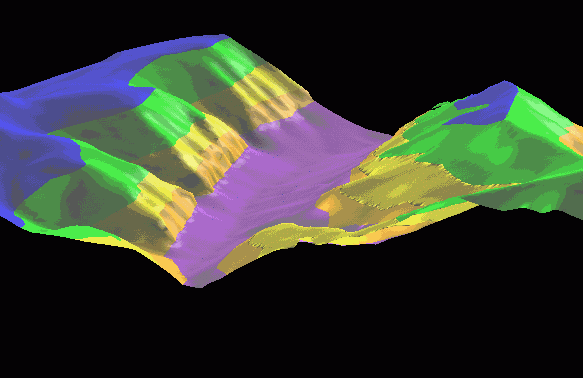
Animation 5. Computer animation
Computer animation representing an oblique photogrammetry and oblique terrain rendering mapping exercise for the exploration of an anticlinal fold on the south flank of the upper reach of Moose Dome Creek. The studied area matches the last frame of the computer animation found at Figure 3. See text for explanation.
The computer animation was constructed with the same computer module as Figure 3, in Microstation. The TIN surface illustrated in Times 0:01 to 0:15 of Figure 5 represents the elevation points extracted by photogrammetry from an oblique image pair of the exposed anticlinal fold on the south cliff face of Moose Dome Creek (see Figure 3, Time 0:47 and explanation above). Turquoise lines are bedding traces, red lines are mapped fractures and the yellow line is the axial trace of the fold. The images from Time 0:16 to 0:18 (Figure 5) illustrate the oblique orthoimage as seen along an orthogonal view axis. We used this point of view to draw the various geological elements along an overlying parallel plane to the image, within a Microstation 3-D file as illustrated in times 0:17 and 0:18 (Figure 5, Time 0:19 is a close-up). The third set of images (Time 0:20 to 0:34, Figure 5) illustrates a terrain rendering of the orthophoto draped on the TIN, explored along a path parallel to the first sequence.
The 2.5-D bedding planes, fractures and axial plane are illustrated in the last sequence (Time 0:35 to 0:49, Figure 5), together with the orthophoto, again along the same flight path. As explained above, these geological elements were first traced along a view plane parallel to the orthophoto image. They were then draped over the TIN using the GeopakTM draping tools in Microstation, to acquire the "crooked line" 2.5-D coordinates observed in the last sequence, which makes each line segment parallel to the corresponding inclined triangles of the TIN surface. The animation demonstrates the benefits that can be gained from the use of oblique photogrammetry in steep rugged areas. The orientation of the fracture, bedding and axial plane can be measured from their traces, as long as the ground surface is rough enough to extrapolate spaced triangulation points for each plane (Figure 6). The nature of the fold style can be evaluated quantitatively (interlimb angle, thickness variations) in a view perpendicular to the fold axis. Fracture densities, frequencies and connectivities could also be measured using a scan line.
Animation 6. Construction of a 3-D geological model
Computer animation representing a conceptual step-by-step approach to the construction of a 3-D geological model at Moose Mountain. See text for description. Frames identified in text by F1 to F37 corresponds to 1 second intervals in some computer animation viewers. (To view image RELOAD page or select image to view Quicktime version)
Oblique photogrammetry has its own pitfalls however. The elevation grid presented here, underlying the TIN, is too sparse to derive exact measures of the fracture orientations using the terrain rendering method, even though it took some 35 operator hours to build. Alternative approaches will be explored in the near future by using a very dense DEM acquired through remote sensing techniques (airborne interferometric radar), to derive a more exact oblique orthophoto. Another limitation of the oblique photogrammetry terrain rendering, is that software such as Microstation only allows "elevation drapes" of imagery over a TIN. Thus an oblique orthophoto cannot be combined with a vertical orthophoto in the same scene, unless one of the two photos and associated TIN are rotated in the same reference frame. However, this is only a software limitation and oblique image draping could be achieved with some more specific programming, or using another rendering software.
Finally, as an alternate to the oblique terrain rendering technique, more precise measurement of geological elements is possible, directly within Photomodeler, given that the camera distance to the fractures is not too large or that the images and camera calibration are of extremely good quality (Vuitton, 2001).