Upper
crustal-level Gravimetric Model
This modelled gravimetric anomaly response demonstrates a poor level
of correlation with the surveyed results (Figure 18). In areas where
recognised gravity structures are interpreted in the observed dataset,
corresponding regions in the model do not in general match in geometry
or intensity. The synthetically generated field displays several distinct
domains of anomalous mass distributions predominantly in the central
regions of the Gawler Craton and on the eastern and northern provinces
of the state. The relatively high gravity, polygonal-shaped anomaly
in the central Gawler Craton is consistent with interpretation of the
deep-seated, regional-scale gravity response of the mafic underplate,
which occurs in close spatial association with the Gawler Range Volcanics
Province. Along the eastern cratonic margin, a number of strong east-west
trending, relatively high gravity signatures are defined. These are
the modelled response of displaced crustal blocks neighbouring the Kimban
Suture Zone. Evidently, the geometry and/or rock properties of this
series of crustal blocks are greatly inaccurate and may point to another
source of the observed anomalies. Many of the shallow-level supracrustal
sequences and accretionary terranes located on and around the cratonic
margins do not have a relatively strong or characteristic modelled gravity
response – with the exception of the Peake & Denison Inlier
in the northwest of the craton. It is clear the response of most upper-scale
geometries from the model represent distinct punctuated gravity lows
superimposed upon the response of the regional structures. This is exemplified
by relatively low gravity signatures from the Adelaidean Fold Belt,
the Gawler Range Volcanics and the Stuart Shelf, the Mabel Creek Ridge
and Mount Woods Inlier, the Lincoln and Ifould Complexes, the Hutchison
Group and much of the Hiltaba Suite Granitoids.
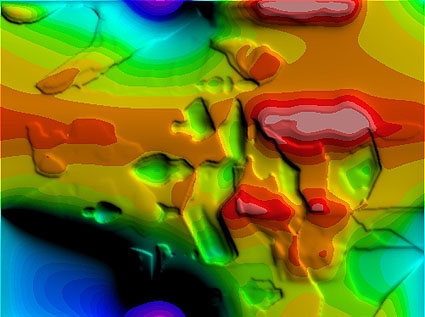 |
| Figure 18. Synthetic gravimetric anomaly response of the shallow crustal-level model. |
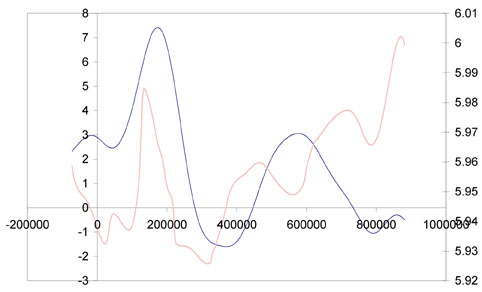
The contrasting gravimetric signatures are further apparent in the traverses of figure 19. These profiles were extracted across the line of 6500000mN (AMG) from both images. There is visible disparity in the distribution of anomaly sources. The geometrical aspects of the anomaly waveforms are clearly dissimilar with obvious discrepancies in the anomaly amplitude and wavelength between the calculated and surveyed data. In addition, the gravimetric intensity values from the observed data is significantly greater than that calculated.
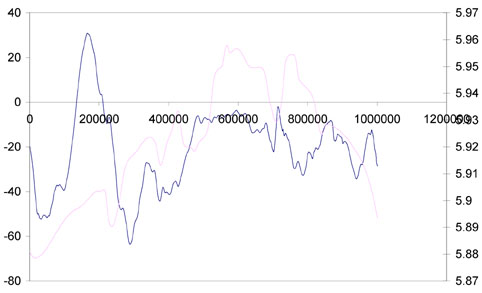 |
| Figure 19. Comparison of traverses extracted across the line of 6500000mN from the shallow crustal-level model; (a) broken line represents response from the model; (b) unbroken line represents response as measured from the field. |
Deeper
crustal-level Gravimetric Model
This modelled gravimetric anomaly response demonstrates a moderate level
of correlation with the match-filtered gravimetric dataset (Figure 20).
The lithospheric-scale model exhibits distinguishing structures in which
the following features are comparable;
• the relatively high-gravity response and curvilinear geometry
of the Musgrave Block;
• the relatively low-gravity response of the Officer Basin;
• the relatively high-gravity, northeast-southwest trend of the
western and north-western domains of the Gawler Craton defining the
western cratonic margin;
• the general low-gravity response of the central domain of the
craton;
(a) 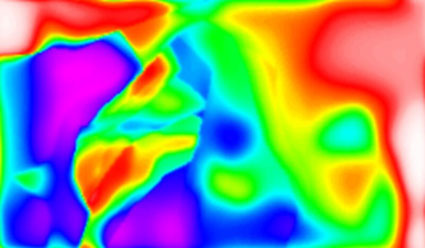 |
(b) 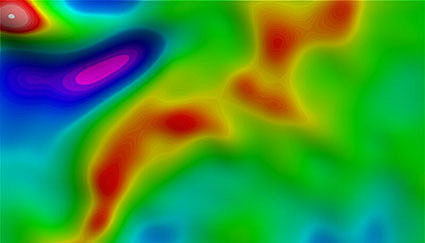 |
| Figure 20. Comparison of the modelled gravimetric response with the match-filtered data; (a) synthetic gravimetric anomaly response generated from the deeper crustal-level model; and (b) match-filtered image of the surveyed gravimetric dataset of South Australia. |
The synthetic gravity response however fails to account for an important part of the observed anomalies in the eastern and northern regions of the study area. The most significant disparity is the relatively high to extremely high, large gravity anomaly in which the model has calculated. Much of this area encompasses the Adelaidean Fold Belt, the Curnamona Craton and associated supracrustal rocks of the Willyama, Mount Painter and Mount Babbage inliers.
Nonetheless, the geometrical and petrophysical similarities are further demonstrated in their respective gravity profiles extracted across the line of 6500000mN (Figure 21). The geometrical aspect of their waveforms appears broadly similar, displaying duplicate gravity lows and highs in the west and central regions. However, there are obvious inconsistencies in the amplitudes and wavelengths between the two profiles further across to the west of the state. Apart from these apparent differences, the calculated gravity anomalies exhibit slightly higher average intensity values.
 |
| Figure 21. Comparison of traverses extracted across the line of 6500000mN in the deeper crustal-level model; (a) broken line represents response from the model; (b) unbroken line represents response as measured from the field. |