Deeper
Crustal-level Profile Models
Only 7 of the 9 profiles extracted from the South Australian Bouguer
Gravity Map and one additional profile extracted from line 7100000mN
was used to model the deeper-level crustal structures. The length of
each profile also extends east to west from -100000mE to
1000000mE on the Australian Map Grid (Figure 7). No further
traverses south of line 6500000mN were extracted for modelling
because of the suspect gravity data in the coastal region.
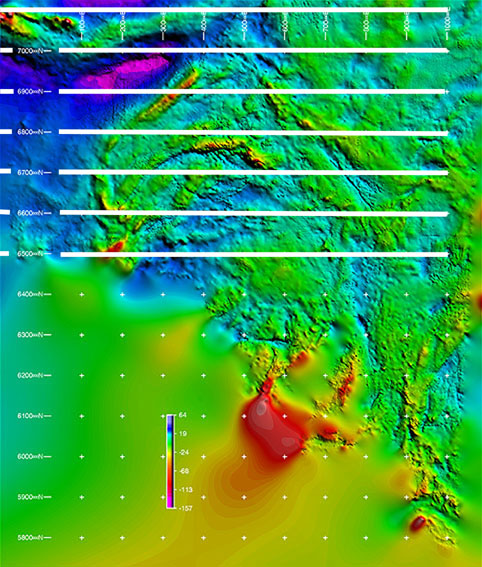 |
| Figure 7. Location of deeper crustal-level profiles extracted from the South Australian Bouguer Gravity Map. |
Profile
6500000mN
The modelled profile differs greatly from that of the other 6500000mN
modelled profile in that lithospheric-scale structures are modelled
to match the longer regional wavelengths. The relatively shorter wavelength,
high amplitude anomalies are essentially ‘smoothed’ out
to show the overall broad varying response of deep-seated structures
(Figure 8).
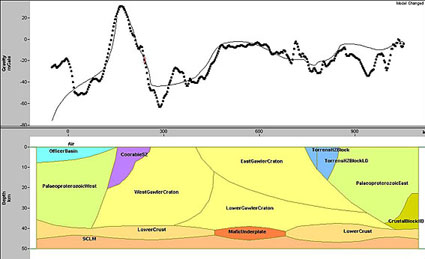 |
| Figure 8. Deep crustal-level profile modelling of traverse 6500000mN. |
Variations in the geometry of the crust show a modelled thickness of ~38-40 km. This point of transition into the lower crust, and the geometry of the lower crust itself varies considerably across the substructure of the craton. The interpreted mafic underplate spatially associated with the magmatic province of the Gawler Range Volcanics essentially bisects the lower crust, demonstrating the thinning of the lower crust surrounding the region.
The eastern boundary of the Gawler Craton remains defined by the Kimban Suture Zone, moderately dipping to the east and separating Palaeoproterozoic supracrustal sequences from the east. The western boundary is defined by the steep gradient of the high amplitude anomaly in the west and modelled as a steeply west-dipping contact zone. Internally, the craton is divided into three cratonic elements to essentially model differences in the Archaean Mulgathing and Sleaford Complexes.
The Officer Basin west of the craton is rather thick with depths ranging greater than ~5 kms. Although not modelled, mismatch of the data in the western end of the profile possibly reflects lateral density variations in the Coompana Block (Flint & Daly, 1993). The high amplitude, relatively long wavelength regional anomaly marking the western Gawler Craton boundary is characterised as the total response of accretionary complexes within the western regions of the Fowler Orogenic Belt. The magnitude of the response indicates this block may extend up to ~20 km in depth. Adjacent to the surface expression of the Kimban Suture Zone is a modelled ‘reworked’ region of the Torrens Hinge Zone defining the transitional zone between sediments of the Adelaidean Fold Belt and the Stuart Shelf.
Profile
6600000mN
The short wavelengths, shallow-level sources superimposed on the regional
response of the craton are clearly demonstrated across this profile.
Modelling of the longer wavelength, regional gravity sources across
this traverse have ‘smoothed’ out spikes in the data (Figure
9).
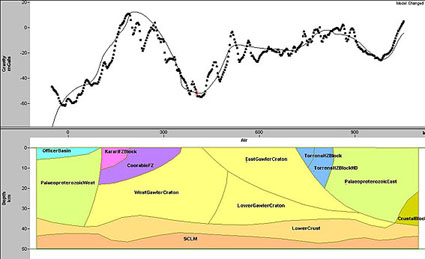 |
| Figure 9. Deep crustal-level profile modelling of traverse 6600000mN. |
The geometry of the lower crust is demonstrated to vary considerably in thickness, ranging from ~4 km to ~12 km. Thickness variations are observed to occur at the interpreted margins of the Gawler Craton where thickness of the lower crust is at its thinness. The greatest thicknesses occur where anomaly amplitudes are at it highest.
The eastern half of the profile is dominated by a large broadly varying anomaly and is highlighted by crustal blocks of the Fowler Orogenic Belt and crustal sequences north of the Karari Fault Zone. The Karari Fault zone is shown to initially dip steeply to the west (in east-west section) and then shallows off at ~ 8 km depth. The steep gradient of this anomaly leading into the extreme negative and gravity low of the profile coincides with the western cratonic margin and the southern region of the Officer Basin. In the west, high-density blocks depicting the ‘reworked’ Torrens Hinge Zone extend to depths of up to ~20 kms. The introduction of a high-density crustal block adjoining the western cratonic margin at the lower crust is found to satisfy the profile across this area. Unlike the modelled crustal blocks in the upper-crustal level models, this block is much deeper (>20 km).