South
Australian two-dimensional Models
The structural and geophysical elements of the Gawler Craton reveal
the protracted tectonic evolution of the Archaean nucleus and its Palaeo-
to Meso-proterozoic orogenic complexes. The distribution of geometries
and the distinct banding of anomalies in different orientations does
not however, allow effective modelling of parallel traverses perpendicular
to geological strike. A total of 9 E-W trending traverses were extracted
for modelling. The gravimetric field response of the Gawler Craton generally
reflects the entire crustal structure upon a superimposed component
of the shallow-level geology. As a consequence, the focus of this exercise
is two-fold and involves matching both; (i) the deeper-level crustal
structures; and (ii) the shallow-level geology, both using constraints
from the South Australian Geoscientific GIS database.
Upper
crustal-level Profile Models
Of the 9 profiles extracted from the Bouguer Gravity Map of South Australia,
6 extend east-west from 50000mE to 1050000mE beginning
at 7000000mN for every 100,000 metres south to 6500000mN
on the Australian Map Grid (Figure 4). Another 2 profiles extend east-west
from 350000mE to 1050000mE, one at 6400000mN
and the other at 6300000mN. The last profile continues east-west
from 450000mE to 1050000mE at a northing of 6200000mN.
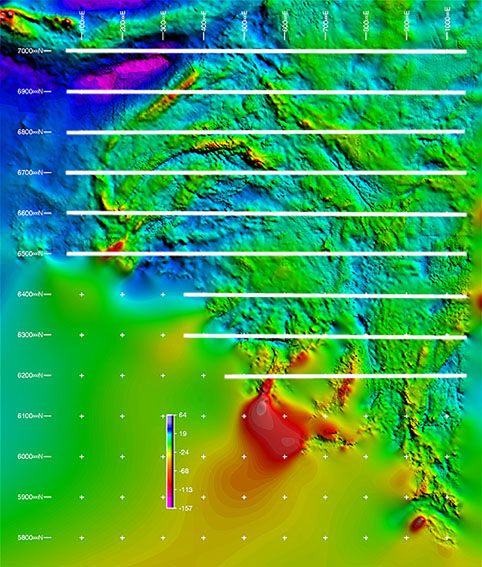 |
| Figure 4. Location of Upper crustal-level Profiles extracted from the Bouguer Gravity Map of South Australia. |
Profile
6500000mN
This modelled geological cross-section provides insight into some of
the major crustal structures of the South Australian lithosphere. The
overall gravimetric response along this profile is dominated by a series
of anomalies of relatively long wavelengths, reflecting the signature
of the Archaean nucleus upon superposition of the shorter wavelength
components of shallow-level sources (Figure 5). The western half of
the profile exhibits a marked range of values in comparison to the eastern
half. The distribution of modelled blocks is consistent with geological
maps and GIS datasets used.
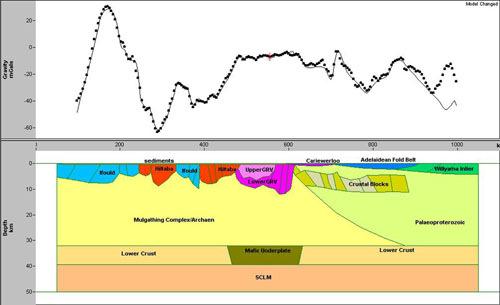 |
| Figure 5. Shallow crustal-level profile modelling of traverse 6500000mN. |
Although continental crustal thicknesses in general vary from 35-45 km, and indication from seismic studies of the South Australian continent which supports a mean crustal thickness of ~38 km (Finlayson et al., 1974; Greenhalgh et al., 1989), a modelled horizontal thickness of ~32km appears to satisfy the gravity data along this profile. Seismic data suggests this depth marks an increase in the crustal velocity and therefore indicates transition into the lower crust.
The eastern margin of the Gawler Craton is interpreted as a shallow tapering, east-dipping wedge that extends into the lower crust and defines the boundary between Palaeoproterozoic supracrustal sequences in the east. This relatively planar, deeply penetrating structure extends to a depth of approximately 32km over a distance of ~300km and has been termed the Kimban Suture Zone (Betts, 1999) which developed during the Kimban Orogeny. The surface continuation of this suture zone is obscured beneath the Cariewerloo Basin and the Gawler Range Volcanics in the central Gawler Craton.
The gravity response of the centre of the profile is dominated by a broad smoothly varying, long wavelength regional anomaly, the source of which is modelled as a horizontal zone of high-density interpreted to represent a mafic body in the lower crust. This significantly wide approximately ~200km and ~7 km thick body lies directly beneath the Gawler Range Volcanics, suggesting a likely genetic link.
Short-wavelength gravity responses in the model reflect the distribution of near-surface sources. The western half of the profile shows the distribution of the Hiltaba Granitoids and associated plutons of the Ifould Complex. The marked change of intensity values across these bodies reflects the changing density properties across the craton. As such, the bodies are modelled as several discrete blocks. Towards the centre, modelled sill-like bodies of the Gawler Range Volcanics are depicted. Modelling of the gravity data suggests the Hiltaba Suite Granitoids, the Ifould Complex and bimodal associations of the Gawler Range Volcanics extend to depths of up to 10 km.
In the eastern half, polygons of the Cariewerloo Basin, the Adelaidean Fold Belt and the Willyama Inlier extend west-laterally from the cratonic boundary. It is noted that variations in the geometry and density values of these bodies do not significantly affect the calculated gravity response. The data suggests these bodies do not extend to a depth greater than several kilometres. A probable source of the anomaly is supracrustal sequences from shallow levels of up to ~10 km as modelled by Betts (1999). In the profile, alternating high and low density crustal blocks have been modelled to represent this.
Profile
6600000mN
In complete contrast to the gravity profile of 6500000mN,
this profile is dominated by a succession of short wavelength, high-amplitude
components, reflecting the influence of shallow-level sources superimposed
against the Archaean nucleus (Figure 6).
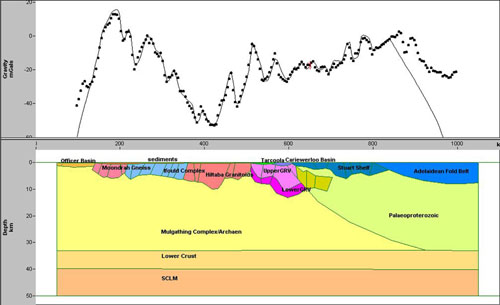 |
| Figure 6. Shallow crustal-level profile modelling of traverse 6600000mN. |
The eastern half of the profile highlights the distribution of the Moondrah Gneiss, the Ifould Complex, the Hiltaba Suite Granitoids and the Gawler Range Volcanics across the craton. The regular ‘rise and fall’ gravity response of these units reveals the strong disparity of density values within individual complexes. In general, each discrete block exhibits a steep west dipping relationship of geometries that extend up to depths greater than ~5 kms. Contrasting punctuated highs and lows in the gravity response generally correspond to boundary contacts between the different units.
The western half of the traverse displays a very similar gravity profile, although exhibits smaller fluctuation of intensities in the data. The Kimban Suture Zone is of similar geometry to that modelled in profile 6500000mN. The calculated response of the Cariewerloo Basin, the Stuart Shelf and Adelaidean Fold Belt once again show little affect against the gravity data without the introduction of several displaced high and low density crustal blocks beneath the Stuart Shelf.