Available Datasets
South
Australian Geoscientific GIS dataset
The intensive data capture programs initiated by the Geological Survey
of South Australia over the last few years has resulted in an extensive
collection of data, the compilation of which has now been assembled
into the South Australian Geoscientific Geographical Information System
(GIS). This spatially integrated bibliographic collection of data is
a state-wide integration of geological, geophysical, geochemical and
cultural data aimed at distributing regional geoscientific information
for exploration and research (www.pirsa.com).
A number of selected databases were selected from the South Australian
Geoscientific GIS dataset. These include summary digital geology of
rock outcrops, basins and geological and tectonic provinces. In addition,
databases of drillhole stratigraphy and geochemical sampling related
to single points on the ground were selected for analysis and interpreted.
South
Australian Gravimetric dataset
The regional gravimetric field dataset used in this study was derived
from Primary Industry and Resources, South Australia (PIRSA). This dataset
is a reduced and corrected Bouguer Gravity map covering the entire state
of South Australia (Figure 2). The station spacing configured for acquisition
of this dataset is variable with an average spacing of approximately
8 km. Each gridded image-cell is also of approximately 200m.
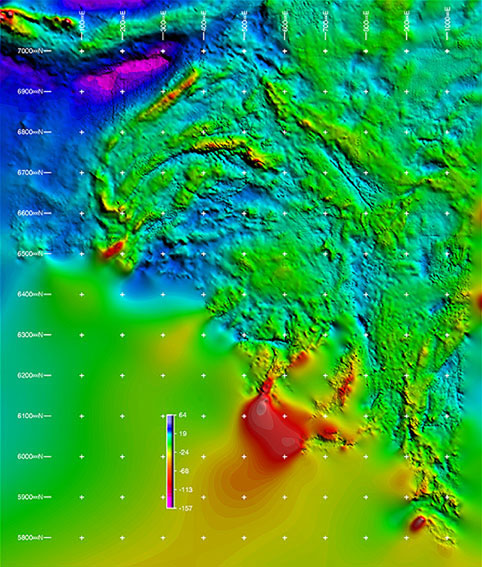 |
| Figure 2. Gravimetric dataset of South Australia. |
Image
Enhancement
The gravimetric dataset gridded by MESA have been processed using the
Intrepid™ software. This was performed using filtering algorithms
to visually enhance the effects of selected geological features, thereby
enhancing different facets of the dataset. The filter used in this investigation
is a matched filter (Cowan & Cowan, 1993). A matched filter, in
theory, provides a separation of frequencies for different depths. The
image will ideally contain information from a certain depth level while
signals from other depths are attenuated. All images were subsequently
displayed in ERMapper™.
Petrophysical
Investigations
Rock density data was used as the primary constraint for the geophysical
modelling. However, published information on the measurements of densities
for rocks of the Gawler Craton and its surrounds is limited. The average
rock densities used in this study are presented in Table 1, the majority
of which were derived from Gow (1997). Density estimates inferred for
particular rock types are also presented in Telford et al (1995). All
densities used in the modelling have assumed heterogeneous characteristics
that are derived from geologically reasonable estimates and therefore
represent a wide range of values.
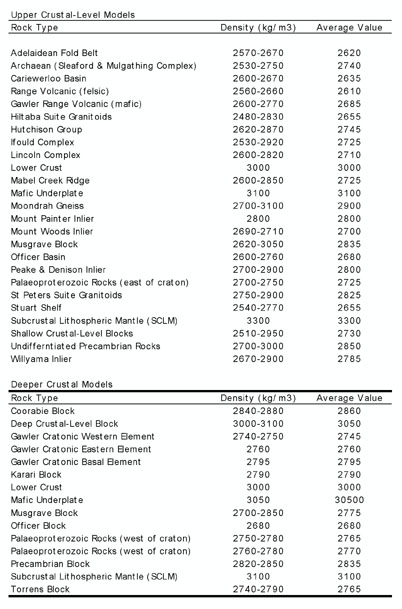 |
| Table 1. Rock density values of major crustal blocks of the Galwer Craton and surrounds (after Gow, 1997 & Betts, 1999). |