Discussion
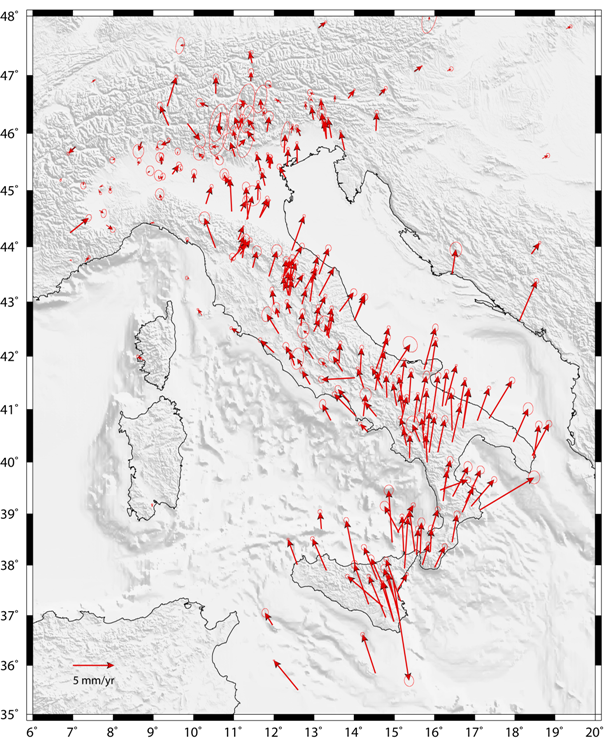
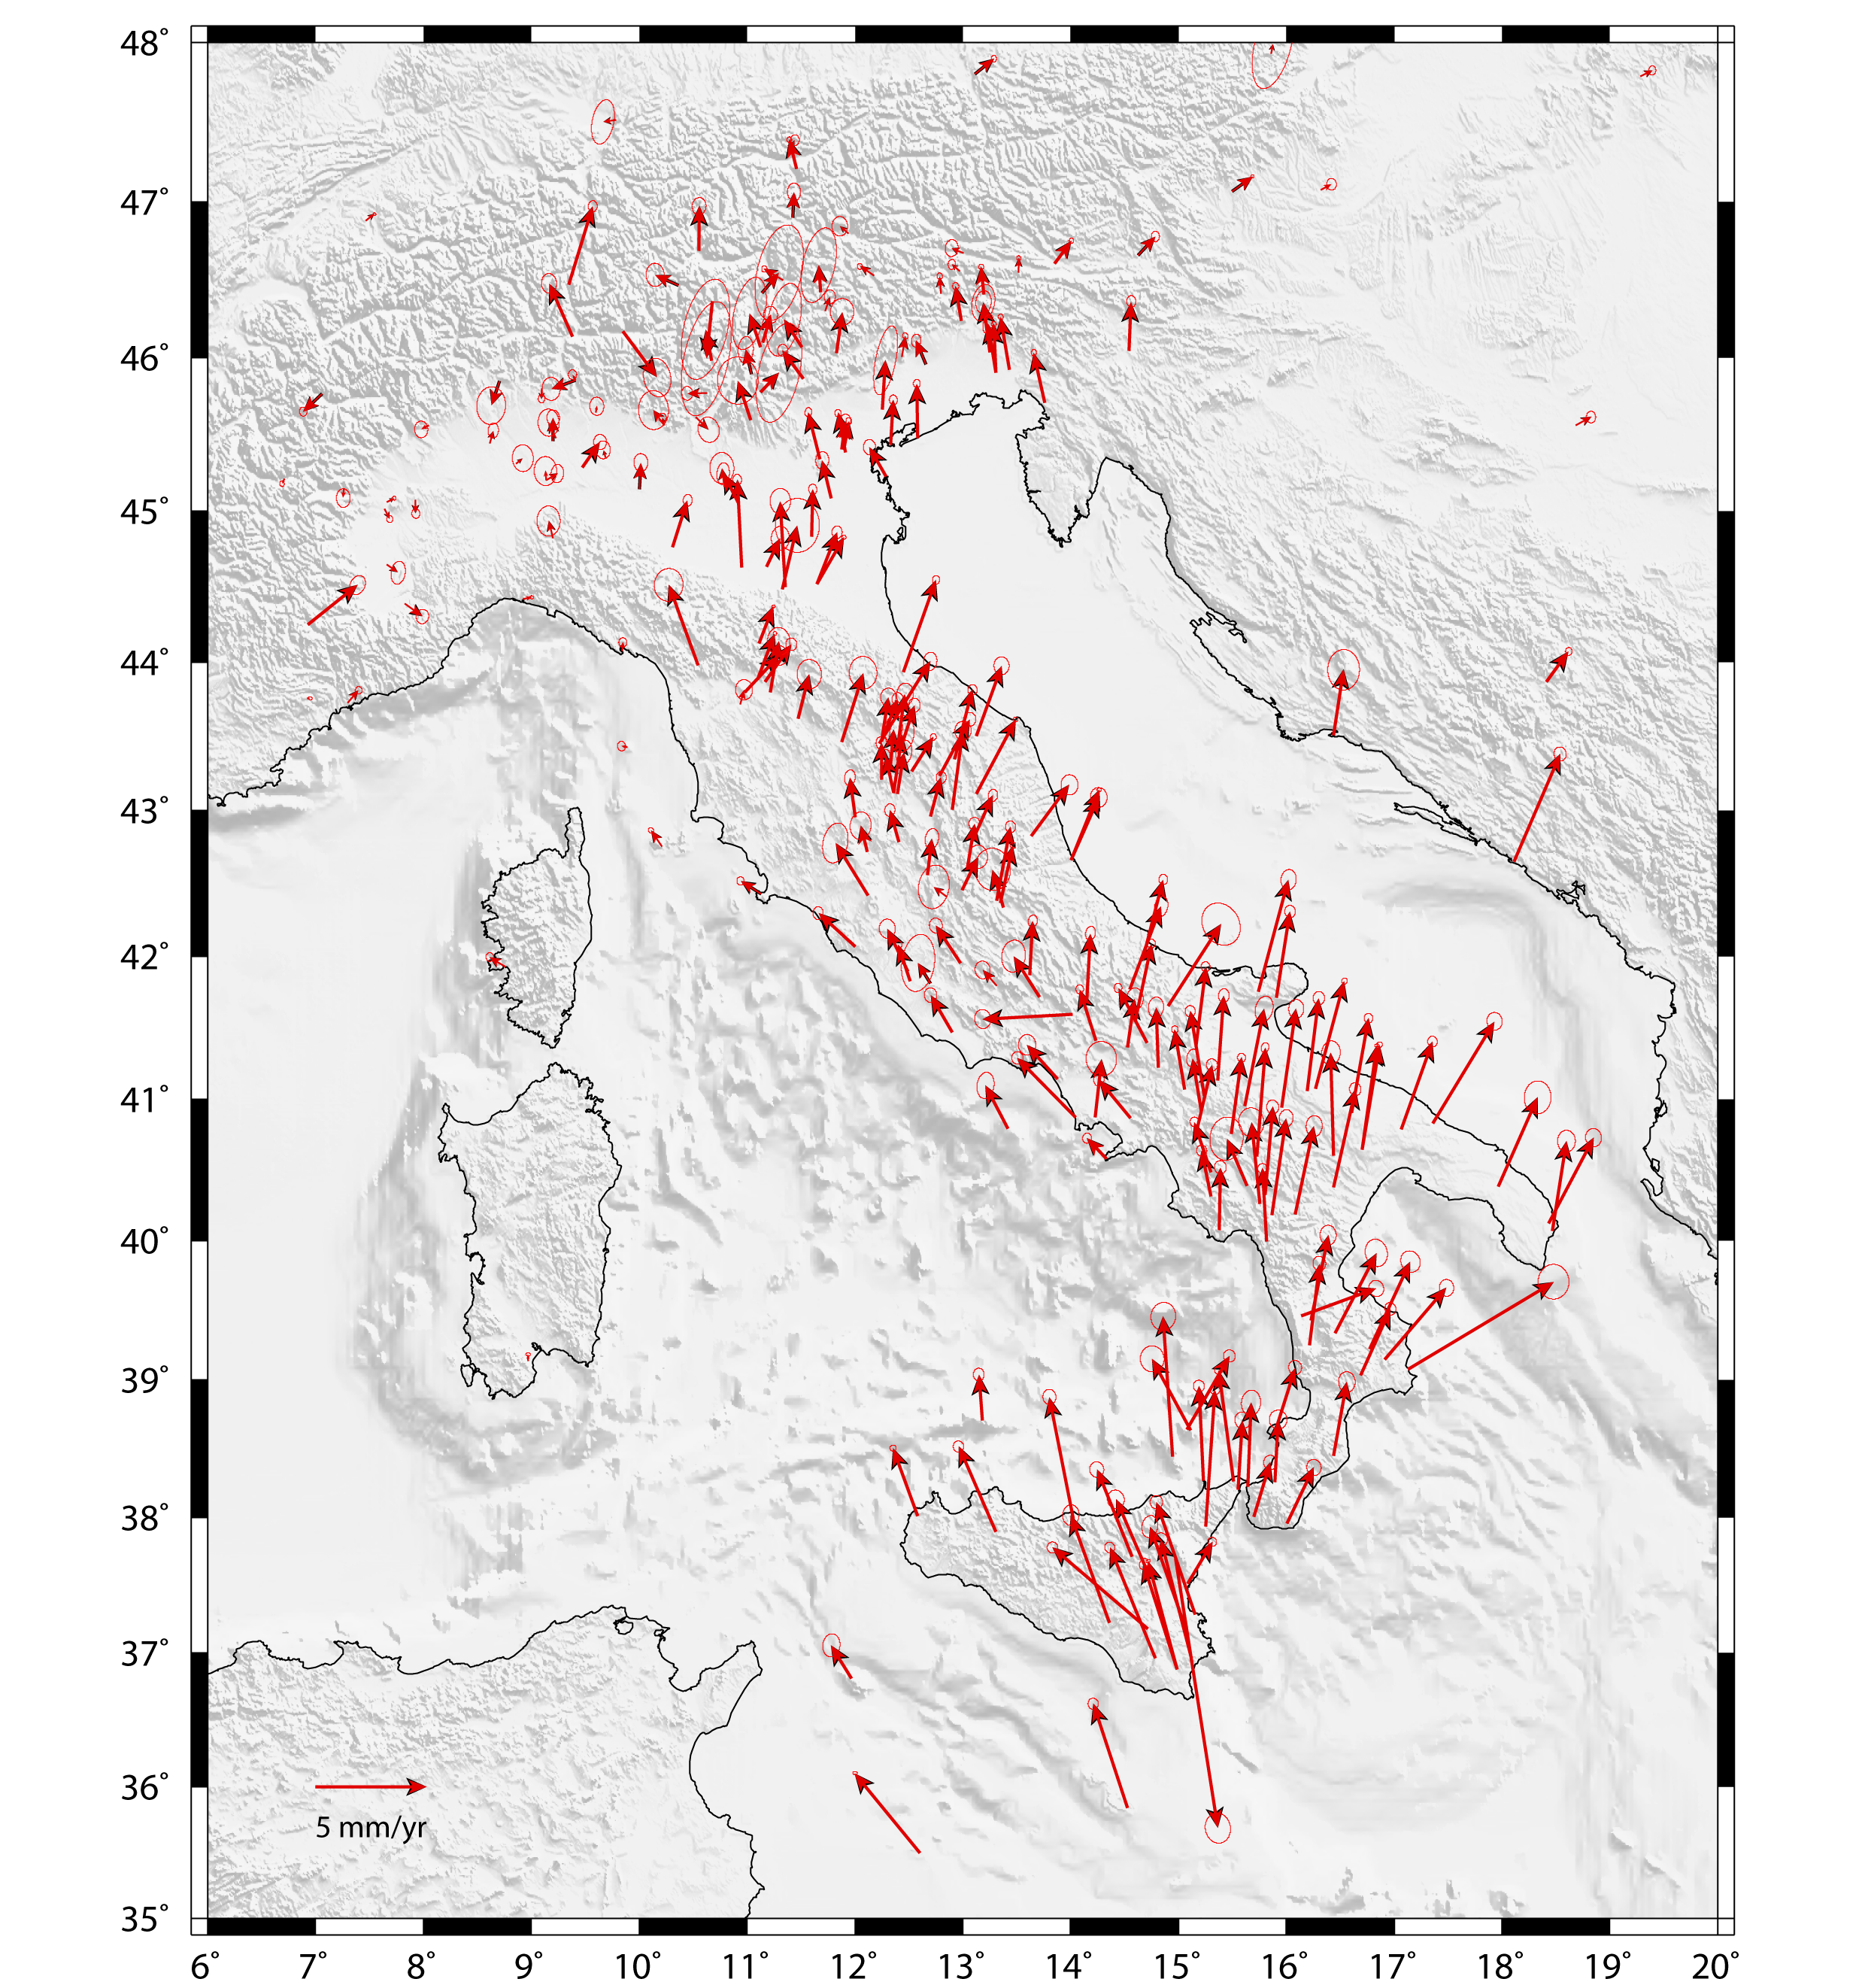
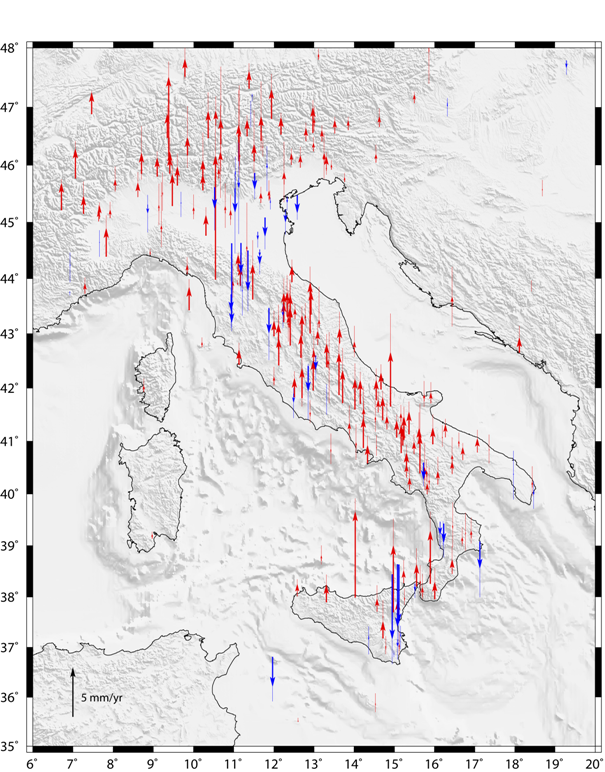
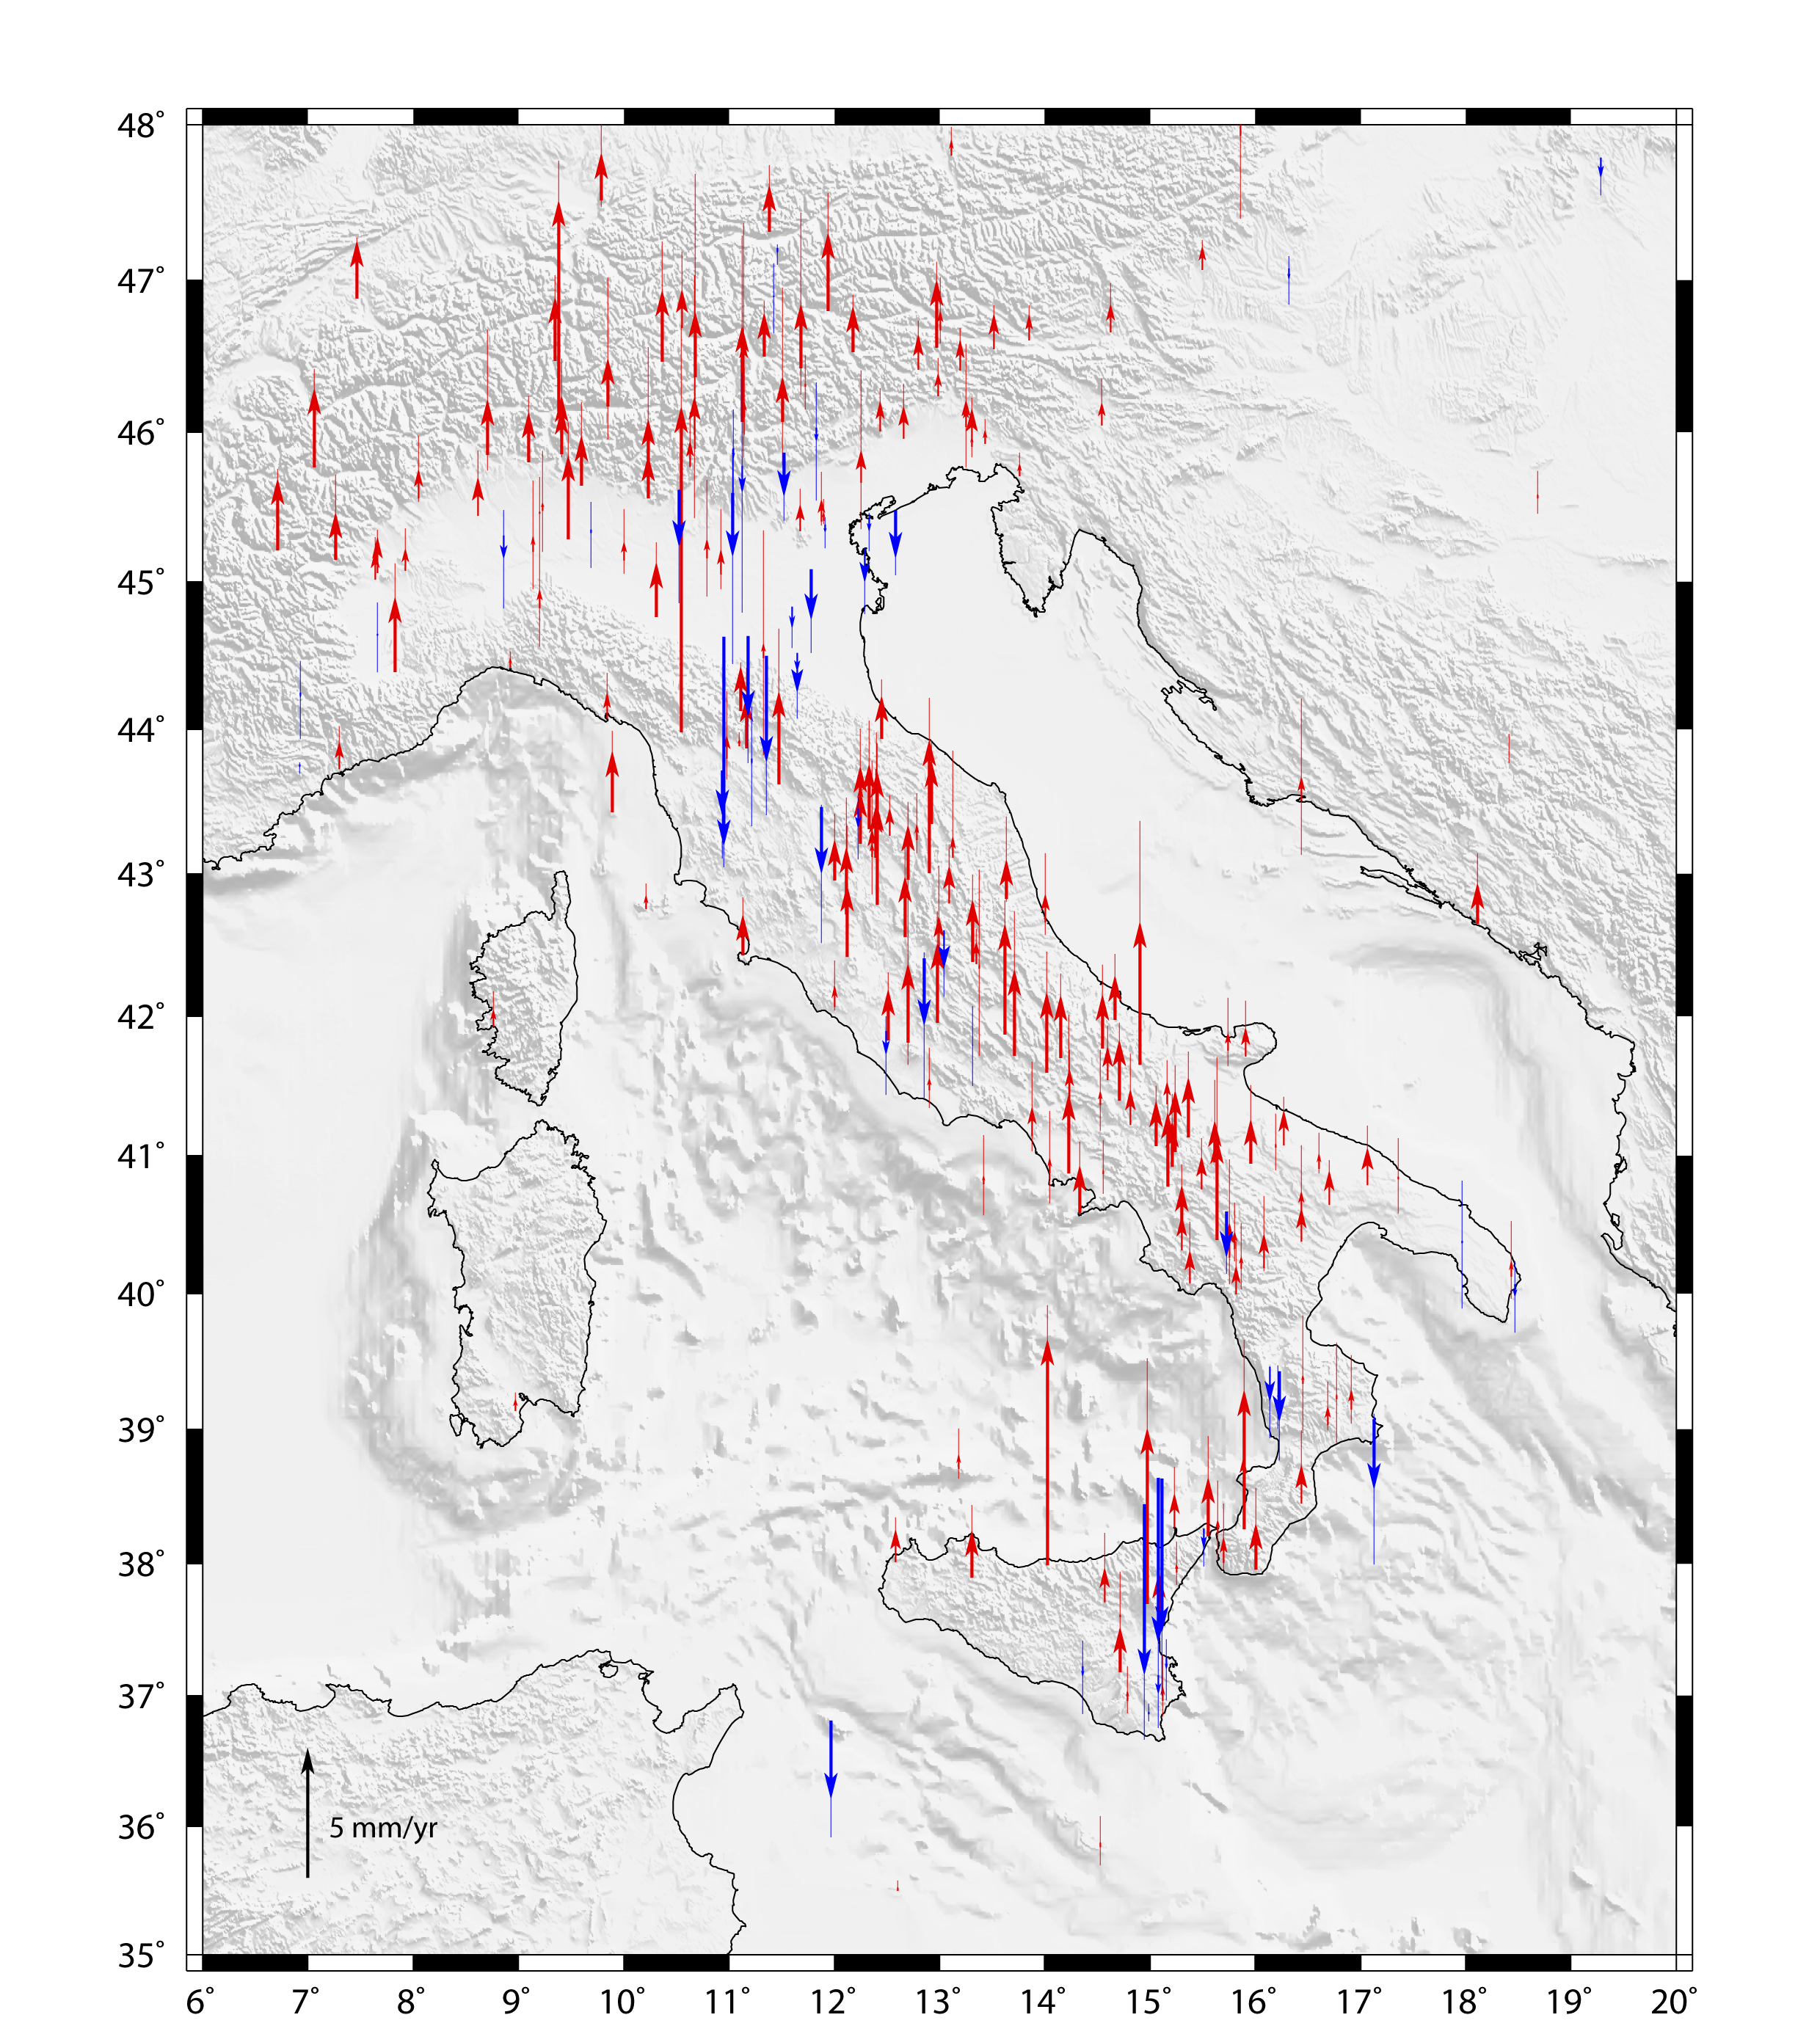
Figure 3 shows the horizontal velocity field of the combined solution w.r.t. Eurasia (Devoti et al., 2008), the error ellipses being the formal 1-sigma confidence regions (68% confidence region), whereas Figure 4 shows the combined vertical velocity field. The GPS network has been selected based on a data persistence criteria - only sites with more than 2.5 years of continuous position determinations has been considered, thus minimizing biases due to seasonal signals (Blewitt and Lavallée, 2002), a total of 287 sites satisfy this criterion. Despite the rigorous selection, the vertical velocity field should be taken with care because the vertical component can be largely affected by a number of systematic effects, including: tropospheric mismodeling, change in environmental noise (multipath), monument instability, etc. Moreover, the scatter of the vertical rates are a factor of 2-4 higher than the horizontal components.
Figure 3. GPS horizontal velocities with respect to Eurasia.
GPS combined horizontal velocities with respect to Eurasia fixed reference frame. Only sites with more than 2.5 years of observations are shown.
Figure 4. GPS vertical velocities.
GPS combined vertical velocities with respect to the reference ellipsoid. Sites with more than 2.5 years of observations are shown.
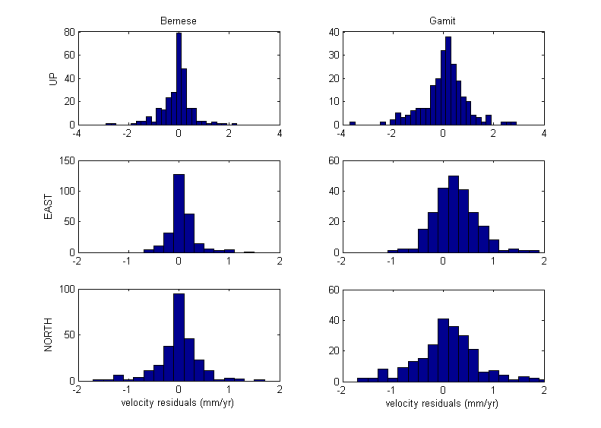
The velocity values are reported in Table 1 (subscribers can download from http://virtualexplorer.com.au/article/2010/237/kinematics-of-italy/pdf/table1.pdf), associated with the Bernese and Gamit time-series repeatability (WRMS of residuals with respect to the linear trend). It is worthwhile to note that not all sites have similar noise content; the WRMS in the horizontal components for long-lasting sites is typically around 1-3 mm, whereas the vertical components are on the order of 4-6 mm. In particular, a few sites (ESLN, LATT) that demonstrated an anomalous high scatter should be treated with care when studying tectonic motion, since periodic variations may be attributed either to instrumental malfunctions, anomalous multipath noise or mismodeled residuals. Subtle variations of site positions may arise also from local geophysical processes (water table variations, landslides, etc.) or site effects (soil compaction, monument type or foundation effects). All these effects may produce aliasing in the estimated secular trends and could explain a few ‘anomalous’ velocities from a tectonic perspective. Figure 5 shows the velocity residuals of the single solutions with respect to the combined velocity field in the vertical and horizontal planes. The Gamit velocity residuals show a slightly broader distribution than the Bernese residuals, which reflects the difference in the relative weights that have been estimated in the combination process.
Figure 5. Velocity residuals.
Velocity residuals with respect to the combined solution in the topocentric reference frame (up, east, north).
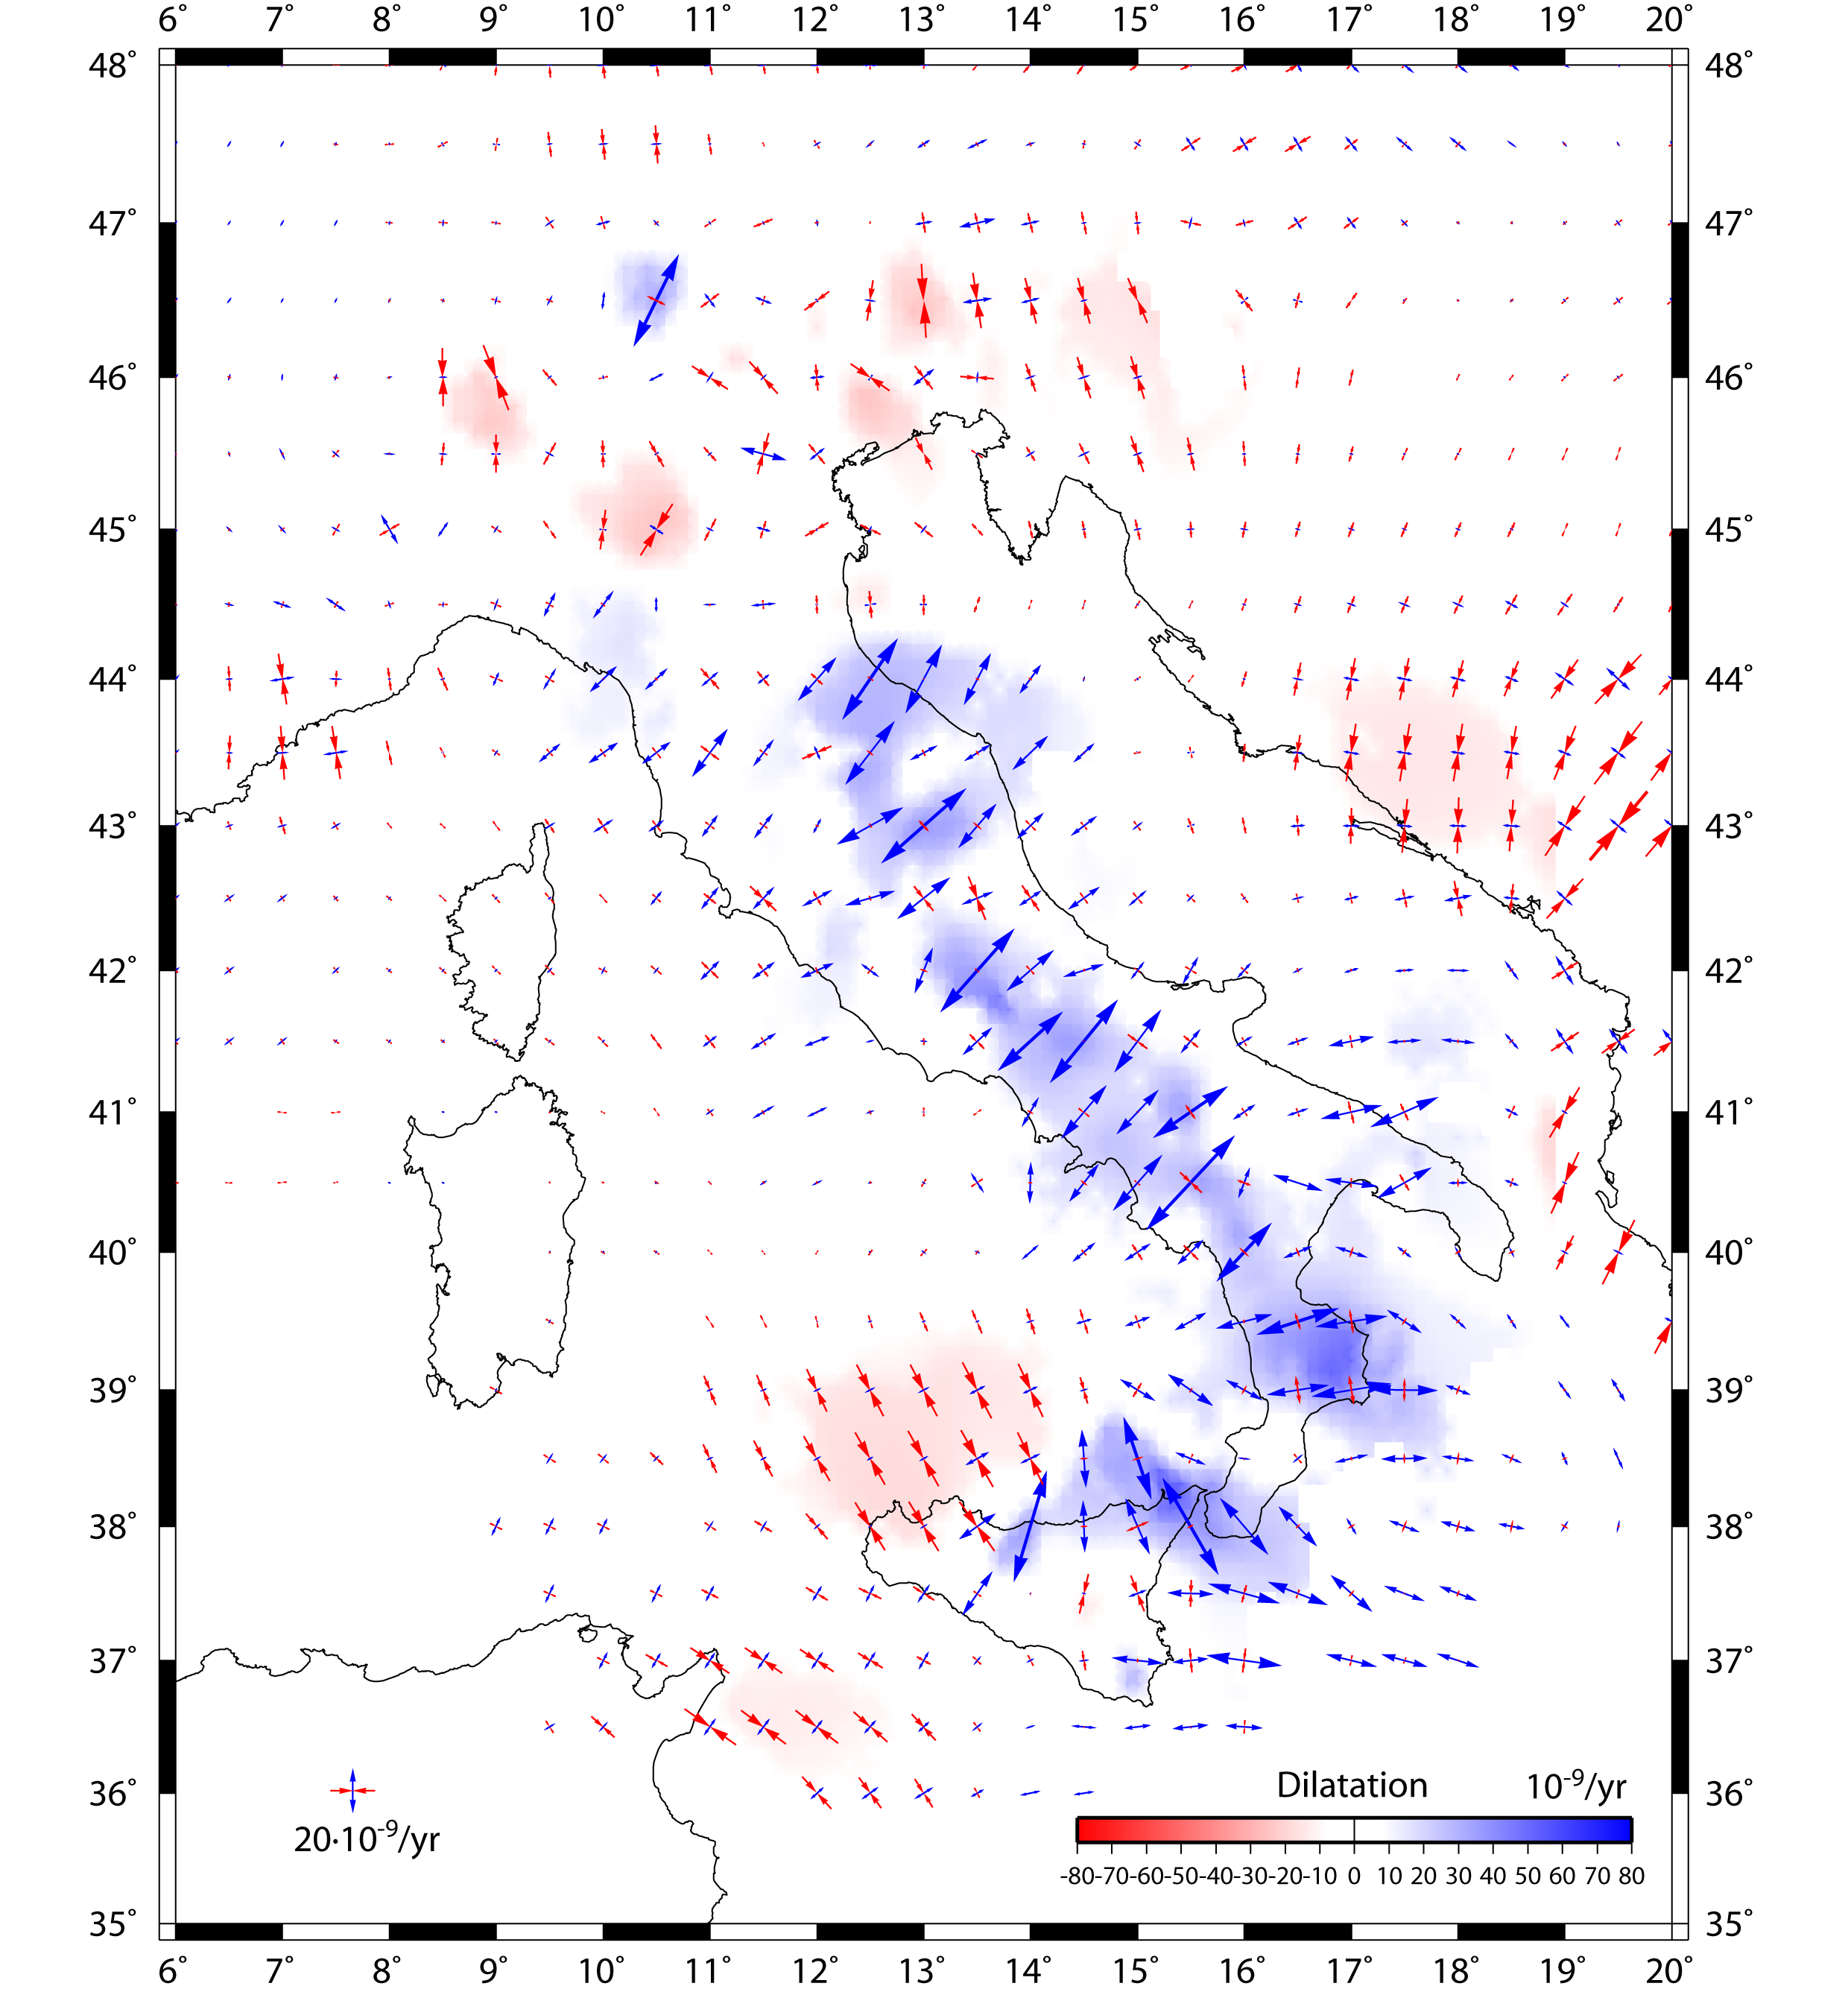
Figure 6. Strain rate map of Italy.
Principal strain-rate axes interpolated on a 0.5°x0.5° grid and two-dimensional dilatation rates obtained from a selected set of site velocities.
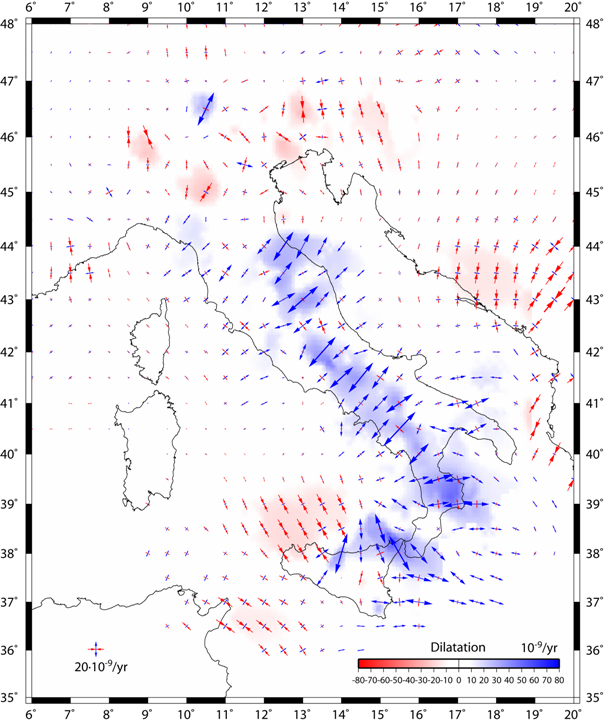
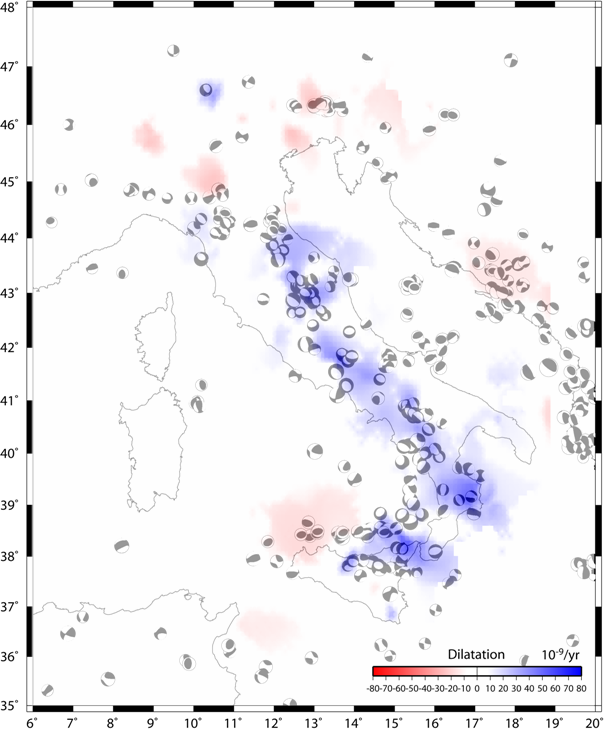
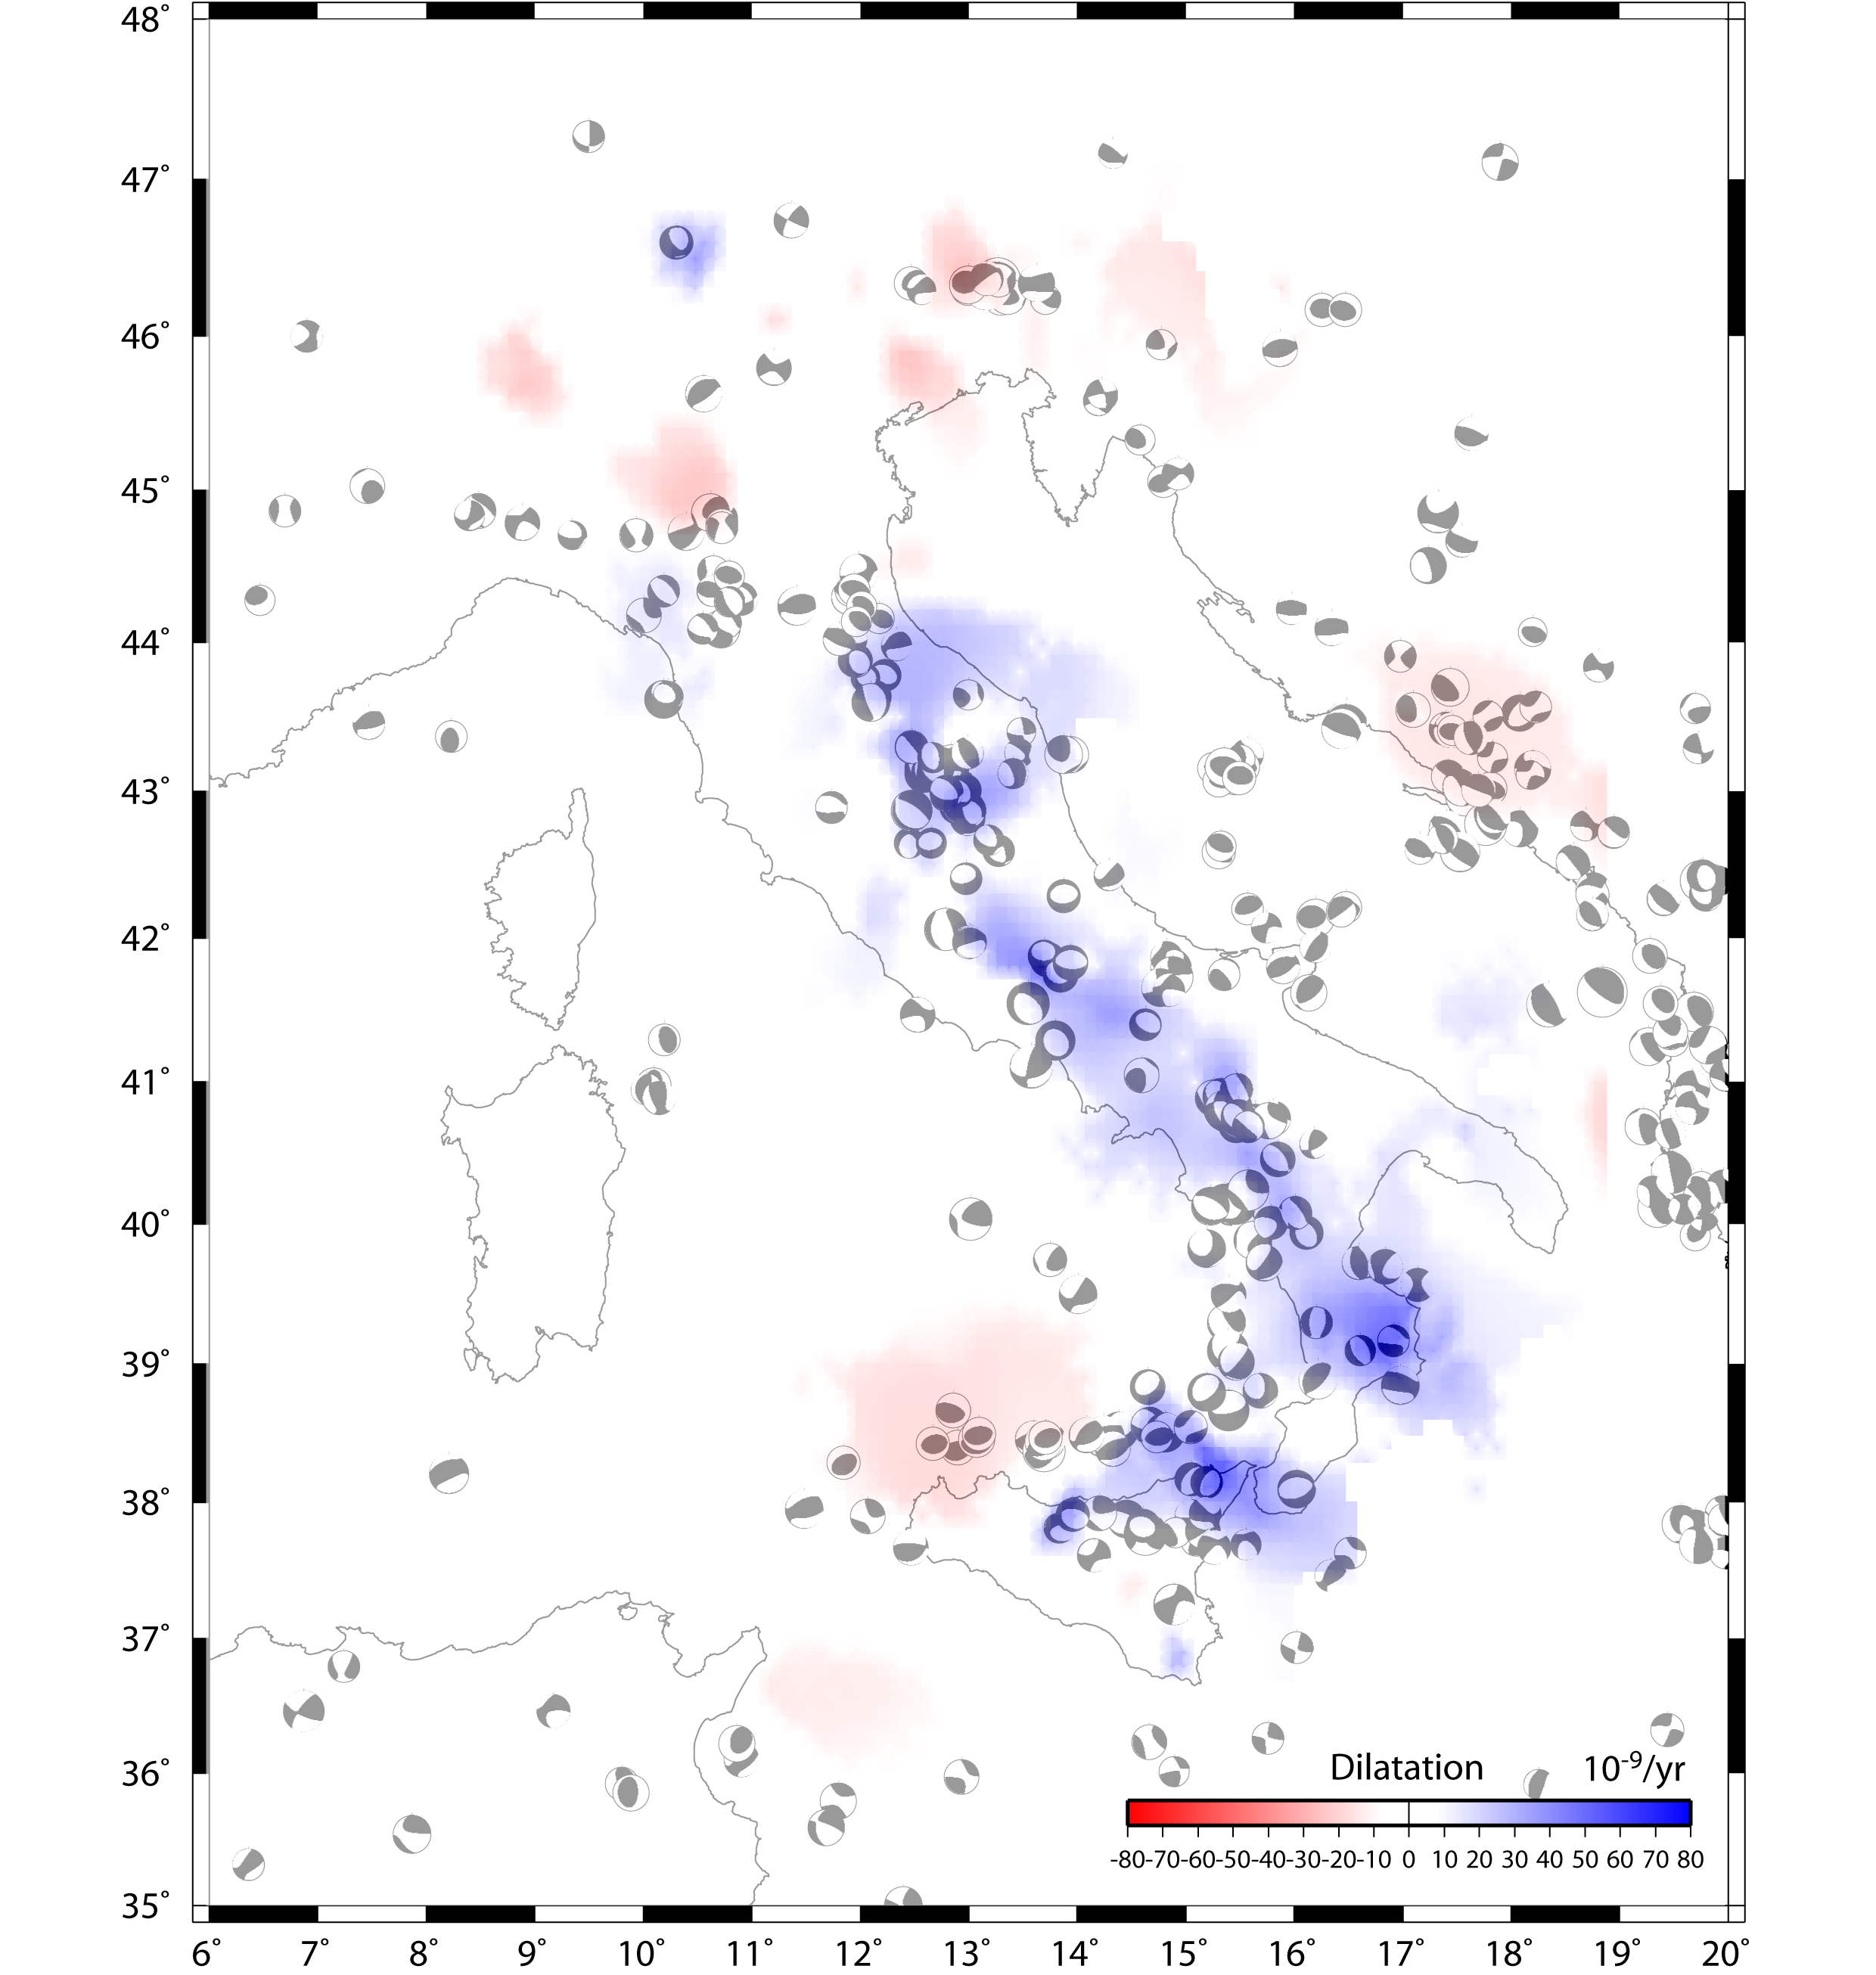
Figure 7. Dilatation rates and seismicity of Italy.
Two-dimensional dilatation rates and focal mechanisms from 1976 to 2010 (RCMT catalogue, Pondrelli et al., 2010).
In figure 6 we present the principal axes of the strain-rates interpolated on a 0.5°x0.5° grid derived from the combined velocity field, superimposed on the 2-D dilatation field (red compressional and blue extensional dilatation) using the algorithm described by Shen et al., 1996. To obtain a smoother map of the dilatation rate, we have interpolated the velocity field on a 0.1°x0.1° grid. A variable smoothing factor (from 20 to 150 km) is applied to the velocity data. In addition, to avoid fake strain-rate features, isolated velocity vectors that differ significantly from their neighbours have been edited from this computation. All the non-significant strain-rate values on the maps are plotted as zero strain-rates.
The extensional belt along the Apennine chain is the most relevant feature recorded by our combined GPS velocity solution, and it represents the most distinct deformation observed in the Italian area. Typical values range between 20-60∙10-9 yr-1, with a variable magnitude along the chain. Significant shortening associated with pure compressional dilatation is noticeable in the Dinaric Arc, the eastern Alps and offshore north-west of Sicily. Figure 7 shows the dilatation field associated with the seismotectonics of the region. The focal mechanisms are extracted from the RCMT catalogue (Pondrelli et al., 2006), relevant to the seismicity recorded in the period 1976-2010. The geodetic deformation is clearly associated with the seismic deformation styles in large domains, thus emphasizing a correlation between crustal deformation and the occurrence of earthquakes in this area.