The model discussed here was initially developed for SE Asia (Hall, 1996, 1997a), extended to include the SW Pacific (Hall, 1997b, 1998) and is being continually updated to include new data. A complete account of the most recent plate tectonic model accompanied by animations is in press (Hall, 2001) in which there is an extensive bibliography. The reconstructions were made using the ATLAS computer program (Cambridge Paleomap Services, 1993). The model now includes approximately 120 fragments in SE Asia and the SW Pacific. It has been animated using 1 Ma time-slices.
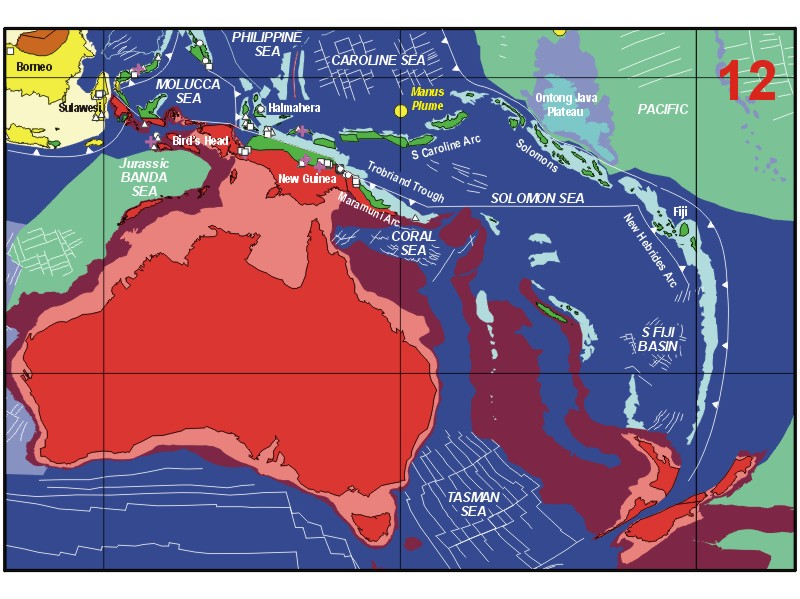
Present coastlines are used in the reconstructions and most fragments retain their current size so that they remain recognisable. In some regions, such as extended continental margins and volcanic arcs, changes in area and volume of crust are likely to be significant. During collision, contraction may have also changed dimensions of fragments. The model simulates such changes an approximate way by modelling deforming areas as multiple fragments, allowing overlap of fragments, and represented some in a stylistic manner to convey the processes inferred. The colour scheme indicates the nature of the crust and principal regional features (Figure 6). One aspect of the use of colour needs to be emphasised. Dark blue is the default background colour. Reconstructing backwards from the present creates space, for example, by undoing the effects of subduction ÔunsubductedÕ crust is coloured dark blue. However, most fragments do not change size or shape and gaps may open up between fragments which are coloured dark blue but may not represent ocean crust. In some cases gaps have been filled by allowing fragments to overlap, but it is important to be cautious in inferring the nature of the crust between fragments merely on the basis of the colour used in the reconstructions.
The reconstructions are produced using the PC-based ATLAS (formerly at http://www.atlas.co.uk/cpsl/) palaeogeographic mapping program which draws each map with the appropriate projection. Producing the final animation has a number of further steps. The maps are generated as Postscript files to which most plate boundaries are added by hand in CorelDraw. VisualBasic programs in CorelDraw are used to generate rapidly the multiple images required for an animation. For this paper, bitmaps were used to produce QuickTime Movies and animated gifs. Bitmap movies are relatively small files, and can be very quickly advanced and reversed, but are limited to fixed display resolutions. Other animations, such as Powerpoint, are larger and slower but have the advantage that a vector format can be used for individual images which are then independent of display resolution and can be copied and pasted into publications without loss of quality. The filenames here indicate the resolution and type of the animation (e.g swp_xvga.mov). They have a number of screen resolutions: VGA (640x480), SVGA (800x600) and XVGA (1024x768) indicated by a suffix. Quicktime movies have the file extension .mov. and animated gifs have the extension .gif.
Animation 1. Computer animation XVGA (1024x768)
The studied area matches the last frame of the computer animation found at Figure 3. See text for explanation.
Animation 2. Computer animation VGA (640x480)
The reconstructions are produced using the PC-based ATLAS (formerly at http://www.atlas.co.uk/cpsl/) palaeogeographic mapping program which draws each map with the appropriate projection. The studied area matches the last frame of the computer animation found at Figure 3. See text for explanation.